
Geodesy of Kachchh
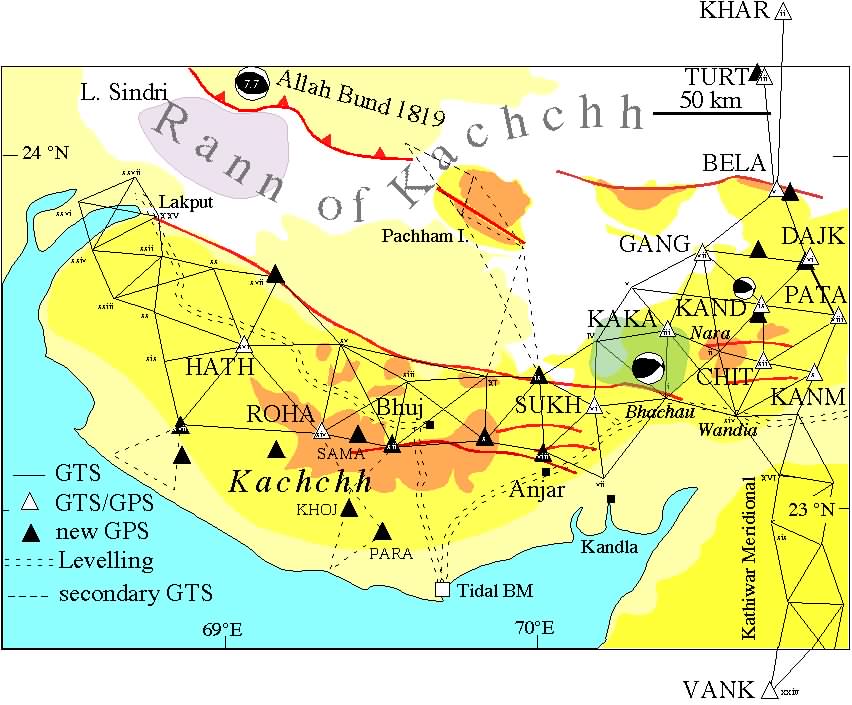
The Cutch Coast Series (Strahan, 1893) was measured first in 1868 and follows the line of hills along the length of the Kachchh mainland. Points near the epicenter are shown in the map below. Many of the points were intact in 1892 but because of the fissile nature of surface rocks numerous small pillars were constructed that may have now collapsed or have been vandalized. See site descriptions for a map of control point distribution compared to the anticipated deformation zone.
Points at Bachau (I), Wandia (II) and Nara Hill Station (XIV) were destroyed by the earthquake. At Narra the rubble observing platforms acted as inertial masses during the earthquake and destroyed both upper and lower marks of the trigonometrical pillars.
Eighteen Great Trigonometrical Survey (GTS) points were recovered to an accuracy of 1 cm or better, a dozen of which are within 100 km of the epicenter. Seven new points have been installed for post-seismic relaxation studies.
An earthquake in November 1856 caused misclosure of a triangulation figure by several minutes of arc (this is mentioned both in the volume 14 of the SOI and in the Synoptical volume of the Cutch Series, however, the location of this triangle is not clear from the Kathywar Series Narrative. We tentatively place it north of Bela since the survey party was working in the northern Rann at the time. Another earthquake in January 1857 damaged survey monument vii 20 km ESE of Anjar. Errors near the western end of Kachchh (Lackhput) were higher than normal (±15 µrad) due to poor refraction conditions, but it appears that the errors are less than 7 µradians in the east where coseismic angle changes exceeding 100 µrad are anticipated.
Two investigations were started (1 Feb 2001 with repeat measurements in July 2001 :
1) to determine the coseismic deformation field by measuring the present disposition of points measured in 1856/7, and
2) to determine the way in which deformation is distributed in the coming two decades as the lower crust responds to the sudden change in surface strain.
The figure below illustrates the anticipated crustal response. The rates of growth of the surface deformation field (roughly 1 mm/month in the first 6 months) will be used to constrain the rheological properties of the lower crust.
The list below indicates GPS vs GTS/GTS site occupations in February. The ± symbol means uncertain eccentricity.
| PARADI | 22°56' | 69°31' | 69.518 | 22.933 | new |
| KHOJACHORA | 23°01' | 69°25' | 69.411 | 23.001 | new |
| SAMATRA | 23°11' | 69°29' | 69.477 | 23.183 | new |
| VARAR | 23°20' | 69°33' | 69.550 | 23.333 | destroyed |
| GOPP | 22°03' | 69°55' | 69.909 | 22.050 | new |
| PARA | 22°56' | 69°31' | 69.518 | 22.937 | new± |
| SAMATRA(NEW) | 23°10 | 69°33' | 69.55 | 23.167 | XII± |
| SANDHAN | new | ||||
| ROHA | 23°12' | 69°19' | 69.316 | 23.2 | XIV |
| NARA | 23°40' | 69°10' | 69.166 | 23.666 | new |
| ASAPARA MATA | 23°11 | 69°51 | 69.85 | 23.183 | X± |
| JHURAN | 23°22' | 70°1' | 70.016 | 23.367 | new |
| SUKHPUR | 23°17' | 70°12' | 70.2 | 23.283 | VI |
| KAKARAVA | 23°30' | 70°26' | 70.433 | 23.5 | III |
| KANMER | 23°24' | 70°44' | 70.733 | 23.55 | X |
| PATA I SHAH | 23°33' | 70°59' | 70.983 | 23.55 | VIII |
| CHITROD | 23°24' | 70°44' | 70.733 | 23.4 | XI |
| KANDUKA | 23°34' | 70°44' | 70.733 | 23.733 | IX± |
| NALIYA | 23°14' | 68°52' | 68.866 | 23.233 | new |
| CHARAKDA | 23°9' | 70°2' | 70.033 | 23.15 | new |
| DAJKA | 23°42' | 70°52' | 70.866 | 23.7 | new± |
The table below indicates 1856/7 GTS sites recovered and measured in July 2001 to cm accuaracy. The points (mostly from the Kathiawar series with exceptions as indicated) can be re-occupied to mm accuracy.
| III Cutch | KAKA | 24.3363 | 70.8031 |
| VI Cutch | SUKH | 23.2805 | 70.1644 |
| VII | GANG | 23.7349 | 70.5396 |
| XI | CHIT | 23.3919 | 70.7253 |
| V | BELA | 23.9033 | 70.7980 |
| VI | DAJK | 23.6923 | 70.8677 |
| VIII | PATA | 23.5569 | 70.9858 |
| IX | KAND | 23.5600 | 70.7305 |
| X | KANM | 23.3976 | 70.9188 |
| XXIV | VANK | 22.6024 | 70.9749 |
| XXXVI | SAKH | 21.5552 | 71.5553 |
| XXXVII | MANA | 21.3634 | 71.1337 |
| II | KHAR | 24.5724 | 70.7913 |
| NAGR | 24.3229 | 70.7901 | |
| III | TURT | 24.3367 | 70.7618 |
| XVI Cutch | HATH | 23.4546 | 69.0459 |
| XIV Cutch | ROHA | 23.2017 | 69.2737 |
The geodetic measurements are being used to determine the strike, dip and slip of the Bhuj rupture (note relation of observed points to inferred dilatational strain field above). A subset of points are being measured repeatedly to deterine visco-elastic recovery of the region following the earthquake. The viscous signal is generated by flow in the lower crust a cartoon of which is shown below. The coseismic slip indicated is probably about twice as large as the actual slip in the January earthquake.

Strahan, G., Synoptical Volume XXXIII of the Great Trigonometrical Survey of India, The Cutch Coast Series (or series L) of the South West Quadrilateral, Dehra Dun 1893.