
Superstition Hills, Imler Road, Creepmeter coSH (updated Oct 2009)
Link to recent data
Following many years of steady slip at 1.35 mm/yr, a dozen creep events occurred between 3 Oct 06 and 11 Dec 06 resulting in total slip of the Superstition Hills fault of 28.5 mm. In the five months following this slip sequence the creep rate on the fault was steady at double its pre-event annual rate. The rate 2008-9 is now 0.95 mm/yr, i.e at a rate 40% below its pre-event rate. The figure shows creep rates on the San Andreas and Superstion Hills fault 2 years before and two years after the creep-event.
The data prompted an InSAR study by Wei et al (2009).
Wei, M., D. Sandwell, and Y. Fialko (2009), A silent M w 4.7 slip event of October 2006 on the Superstition Hills fault, southern California, J. Geophys. Res., 114, B07402, doi:10.1029/2008JB006135.
32.9301°N, 115.7009°W (map from Google Earth) Access to calibrated real time telemetry (name=geo, password=hobo). Telemetry was down Jan-April 07 although internal recording assured no loss of data.

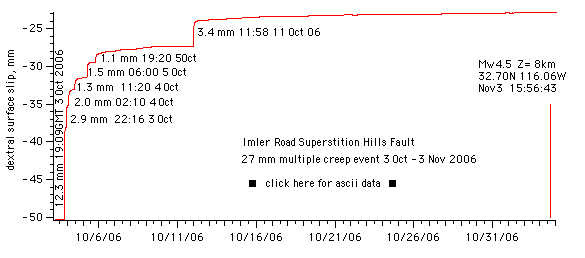
3 October 2006 - an unusual 27 mm multiple creep event on the fault
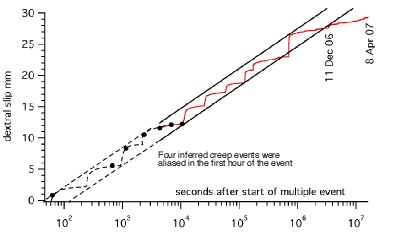
Following many years of surface slip at less than 1.5 mm/yr the 1987 surface rupture of the Superstition Hills fault slipped more than 27 mm in October 2006. The creep sequence consisted of 3-4 early events whose time history is poorly determined, followed by eight well-recorded sub-events, six of which occurred 3-6 October. The log/linear plot below shows that the timing between the subevents in the sequence increases exponentially as a function of elapsed time.
Although only one continuous recording site operates on the fault, David Sandwell, Yuri Fialko and Danny Brothers report at least 11 km of surface slip centered on the creep-meter. En echelon cracks have appeared on the newly repaired Imler Road crossing on the fault (see photos below). The crack were still visible in April 2007.
The present period of continuous recording was started in March 2004. No creep events occurred 4/17/04-8/27/04 but these data were accidently lost after retrieval. The instrument lies on the Superstition Hills Naval base and consists of a 6 m invar rod installed at 30 degrees to the fault held in tenson by centering springs. The range is 32 mm, and the resolution 10 µm. The (corrected) coordinates are 32.9301°N, 115.7009°W. The low power creep-meter is described in Bilham et al., (2004) and is designated Site 1 in Bilham (1989).
The 2004-2006 creep rate is 1.35 mm/year (least squares fit). Dextral creep events occurred 11 Aug 2005 with an amplitude of 0.5 mm, 20 January 2006 with an amplitude of 0.35 mm, and starting 3 October 2006 with an amplitude of more than 26 mm. A diurnal thermoelastic signal is present in the data with an amplitude of 20-30 µm in response to 2-5°C daily subsurface variations, but the 25°C annual thermal signal has very little seasonal effect on the data. The 0.2 mm left-lateral signal in the data in the first half of 2005 is related to rainfall. Note, however, that the rainy season in 2006 caused no left lateral signal. Compared to the 27 mm creep event the signal-to-noise level in the instrument is >1000:1. No slip was triggered on the Superstition or San Andreas fault following a Mw=4.5 earthquake 3 Nov 06 41.7 km to the southwest of Imler Road.

Download coSH 10 minute data 3/24/04 12:00-6/26/2006 04:00 GMT to July 2006 - a 3.9 Mb space-delimited text file with four columns, and 118610 rows (too large to be read in Excel). The columns, following a one line header are: date, GMT hour, mm of dextral slip, and temperature in degrees C.The creep datum is arbitrary and the dextral slip values are given in mm to four decimal places only two of which are significant (0.01 mm). The resolution of the 12 bit A-D converter is ≈10 µm. Download March 2004 to 4 October 2006 (zip file). Four columns - GMTdate, GMTtime, dextral slip in mm (accurate to 10µm- two decimal places only), Temp in °C (accurate to 10 millidegrees).
Download or View incoming telemetered data ten minute samples in local Ca time as mm of dextral slip. Updated every two hours. The following plot shows the first five subevents of the creep slip sequence that commenced 3 Oct 2006 at 19:10 local time. See incoming data for cumulative slip to the present (you will need user name =geo, password=hobo). Download event data 3-12 Oct 2006.

By 12 October the 3 Oct '06 creep event consisted of four inferred and seven subevents with a total slip of 26 mm. The fault slipped a further 2 mm by 3 November. A similar large event was reported by RV Sharp on the fault roughly a decade before the 2006 event. Start times of most subevents and their asymtotic decay curves fit within a 2.3 mm envelope on a log/linear plot (below). The trend to 8 October suggested the possibility of a seventh sub-event sometime before 15 Oct. bringing cumulative slip in October to ≈24 mm. The anticipated seventh event occurred 12 Oct and overshot the logarithmic decay curve by 2 mm. An eighth creep event was anticipated before mid-December (see log/lin plot below) and occurred as a 0.5 mm event on 10 November. Current fault slip rates are now sufficiently low to discern the effects of diurnal thermoelastic signal but slip remains (may2007) more than twice the pre-event speed. On 12 Oct and 4 Nov the transducer was offset mechanically to accomodate future slip. These offsets have been removed from the plots and downloadable data.
In the plot below of log(elapsed time) in seconds from the start of the event, it is apparent that 4 or more creep events occurred in the first hour of the slip episode (dots indicate measured points; dashed line indicates possible slip) followed by 7-8 events of various sizes until mid Dec 06. It is also clear that the sequence ended with a very small creep event on 11 Dec 06. For the three months after this last event the creep rate (3.2 mm/yr) has remained more than double the creep rates of previous years (1.35 mm/yr), but the rate 2008-2009 is now below 2006 rates (0.95 mm/yr)
Photos of surface cracks (8 October '06) courtesy David Sandwell, Yuri Fialko and Danny Brothers. The first is a view west showing a then 22 mm dextral crack intersecting the (buried) creep-meter rod, that here passes parallel to the left side of the photo. The second is a view to SE and shows fresh cracks in Imler road that was resurfaced a few months before the event. Click on the figures to see enlarged views.


The following figure compares Superstition Hills creep data with creep signals gathered in central and southern California in the past two years. Note the occurrence of creep events simultaneously at Ferrum and Salt Creek on the San Andreas Fault in early 2006, followed by a small creep event on the Superstition Hills fault and at Durmid Hill. Rainfall results in a left-lateral signal at Parkfield and Nyland in both years, and at Ferrum, Nyland Ranch & Durmid Hill in 2004. In contrast, the lower monthly rainfall in 2005 in southern California occurs at time when dextral creep events occur. Note the 1/10 scale on the right hand axis for these southern California creep-meters. Noise in the data is less than 20 µm at daily periods before and during the creep events suggesting that though catalyzed by precipitation, slip events may occur during a times of reduced friction on the fault surfaces caused by increased pore pressure in the shallow fault zone. The October 2006 event occurred when no rain had occurred locally for several months. There is no agricultural irrigation within many km of the fault.

This last figure summarizes creep on the southern San Andreas fault and Superstition Hills fault to January 2009. The three Durmid Hill creepmeters recorded a 3 mm amplitude creep sequence that started in the north and propagated south at approximately 3 km/hr.
References
Bilham, R., Surface slip subsequent to the 24 November 1987 Superstition Hills, earthquake, California, monitored by digital creepmeters, Bull. Seism. Soc. Amer., 79(2), 425-450, 1989.
Bilham, R., and J. Behr, A two-depth model for aseismic slip on the Superstition Hills fault, California, Bull. Seism. Soc. Amer., 82, 1223-1235, 1992.
Bilham, R, N. Suszek and S. Pinkney, California Creepmeters, Seism. Res. Lett. 75(4), 481-492. August 2004.