

Quantifying Glaciers
Over the past century, the glaciers of the central Himalaya have seen a net reduction in ice volume not so much from terminus retreat as from surface (vertical) deflation. For some central Himalayan glaciers, it has been possible to make estimates of the time to their demise from measurements of residual ice volume and recent ice melt rate. In other cases, these parameters are too uncertain to make meaningful predictions. Surface deflation of 100 m is evident between photographs taken of Himalayan glaciers in 1921 and more recently. The net reduction of ice since 1921 from Everest's four primary glaciers is 3.66-3.78 cu. km.
In a healthy glacier, volume is maintained by a balance between winter accumulation and downhill flow about an equilibrium line, below which ablation occurs and more ice is lost in the summer than gained in the winter. The ablation zone of most of Everest's glaciers now extends throughout the entire valley glacier system. The systems are clearly in a state of disequilibrium.
Flow rates, retreat rates and volume loss
The glaciers surrounding Everest currently flow at rates from more than 40 m/yr to less than 5 m/yr. Some are stagnant and no longer mobile. The longest glaciers contain 400 years old ice near their termini. Many of the termini are now retreating and numerous lakes have formed on their surfaces. The retreat of the terminus of a glacier indicates that its downhill flow rate is less than its melt rate.
The figure below shows the cumulative 1.1 cu km volume loss of the Rongbuk glacier between 1921 and 1991, spot verified using laser ranging calibration of historical photos. Its deflation occurs mostly in the accumulation zone (above 5700 m) and in the mid valley glacier (5300-5500 m). The inferred translation of the glacier during this time interval is approximately 1.5 km, 10 per cent of its length.
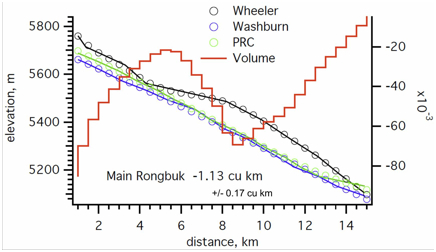
The red line indicates mass loss for the Rongbuk glacier (scale right in cubic km). Click on map for pdf.