Co-seismic strain and the Transition to Surface Afterslip recorded
by Creep-meters near the 2004 Parkfield epicenter.
Roger Bilham, CIRES and Department of Geological Sciences, Boulder
CO 80309-0399
The Mw=6 Parkfield earthquake at 11:15 local time, 28 September
2004 has dealt a possibly fatal blow to the notion that significant surface
slip precedes earthquakes. In 1966, anecdotal reports of surface fissures along
the fault zone had been reported in the preceding week, and a water pipe
fractured 11.6 hours before the mainshock. This offered hope that substantial surface slip may have
occurred had displacement sensors been in place to measure it. In the days,
hours and minutes prior to the 2004 Parkfield mainshock, displacement sensors
were in place, and nothing happened. According to data from eight creep-meters
crossing the fault, the fault remained effectively locked at the detection
level of each sensor (6-20µm) (Langbein et al. 2004, this volume). This absence of surface slip was
accompanied by an absence of significant strain on the borehole dilatometer and
shear-strain-meter array in the region, and by the absence of any unusual
displacements on the GPS array embracing the 2004 epicenter. Although
pre-seismic strain signals seen on some borehole strain-meters suggest that
epicentral strain was not completely indifferent to the pending earthquake, the
signals are close to instrumental noise levels, and pose new challenges for
their reliable future detection.
In contrast to the absence of pre-seismic fault displacement,
the creep-meters all recorded an abrupt co-seismic dextral offset at the time
of the mainshock. The step corresponds to dextral shear of the fault zone, but
in the absence of surface rupture, the creep-meters during early afterslip acted
as extensometers, measuring strain rather than fault creep. The serendipitous location of
creep-meters at Work Ranch both across and eccentric to the fault zone has
provided insight into the development of surface faulting.
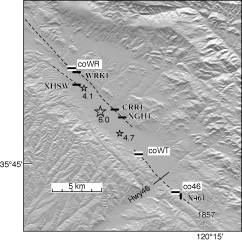
Fig 1. Southern half of the 2004 Parkfield rupture (epicenter=star)
showing the approximate location of surface slip in 1966, and named
creep-meters discussed in the text, (Azimuths of creep-meters indicated by
black bars.) In 2004, surface slip
again occurred near coWR, but as of 28 October 04, not between coWT and
co46. USGS creep-meters are
indicated by solid black bars.
Creep-meters and data processing
The USGS have maintained a creep-meter array in Parkfield since
the 1966 earthquake, increasing the number of sensors over the years to
thirteen (Schultz, 1989; Schultz et al.,1990; Yamashita and Burford,1973). Data
from these instruments indicate that interseismic creep reduces in rate from
more than 20 mm/year north of Middle Mountain to zero South of Highway 46
(Langbein et al, 1990). Ten
of these now record afterslip with a displacement resolution of approximately
20 µm. The three University of Colorado (UC) extensometers discussed in this
article were installed to capture coseismic slip and afterslip at Parkfield,
but were abandoned a decade ago due to funding difficulties. With the
resumption of USGS funding this year, one was re-activated in April, and two
others shortly after the Parkfield earthquake. They measure linear
displacements 30-60 cm below the surface between attachment piers on the flanks
of the fault Each attachment pier consists of steel-rods driven to refusal in
the form of a buried tripod with a maximum depth of 2 m. The length standards of these original
extensometers are solid 1-cm-diameter invar rods that slide within buried
telescopic PVC pipes, although new instruments use 6-mm diameter graphite
rods. The rods are fastened
rigidly to a buried pier at one end.
The rod crosses the fault obliquely at ≈30° and motions of its free end
relative to the opposing pier are measured with a
linear-variable-differential-transformer (LVDT). All three Parkfield systems
were equipped with 1" range Schaevitz DCSE 1000 transducers and 12-bit
Onset Microstation data loggers that can operate autonomously from AA alkaline
batteries for a year (Bilham et al. 2004). The locations, and specifications of
the extensometers are shown in Figure 1 and Table 2.
Table 1
Specifications of creep-meters discussed in the text.
|
site |
lat°N |
long°W |
length |
obliquity |
azimuth |
start |
|
coWR |
35.8587 |
120.3924 |
14 m |
30° |
N76E |
15-Apr-04 |
|
coWRW |
35.8587 |
120.3924 |
2.5 m |
30° |
N76E |
10-Oct-04 |
|
coWRW |
35.8587 |
120.3924 |
10 m |
30° |
N76E |
28-Oct-04 |
|
WKR1 |
35.8587 |
120.3924 |
21m |
40-45° |
N85E |
1978 |
|
coWT |
35.7580 |
120.3003 |
6 m |
30° |
N76E |
2-Oct-04 |
|
coWTW |
35.7580 |
120.3003 |
5 m |
30° |
N76E |
2-Oct-o4 |
|
co46 |
35.7249 |
120.2818 |
14 m |
30° |
N84E |
28-Sep-04 |
|
coNR |
36.8350 |
121.5463 |
8 m |
40° |
N80E |
Mar-04 |
The east component of coWR operated throughout the
earthquake. Following the
development of surface fissures its length was increased westward by 2 m 10-28
October, and to 10 m subsequently. The obliquity of Work Ranch was measured at
40° but is recorded in USGS archives as 45°, possibly assuming a different
local strike for the fault.
Data were downloaded in the field as text files of voltage and
temperature, with a timing accuracy of ±3 s. The voltages, which include a non-linear extension of the
LVDT range from 25.4 to 39 mm, were first linearized to displacements using 6th
order polynomials from laboratory calibration data. Dextral slip is obtained by
dividing the displacement data by the cosine of the fault-crossing obliquity
assuming no distortion of the rod where it crosses the fault zone. The
resulting precision and accuracy in the data is 10 µm. Few spurious data exist
in the raw time series, but mechanical adjustments to transducer positions have
been removed. No temperature corrections have been made to the data. The
diurnal peak-to-peak amplitude in each creep record is less than 80 µm. The
processed and raw data are available as numerical listings at the following
URL: http://cires.colorado.edu/~bilham/WorkRanchSite.htm
Strain and displacement measured at coWR, Work Ranch
Creep-meter coWR supplements data from a USGS/Caltech telemetered
system (WKR1) installed in 1976, which has operated continuously since
installation with a sample rate of 10 minutes. Although WKR1 malfunctioned a
few days before the earthquake, it was repaired a few days later. The Colorado creep-meter (coWR) was
activated in April 2004 to test two new sensors described in Bilham et al.
(2004): one with a high-resolution (6 µm) and 39 mm range, and another with low resolution (1.5
mm) and 3 m range. Both the UC
sensors recorded surface strain at the time of the Parkfield mainshock, and its
subsequent development (Figure 3). The recording rate on the high-resolution
creep-meter was unfortunately reduced from 60s to 300s sampling two days before
the earthquake, although this 5 minute sample rate remains double the rate of
other creep-meters in Parkfield. Following the earthquake its sample rate was
increased to 30 s, a rate that recorded triggered displacements at the time of
the larger aftershocks. The low-resolution creep-meter operated throughout the
earthquake with a 600 s sampling interval.
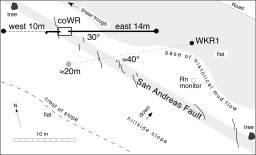
Figure 2. Locations of Work Ranch
extensometers relative to 5 mm to 2 cm wide cracks mapped 21 Oct 2004. The cracks were not evident on 2
October. The 2.5 m west extension
was constructed 10 October and recorded by an independent data logger, after
the fault announced its location. On 28 October it was increased to 10 m
bringing the total length to 24 m.
No cracks were evident in the ground when the Work Ranch
creep-meters were visited 5 hours after the earthquake and again 4 days later,
but irregular cracks at 3-5 m intervals developed subsequently within a
40-m-long, 3-m-wide, swath near the creep-meters (Figure 3). The N58°W mean strike of the fault
followed by these en-echelon cracks revealed that the coWR extensometer embraced
(embarrassingly) only half the fault zone. A clear fault zone at this location
is not apparent because it is obscured by what is interpreted to be a small
scale historic mudflow. By 10 Oct an 18-mm-wide, 3-m-long N5W-trending
irregular crack had developed parallel to the western edge of the fiber-glass
vault marking the western extremity of the 14-m-long instrument. This crack tapered to a hairline 50 cm
to the south of the vault, and 1.5 m to its north (Figure 2).
Fault zone fissures were clear in the 40 m zone mapped in Figure 2, but
fissures in the contiguous 100 m to the SE and NW were sparse, an observation
supported by geological mapping of the region reported by Langbein et al.
(2004). The maximum width of
opening of the en-echelon fissures was noted to be approximately proportional
their separation and to their length.
The easternmost and longest fissure had the widest opening and the
furthest distance from the next fissure.
On 10 October the coWR creep-meter was extended 2.5 m westwards
using a 30-cm-deep graphite rod,
and an existing vertical steel pipe as an anchor. On 28 October this temporary arrangement was replaced with a
10-m-long, 60-cm-deep graphite rod, attached to a 2-m-deep buried
steel/concrete pier west of the inspection vault. A 10-cm-range sensor
now records afterslip embraced by the combined 24-m-long graphite/invar
rod system.
That the original UC extensometer incompletely crossed the fault
was suspected before surface fractures were manifest. By 2 October, 10.2 mm of afterslip had been recorded by
coWR, compared to 23.6 mm on WKR1 (Langbein, personal communication, 2004). The
initial efficiency of creep-meter coWR (43%) had reduced to 30% by 10 October
(14.8 mm vs. 48.5 mm) with an
average afterslip velocity half that of the USGS creep-meter. Even with the addition of the westward
extension, the measured dextral slip signal 10-21 October remained 40% smaller
than the WKR1 creep-meter (Figure 3B), requiring the creep-meter to be extended
to 10 m.
An attempt has been made to infer the relative slip recorded by the
west and east-facing creep-meters (Figure 3B). Three assumptions are required. The first is that the WKR1 dextral displacement signal
represents the cumulative dextral shear at this point, as inferred from
post-seismic mechanical adjustments (by John Langbein) needed to bring the
instrument on-line. The second is
that the shear strain above a subsurface dislocation is approximately linear on
the surface. This assumption is
invalid as the subsurface dislocation approaches the surface and the strain-field
narrows to dimensions comparable to the lengths of the extensometers. It is
approximately correct for the early part of the record. An additional
assumption is that creep-meter WKR1 remains straight and 45° to the fault, an
assumption that may be incorrect if a sigmoidal kink in the fault zone (Bilham,
1989) has reduced the obliquity of the WKR1 where it passes through the shear
zone. Twenty-two cm of creep has occurred at Work Ranch in the past 28 years.
The manipulation of these data in this way (explained in the caption to Figure
3B) subject to these various assumptions yields an inexact measure of the
missing slip. However, the
reduction in estimated partitioning, from 40% to less than 30%, is consistent
with the absence of surface cracks in the early part of the record, and with
the location of the measurement vault approximately two thirds of the way
across the surface shear zone, after these cracks were manifest (Figure 2).
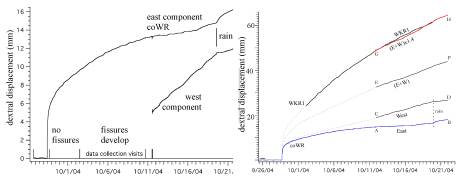 Fig 3A
(left) Extensometer data from coWR, east and west. The east component is shown
as dextral displacement and strain. The west component has an arbitrary offset
and starts 11 October.
Figure 3B (right) Comparison with Caltech/USGS creep-meter WKR1 data (from John Langbein). The absolute
amount of slip that occurred on the east creep-meter is known but that for the
west creep-meter is not, although it can be estimated approximately from
observed velocities (line slopes). The period of overlap AB (east) is added to
CD (west) to obtain the total fault zone shear velocity, EF, for the
16.5-m-long combined extensometer. The slope of GH measured by WRK1 remains 1.4
times greater than the slope of EF, hence the estimated displacement of point F
must be H/1.4. This then
determines the absolute displacement of point D. Dashed lines indicate inferred
displacements.
Fig 3A
(left) Extensometer data from coWR, east and west. The east component is shown
as dextral displacement and strain. The west component has an arbitrary offset
and starts 11 October.
Figure 3B (right) Comparison with Caltech/USGS creep-meter WKR1 data (from John Langbein). The absolute
amount of slip that occurred on the east creep-meter is known but that for the
west creep-meter is not, although it can be estimated approximately from
observed velocities (line slopes). The period of overlap AB (east) is added to
CD (west) to obtain the total fault zone shear velocity, EF, for the
16.5-m-long combined extensometer. The slope of GH measured by WRK1 remains 1.4
times greater than the slope of EF, hence the estimated displacement of point F
must be H/1.4. This then
determines the absolute displacement of point D. Dashed lines indicate inferred
displacements.
Rain occurred in the last few days of the record (Figure 3)
causing a reduction in the rate of opening of the cracks west of the
creep-meter and a corresponding increase in the apparent rate of creep in the
east-going creep-meter. The sum of
the two signals is almost unperturbed by these changes, so that rain appears to
have caused a displacement of the vault position, presumably due to water
entering the surface crack at its western edge. Excavations showed that the soil moistening elsewhere was
confined to the uppermost 10 cm of the soil layer. Below this depth the soil remained dusty.
Creep south-east of the mainshock, coWT & co46
Two creep-meters were activated after the earthquake southeast of
the mainshock. They operate on the
SE branch of the San Andreas fault that slipped in 1966 but where no 2004
fissures had yet appeared by 28 October 2004. The most southerly of these creep-meters is 100 m north of
the USGS creep-meter X461, approximately 1.2 km SE of Highway 46, near an
offset drainage whose probable 1857 offset is discussed by Lienkaemper
(2001). The northerly one is a
restored creep-meter site ("Water Tank"), abandoned due to frequent
flooding, approximately 2 km NE of
Highway 46 in a featureless location in the floor of the Cholame valley. In the first month of afterslip both
creep-meters recorded creep events with 1-3 mm amplitude and 3-8 day duration.
The afterslip decay rate causes the intervals between creep events to increase
with time. Despite the differences
in creep-event amplitude and duration, the afterslip rate at each of these
locations is similar, at approximately 0.3 mm/day.
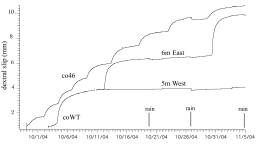 Figure 4
Extensometer data from two locations on the San Andreas Fault segment SE of the
epicenter. Both extensometers were
activated after the earthquake and hence absolute coseismic displacements are
not known. A 23.47 mm extension of
coWT may have occurred coseismically,
as recorded by clean, rust-free surface on an otherwise rusty sensor
clamped a decade ago. The west
coWT extensometer is co-linear and contiguous with creep-meter coWT and records
no change in strain at the time of creep events on the fault.
Figure 4
Extensometer data from two locations on the San Andreas Fault segment SE of the
epicenter. Both extensometers were
activated after the earthquake and hence absolute coseismic displacements are
not known. A 23.47 mm extension of
coWT may have occurred coseismically,
as recorded by clean, rust-free surface on an otherwise rusty sensor
clamped a decade ago. The west
coWT extensometer is co-linear and contiguous with creep-meter coWT and records
no change in strain at the time of creep events on the fault.
Since no nearby geodesy is available to constrain the absolute
amplitude of post-seismic slip at these locations, the displacement datum in
Figure 4 is arbitrary.
Extrapolating the data back to the time of the mainshock suggests that
recording at each site may have started at the end of an earlier creep event of
similar magnitude and duration to the ones that followed. If this indeed occurred the cumulative
afterslip to 21 October is 9-10 mm at each location. However, a coseismic step in the signal may have occurred at
each site, either due to static-strain or to inertial shaking effects. During
installation of coWT its transducer (abandoned in 1993) was found to retain
signs that it had been pulled apart from its attachment to its invar rod
relatively recently. The fresh
rust-free surface had parted 23.47 mm from its retaining clamp, presumably
during the mainshock, but it is not certain how long this fresh surface could
have been exposed underground without rusting.
 The coWT creep-meter has two
rods, one extending east and the other west from a central recording
system. Between 2 Oct and 10 Oct a
single transducer recorded their combined signal, but after 10 October the west
component was recorded separately to learn something of the spatial
distribution of surface shear. In the ten days of data available for present
analysis we conclude that the western arm does not cross any part of the active
fault. The west component,
however, does respond to soil moisture changes (rain 18-19 Oct) in the opposite
sense to the fault-crossing east creep-meter.
The coWT creep-meter has two
rods, one extending east and the other west from a central recording
system. Between 2 Oct and 10 Oct a
single transducer recorded their combined signal, but after 10 October the west
component was recorded separately to learn something of the spatial
distribution of surface shear. In the ten days of data available for present
analysis we conclude that the western arm does not cross any part of the active
fault. The west component,
however, does respond to soil moisture changes (rain 18-19 Oct) in the opposite
sense to the fault-crossing east creep-meter.
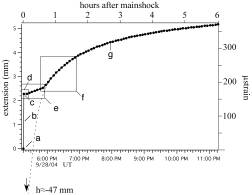
Figure 5 Five-minute samples from creep-meter coWR from before
the mainshock to six hours following the mainshock. The axes are
axial-displacement (not dextral fault slip), and linear strain at azimuth
N94°W. Labeled features identified on the record are (a) data point 3 minutes
before mainshock, (b) coseismic extension of 2.28 mm , (c) data point two
minutes after mainshock, (d) first two post-seismic data points may correspond
to instrument overshoot or backlash, (e) a linear ramp at 60 µm/s for ≈40
minutes followed by (f) a transitional acceleration to (g), an exponentially
decaying afterslip process. The
exponents in the first hour of this decay process change significantly
suggesting that although the transitional acceleration (f) appears to be only
15 minutes, it may have a duration of up to an hour. Data between 2-6 hours
following the mainshock fit an exponential decay curve to within 0.1 mm
permitting the curve to be extrapolated back to the time of the mainshock (h).
At the time of arrival of s-waves from the hypocenter the extrapolated
displacement applied to the creep-meter corresponds to –47 mm.
Coseismic fault strain above the Parkfield rupture
Creep-meters frequently record a process known as triggered slip
whereby a surface fault slips during the passage of strong seismic waves from a
remote earthquake (e.g. Schultz et al., 1990, Bodin et al., 1994). The data discussed here differ from
these observations in that they represent a coseismic step in the plane of the
mainshock-rupture, and close to the hypocenter. Slip on the surface fault has
developed unevenly in time and space in the days following the mainshock
(Langbein et al. 2004), and the Work Ranch site is near the southern end of the
region of maximum surface slip.
The following discussion concerns postseismic strain changes whose
details are thus probably specific to the Work Ranch site.
The five-minute sampled record from Work Ranch increments by
2.279±0.006 mm between the two samples that bracket the mainshock (Figure 5).
The absence of recognizable post-seismic surface rupture in the subsequent
several days is interpreted to signify that the early creep signal does not
measure dextral displacement, nor even fault zone shear. Instead it measures
strain, and, to a first approximation, the strain is equivalent to homogeneous
strain in an elastic half-space. The length of the creep-meter is 14.25±.25 m,
and assuming that large accelerations in the earthquake caused no shift in the
attachment piers (see discussion below), this corresponds to a strain change of
160±3.5 µstrain at azimuth N76W.
Thus, the initial step in the data represents surface-strain
imposed by the M=6.0 rupture at depth, and the subsequent signal represents the
increase in local strain arising from the approach of the shallow rupture
towards the surface, at a rate moderated by presumably velocity-strengthening
rheologies (Marone et al, 1993). Thus, before the development of recognizable
surface fractures four days after the earthquake, the creep-meter acted as a strain-meter (Figure 5). After their development the
extensometer continues to record strain since the fissures do not form a
continuous linear rupture on which displacements can be observed. The distinction is more than semantic
because in the absence of a surface offset there remains some doubt about the
width of the extensometer required to capture the entire subsurface slip
velocity.
Although surface strain had more than doubled (from 160 µstrain to
360 µstrain) 5 hours after the mainshock, no cracks or fissures were
evident. The mean spacing between en-echelon fissures that eventually
developed near the creep-meter (Figure 2) is 4-5 m suggesting that the maximum
crack that could have developed at the end of 5 hours would have been 1.8 mm.
The absence of coherent crack formation at this time suggests that the failure
strain of surface soils exceeds 300 µstrain, or that surface strain at this
time was accommodated in a broad area populated by randomly oriented
desiccation cracks.
Of interest to this study is that no abrupt deceleration in
measured displacement-rate is recorded by coWR that can be ascribed to the
sudden growth of surface cracks. The development of a vertical crack near a
horizontal strain-meter should reduce measured strain, if the crack is produced
by elastic failure. Strain will reduce to zero if the crack is long and deep,
but will be reduced significantly if the crack is comparable in dimensions to
the length of the strain-meter. No reduction is slip is observed in the coWR
data signifying that crack development was not associated with local strain
release, but was driven by additional strain focused in the region by the
afterslip process. Incipient cracks may have been present very early in the
afterslip process with a wall separation too small to be visible, but it is
more likely that the cracks propagated steadily to the surface through a fault
zone of low tensile strength.
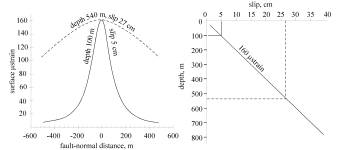 Fig.
6. Strain above a 2-D planar,
buried dislocation extending to 12 km depth. Two illustrative curves (of many) are shown that yield a
maximum strain of 160 µstrain at the surface fault. The dashed line indicates the deepest upper surface of a
uniform dislocation that slips 27 cm, the mean slip inferred for the Parkfield
2004 earthquake.
Fig.
6. Strain above a 2-D planar,
buried dislocation extending to 12 km depth. Two illustrative curves (of many) are shown that yield a
maximum strain of 160 µstrain at the surface fault. The dashed line indicates the deepest upper surface of a
uniform dislocation that slips 27 cm, the mean slip inferred for the Parkfield
2004 earthquake.
That no decrease in strain occurred in the east coWR record after
cracks were manifest requires that crack growth was driven by additional
strain. This additional strain can
be estimated to be of the order of 200-500 µstrain from the growth of strain
recorded by the nearby WKR1 creep-meter, and the western extension to coWR.
I next estimate the size of strain changes anticipated from an
upward propagating shear dislocation embedded in an uniform half-space. The strain at the surface above a
buried planar strike-slip dislocation is a maximum at the future fault rupture
(Figure 5). Using the 160 µstrain
strain-step observed at Work Ranch and the average slip on the fault during the
earthquake (27 cm) as constraints, the closest approach of the Parkfield
rupture to the surface can be calculated. Uniform, planar, 2-D slip between 12
km and the shallow subsurface is an unreasonable constraint, but it reveals
that the upper edge of such a dislocation would need approach within 540 m of
the surface. However, the same
surface-strain can be produced by smaller amounts of buried slip at shallower
depths. For example, 1 cm of
planar slip at 19 m will also produce 160 µstrain of surface strain. Slip presumably tapered towards the
surface and a more realistic model will eventually be possible using additional
strain and displacement constraints.
A second estimate of the shallowest depth of coseismic rupture
follows from the observation that no cracks were visible at the surface up to 4
days after the earthquake, during which time linear strain increased from 160
µstrain to more than 500 µstrain. The precise moment that cracks appeared is
not known, but because the strain increased slowly after the first day I assume
that incipient crack formation occurred when approximately 400 µstrain had been
recorded by coWR. The half-width of synthetic maximum strain is approximately
equal to half the depth to the top of the dislocation (Figure 6), hence the
maximum width of the zone of en-echelon cracks that eventually developed (4 m)
suggests that the dislocation may have approached closer than 2 m to the
surface. A slip of ≈5 mm will produce 400 µstrain of surface strain from such a
shallow dislocation, however, the half-width of the strain-field from such a
shallow dislocation, is much smaller than the length of the creep-meter, so
that slip estimated in this calculation is too small by a factor of 2-3, i.e.
an acceptable solution is for 8-14 mm of slip at approximately 5-10 m
depth. The 10-18 mm maximum crack
widths that had developed by 10 Oct at Work Ranch are approximately consistent
with these estimates for shallow slip amplitudes.
Alternative explanations for a coseismic step
The coseismic signal recorded by creep-meter coWR has been assumed
to correspond to separation between its attachment piers, resulting from
tensile soil strain, or dextral fault slip. However, a defect of most soil-embedded objects, unless they
are of identical modulus and density to surrounding soils, is that they tend to
shift relative to their surroundings during high accelerations. Could an
imperfection in the creep-meter have induced co-seismic rod contraction, or
mount-settlement?
Since the accelerations during the earthquake are estimated to be
0.2-0.45 g near Work Ranch (Lanbein et al., 2004), axial forces of up to 36 N
were induced briefly on the eastern attachment point by the 8 kg mass of the
invar rods. Forced displacement of
this mount, or transient buckling of the rod, could thus be responsible for the
observed coseismic signal. The diameter of the telescopic PVC tube is 4 cm, and
hence a 2.6 mm shortening in rod length due to buckling would require a saw-tooth
buckle with an amplitude 34 mm and quarter-wavelength of 2 m. This is considered unlikely because a
spring between the free-end of the rod and the nearby mount maintains the rod
in tension, and shaking would tend to straighten the rod rather than shorten
it. Static loading of the mount by 55 N, causes fewer than 12 µm of
displacement, but the effects of high-frequency prolonged 3-D dynamic shaking
on soils surrounding the low-density vaults are essentially unpredictable. Accelerations at coWT, where a
23.5 mm coseismic displacement may have occurred, were in the range 0.65-1.3 g,
causing nearby liquefaction in the valley floor (Langbein et al., 2004 )
Some of the creep-meters operating in Parkfield use wires in
tension, so that dynamic forces on the end-attachment points from these
length-standards are essentially negligible. Yet the sense of co-seismic strain
recorded by these creep-meters is also tensile (the direction of dextral slip),
including data from the somewhat noisy creep-meter x461, which is installed at
an azimuth where dextral slip results in approach of its two attachment
piers. Coseismic shaking
stimulates a "bow-string" mode and a pendulum mode in suspended
wires, both of which result in apparent shortening of the length-standard, i.e. ground extension. This would have
been transient and probably damped after a few minutes. Unpredictable
settlement of these creep-meter vaults and attachment piers during the dynamic
shaking of surrounding soils presumably means that the precise amplitudes of
these coseismic strain increments are also subject to uncertainty.
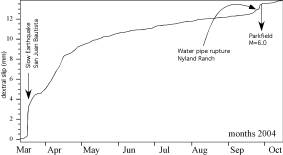 Figure 7
Creep data from Nyland Ranch, north of San Juan Bautista, showing the fracture
of a water pipe caused by a small creep event three days before the Parkfield
earthquake. Although the creep rate here has averaged 7 mm/year for the past
three decades, surface creep following a slow earthquake occurred in March 2004
that almost doubled the annual slip in just 6 months. The effects of the slow
earthquake were confined to the northernmost 10 km of the 125-kim-long creeping
zone.
Figure 7
Creep data from Nyland Ranch, north of San Juan Bautista, showing the fracture
of a water pipe caused by a small creep event three days before the Parkfield
earthquake. Although the creep rate here has averaged 7 mm/year for the past
three decades, surface creep following a slow earthquake occurred in March 2004
that almost doubled the annual slip in just 6 months. The effects of the slow
earthquake were confined to the northernmost 10 km of the 125-kim-long creeping
zone.
Rupture of water pipes before Parkfield earthquakes
Despite its intriguing predictive possibilities, the observation
of a ruptured water pipe prior to the 1966 mainshock was considered by most
scientists to be a random occurrence, the result of slow stressing following
decades of cumulative creep on the surface fault.
However, a pipe did indeed shatter 3 days before the 2004
Parkfield earthquake (Figure 7).
The coincidence occurred on 26 Sept 2004 some 125 km north of Parkfield
where a pipe crosses the northern end of the creeping zone near San Juan
Bautista. Obviously, there is no link between this pipe-break, and the recent
earthquake, and fortunately we possess a quantitative creep record from a
creep-meter fewer than 2 m from the water pipe that records its recent approach
to failure. (Figure 6). Creep on the fault here has proceeded at a rate of 7
mm/year for many decades (Sylvester,2004), interrupted by retardations and
accelerations linked to slow earthquakes in the subsurface (Linde et al.,
1992). A slow earthquake near
Nyland Ranch in March 2004 was followed by 13 mm of surface fault-slip. The
pipe finally failed during a 1 mm creep event on 25 September at Nyland ranch.
Conclusions
No surface fault slip, or significant strain preceded the
September 2004 Parkfield earthquake. The rupture of a pipe before the 1966
Parkfield earthquake can now be classified, somewhat confidently, as a
coincidence resulting from
prolonged stressing in the fault zone in the decades prior to 1966. Coincidently, a similar pipe failure
occurred at Nyland Ranch, at the northern end of the central California
creeping zone, three days before the 2004 Parkfield earthquake. In the absence
of measurements, this might have become another Parkfield legend, but in this
case a nearby creep-meter records the decadal development of creep at Nyland
Ranch at a rate of 7-8 mm/year. A
slow earthquake added an additional 13 mm of slip between March and September
2004. The final millimeter that broke the pipe consisted of a small creep event
that was recorded at about the same time on the XSJ2 creep-meter at San Juan
Bautista.
A coseismic signal present on the creep-meters at the time of the
2004 earthquake, although possibly contaminated by instrument settlement, is
interpreted as tensile strain associated with subsurface rupture. Simple
elastic models suggest that, at Work Ranch, the subsurface rupture must have
approached at least to within 540 m of the surface during mainshock
rupture. This conclusion is
derived from elastic models of surface strain resulting from 27 cm of uniform
slip on a simple planar fault.
Closer approach to the surface with smaller amounts of slip is also
possible. A weak constraint on the
minimum depth and slip permitted by the data is approximately 5-10 m and 8-14
mm respectively. Closer approach
is likely to have produced surface fractures that were not observed until
several days later.
I conclude that surface fissures appeared after measured strain
exceeded 400 µstrain. Because no relaxation in the monotonic increase in strain
was recorded by the eccentric creep-meter at coWR, at the time of their
development, I conclude that cracks and fissures did not release stored elastic
strain when they formed near the surface. Instead their growth appears to have
been driven by additional strain presumably propagating towards the surface
from below. The width of the shear zone of en-echelon surface fissures at Work
Ranch (≈3m) is narrower than the fault-normal width of the newly extended
24-m-long creep-meter coWR (12 m) so that the creep-meter now monitors subsurface creep with acceptable fidelity.
Although a single data point does not allow a unique solution to
the depth of rupture propagation, and the amount and distribution of slip, an
important conclusion suggested by the current study is that an array of simple,
low-inertia extensometers with 1-1000 µstrain recording range, embedded near a
future rupture zone would provide powerful constraints on the geometry of
shallow rupture, and its propagation towards the surface.
Acknowledgements
The creep-meters were funded by NEHRP grant USGS 04 HQAG0008, and
the investigation was undertaken as a Visiting Miller Professor at the
University of California at Berkeley. I thank the Miller Institute for their
generous support during the study.
Roland Bürgmann has been involved in many aspects of the creep-meters
and their interpretation, and has offered several improvements to the article.
John Langbein has kindly provided processed data from the WRK1 creep-meter, and
has provided many thoughtful insights into observations of the creep
process. I thank Andy Snyder for
his help in coordinating field work.
References
Bilham, R.,
Surface slip subsequent to the 24 November 1987 Superstition Hills, earthquake,
California, monitored by digital creep-meters, Bull. Seism. Soc. Amer., 79(2),
425-450, 1989.
Bilham, R, N.
Suszek and S. Pinkney, California Creep-meters, Seism. Res. Lett. 75(4),
481-492. August 2004
Bodin. P., R.
Bilham, J. Behr, J. Gomberg, and K Hudnut, Slip Triggered on Southern
California Faults by the Landers, Earthquake Sequence. Bull. Seism. Soc. Amer.
84(3), 806-816, 1994.
Langbein , J.
O., R.O Burford, and L. E. Slater, Variations in fault slip and strain
accumulation at Parkfield,
Califonia: Initial results using two color geodimeter measurements, 1984-1988, J.
Geophys. Res,
95, 2533-2552, 1990.
Langbein et
al., 2005 Seism. Res. Lett., this volume.
Lienkaemper,
J. L., (2001), 1857 Slip on the San Andreas Fault Southeast of Cholame,
California, Bull. Seism. Soc. Amer., 91(6) 1659-1572.
Linde, A. T.,
M. T. Gladwin, M. J. S. Johnston, R. L. Gwyther, and R. Bilham, 1996. A Slow
Earthquake near San Juan Bautista, California, in December, 1992, Nature., 383,
65-68.
Marone, C.J.,
C.H. Scholz and R. Bilham, On the Mechanics of earthquake afterslip, J.
Geophys. Res., 96, 8441-8452, 1991.
Schultz, S. S.
Catalog of creep-meter measurements in California from 1966 through 1988. U.S.G.S. Open File Report 89-650.
Schultz, S.,
Mavko, G., and Brown, B., 1990, Response of creep-meters on the San Andreas
fault to the earthquake, in: The
Coalinga, California, Earthquake of May 2, 1983, Rymer, M.J. and Ellsworth,
W.L., eds., U.S. Geological Survey Professional Paper, P1487, 409-417.
Smith, S. W.
and M. Wyss, Displacement on the San Andreas fault subsequent to the 1966
Parkfield earthquake, Bull Seism. Soc. Am. 58, 1955-1973, 1968.
Sylvester, A,
(2004). http://www.geol.ucsb.edu/projects/geodesy/nail_lines/
X0070_NYLAND_RANCH_NL.html
Yamashita, P.
A. and R. O Burford (1973), Catalog of preliminary results from an 18 station
creep-meter network along the San Andreas Fault system in central California
for the time interval June 1969 to June 1973, U. S. Geol Survey Open File
Report.