Tilt data Pozzuoli
Data from a few days of data in August 2009 from the two tunnels transmitted via the Iridium satelite are shown here. Incoming data with a latency of 15 minutes to 2 hours may be viewed at
www.datagarrison.com, user <geo> password <hobo>
Calibrated 12-bit data in mm may be downloaded as numerical text listings of 30 minute averages with time in GMT. 16-bit data sampled once per minute are recorded by local data loggers for more detailed analysis.
North Tunnel
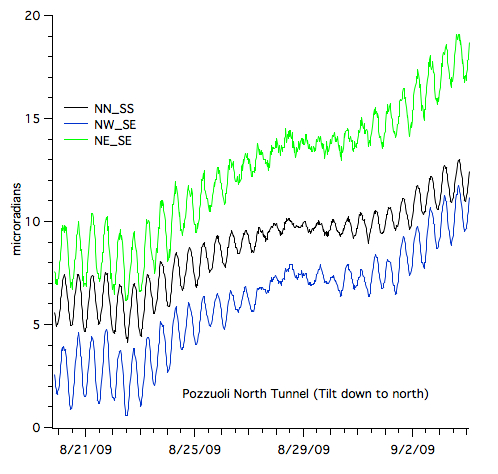
The six sensors in the north tunnel provide two measures of N/S tilt, each 120 m long, and three combinations in other azimuths with lengths of roughly 100 m. The data below are shown as water level differences in mm.

The figure below shows two weeks of data for three axes of tilt from six combinations of sensors. The upward trend indicates inflation of the offshore magma chamber, or coastal unloading caused by lowering of sea level.
South Tunnel
Six sensors here are linked to three independent water pipes. Two 70-m-long tiltmeters are parallel to each other and in a NW/SE direction. A third 15 m long tiltmeter measures NE/SW tilt. The following is an example of transmitted 12 bit data 30 minute averaged samples from the Iridium satellite link. Water level differences in mm.
