Difference between revisions of "High Resolution ToF-AMS Analysis Guide"
(→Choose Ions) |
|||
| (6 intermediate revisions by 3 users not shown) | |||
| Line 15: | Line 15: | ||
== HR-ToF-AMS Process Flowchart == | == HR-ToF-AMS Process Flowchart == | ||
| − | <center>[[File: | + | <center>[[File:HRFlowChart.jpg]]</center> |
| − | |||
== General Comments == | == General Comments == | ||
| Line 58: | Line 57: | ||
Additional Notes: | Additional Notes: | ||
If the yellow line is at the location of the middle of the red Gaussian fit, then it is a good fit. It is important to note that the black line does not need to be overlapping the yellow line in order for a good fit. If the black line is far on either side of the fit, this means the Daq did not have a good m/z parameter values to begin with. If you don’t see the yellow line at all, then something is wrong. Check the fit parameters. | If the yellow line is at the location of the middle of the red Gaussian fit, then it is a good fit. It is important to note that the black line does not need to be overlapping the yellow line in order for a good fit. If the black line is far on either side of the fit, this means the Daq did not have a good m/z parameter values to begin with. If you don’t see the yellow line at all, then something is wrong. Check the fit parameters. | ||
| + | |||
| + | The 'power' value that you read in Step 2 (Fit Values) should be very close to 0.5000 | ||
| Line 65: | Line 66: | ||
New feature on step #1 is to copy the table and settings of peaks for a given m/z calibration. You can save or load these setting waves to your m/z ion table in step #1. | New feature on step #1 is to copy the table and settings of peaks for a given m/z calibration. You can save or load these setting waves to your m/z ion table in step #1. | ||
For each tuning, all steps of squirrel and pika should be done as a separate group. | For each tuning, all steps of squirrel and pika should be done as a separate group. | ||
| + | |||
| + | If your closed spectrum has a lot of peaks at a single m/z, the fitting program may have trouble finding and fitting a single peak, and will look for the highest peak. If you are having m/z calibration problems, try taking out masses with multiple peaks from the m/z calibration. | ||
== Squirrel Baseline == | == Squirrel Baseline == | ||
| Line 137: | Line 140: | ||
== Choose Ions == | == Choose Ions == | ||
| + | |||
| + | [[File:PikaStep3.gif]] | ||
* Better to start simple, with fewer ions, and add ions as needed. Having too many ions in the fit can make the fit look good and have low residual for the wrong reasons. In version 1.05 the set of masses that were fit by default was significantly changed - about 70 HR fragments were changed from the default fitting status. | * Better to start simple, with fewer ions, and add ions as needed. Having too many ions in the fit can make the fit look good and have low residual for the wrong reasons. In version 1.05 the set of masses that were fit by default was significantly changed - about 70 HR fragments were changed from the default fitting status. | ||
| Line 152: | Line 157: | ||
Getting ready to fit ions in PIKA | Getting ready to fit ions in PIKA | ||
| + | |||
| + | [[File:ChooseIons.gif]] | ||
* PIKA step 3 “Choose HR masses to fit” | * PIKA step 3 “Choose HR masses to fit” | ||
| Line 160: | Line 167: | ||
** Constrain isotopic ratios | ** Constrain isotopic ratios | ||
| − | *** Click “Choose isotopes to | + | *** Click “Choose isotopes to constrain, check for isotopic parents” button |
| − | *** | + | **** The code will then do some checking to ensure that if a an isotopic HR fragment is selected to be fit and the user has chosen to constrain the isotope, then the isotopic parent is also fit. It also does some checking to see in which (temporal) order the integer mass groups of HR fragments needs to be fit in order that all parent fragments are fit before the constrained 'child' fragments. |
| + | *** Opting to constrain isotopic HR fragments is a must for ambient datasets. | ||
*** Isotopes can be unconstrained for chamber experiments with isotopes (e.g., 13C) | *** Isotopes can be unconstrained for chamber experiments with isotopes (e.g., 13C) | ||
| − | + | *** Users can opt to not constrain any isotopes via the Step 4 ii checkbox. | |
| + | |||
| + | == Group Ions into Families == | ||
| + | |||
| + | * The concept of HR families was created from a 'book-keeping' point of view. It is not the same as 'species' like Organics or Nitrate. | ||
| + | * Each HR fragment will be a member of one and only family. | ||
| + | * Users can define families for their own purposes. | ||
| + | * To define your own family, follow the example of the tungsten family, separating HR fragments by ; and assigning a red, green, blue color value for this family. | ||
| + | * When the user presses the "Choose masses to fit" button in the Select Masses to Fit Panel, the pika code assigns a family to each fragment, based on the chemical formula. | ||
| + | * The "HR chosen masses table" button will show the list of HR fragments selected to be fit and the family it was assigned to. For those wanting to dig into the code, the function UM_GenerateAxByMaskWaves does the family assignments. | ||
| + | |||
| + | |||
| + | == PIKA Fits == | ||
| + | |||
* PIKA step 4 “Calculate HR sticks for one spectra” | * PIKA step 4 “Calculate HR sticks for one spectra” | ||
** Calculate HR sticks for a short (# runs) todo wave to increase S/N | ** Calculate HR sticks for a short (# runs) todo wave to increase S/N | ||
| Line 170: | Line 191: | ||
*** If residuals are not +/- 5% for isolated peaks, reexamine either m/z calibration, peak width, or peak shape. Determining the ions to fit will be VERY difficult if residuals aren't reasonable for isolated peaks. | *** If residuals are not +/- 5% for isolated peaks, reexamine either m/z calibration, peak width, or peak shape. Determining the ions to fit will be VERY difficult if residuals aren't reasonable for isolated peaks. | ||
| − | + | * Evaluate the fits for peak width | |
| + | ** Look at very large, mostly isolated ions like O2 and Ar. | ||
| + | |||
| + | * Evaluate the fits for peak shape | ||
| + | ** Look at the left side of m/z 48 and 64, which should not have any real ion to their left | ||
| + | ** Look at the right side of m/z 41 (C3H5+)or other fragments with a high number of Hs, which should not have any ions to their right | ||
* Determine what masses to fit beyond those in the default list | * Determine what masses to fit beyond those in the default list | ||
| Line 192: | Line 218: | ||
*** If no change in residual, best to omit from fitting the ion (particularly important for data entered in PMF) | *** If no change in residual, best to omit from fitting the ion (particularly important for data entered in PMF) | ||
** Current recommendation is to be conservative | ** Current recommendation is to be conservative | ||
| − | |||
| − | |||
| − | |||
| − | |||
| − | |||
| − | |||
| − | |||
| − | |||
| − | |||
| − | |||
| − | |||
| − | |||
== HR Results == | == HR Results == | ||
| Line 228: | Line 242: | ||
== PIKA Species Loadings == | == PIKA Species Loadings == | ||
| − | For the time being, the | + | For the time being, the users have to do that by themselves. We hope to release the HR frag table by the 2009 AMS Users Meeting in Toronto which will allow the calculation of mass concentrations from the HR data. |
Latest revision as of 07:52, 31 October 2009
Introduction
The High Resolution ToF-AMS (HR-ToF-AMS) Analysis Guide is dedicated to the analysis of complex HR-ToF-AMS field data sets and is intended to establish standard practices in this area on a community-wide basis. It is assumed that users will have some familiarity with Igor and the community based ToF-AMS (Squirrel) analysis tool, Squirrel. Preliminary HR-ToF-AMS data can be generated while a project is underway without worrying about some details; this guide is intended for identifying all post-project analysis steps involved in generating final data. Several parts of this wiki originated at the HR-ToF AMS Clinic in Boulder, Colorado, June 2009
A Message for Contributors
We want to encourage active participation by all ToF-AMS users in the evolution of the information contained within this wiki and welcome the addition of content that is beneficial to the community as a whole. However, please DO NOT delete any content from this page!! Significant time, effort, and deliberation has gone into the information contained in this page. Rather than deleting content, please feel free to voice your concerns by posting a comment to the discussion page where others can contribute (please be sure to include a topic to be referenced in responses).
HR-ToF-AMS Process Flowchart

General Comments
It is often advantageous to do all five pika steps on one little piece (about 100 continuous runs) of your data and then do another little piece. After analyzing a few little pieces, issues may appear that may apply to your entire data set. Issues may appear at different steps in your analysis, and some steps are iterative.
m/z Calibration
Getting a good m/z calibration is essential for high resolution (Pika fitting) analysis, and is not nearly as important in unit mass resolution (UMR) analysis. The main point is to choose isolated peaks that are consistently present to calibrate raw data. Ions have to be isolated at the Full-Width_Half_Max (FWHM) level, but not necessarily at the tail level. The default set of ions are typically air-type peaks, and the closed spectra signal is used. In general, the more peaks one fits, the better the calibration. However, peak location (in m/z space) and peak quality may supersede the importance of the number of peaks.
There are two good diagnostics to decide which points are good for the m/z calibration.
Useful Diagnostics from the m/z calibration panel:
1. Blue graph in step 2: if a black circle is under the black line then that peak is noisy (e.g. doubly charged tungsten). If the black circle is over the line, then the width of the peak is too wide and has more than one fragment contributing to the peak. The square root of the intercept of this graph is the t_ion.
2. The baseline window is a good tool to see how different peaks compare to each other in terms of intensity and shape.
Changes to default HR m/z calibration list: -Remove O+ and N+ (both are high background and may have a different source) -Add CO2+ -Add SO, SO2 (m/z 48 and 64) -Add C6H5 (m/z 77) -m/z 91 (doubly charged tungsten)and 149 (pthalate) are encouraged, but can be noisy -m/z 43 (C3H7) Users can also look to the list of ions in the PeakWidthShape panel, Gauss Fits table, for other somewhat common ion fragments.
How many points should I fit?
The software complains if the number of m/z’s is less than 4, but you should have a minimum of 6.
Key for the bottoms graph of #2 that gives the 6 plots of m/z’s: Black Line: location of m/z peak using Daq values Yellow Line: location of m/z peak using Fit values Red Gaussian: fit found by Squirrel; Squirrel takes the Daq value for the m/z location, looks left and looks right for the peak. Once it finds this peak (the point with the highest intensity may not be exactly on the peak), it finds the number of points as defined by the delta value to the right and left of the peak. The red curve is the Gaussian fit to these delta*2+1 number of points.
Additional Notes:
If the yellow line is at the location of the middle of the red Gaussian fit, then it is a good fit. It is important to note that the black line does not need to be overlapping the yellow line in order for a good fit. If the black line is far on either side of the fit, this means the Daq did not have a good m/z parameter values to begin with. If you don’t see the yellow line at all, then something is wrong. Check the fit parameters.
The 'power' value that you read in Step 2 (Fit Values) should be very close to 0.5000
Other Notes:
The 'Set all parameters to NAN’ button: clears all fit parameters, and you are starting from scratch. Even if you are only fitting a portion of your dataset (ie Vmode only), when this button is pressed, all parameters will be cleared, so use this button carefully.
New feature on step #1 is to copy the table and settings of peaks for a given m/z calibration. You can save or load these setting waves to your m/z ion table in step #1. For each tuning, all steps of squirrel and pika should be done as a separate group.
If your closed spectrum has a lot of peaks at a single m/z, the fitting program may have trouble finding and fitting a single peak, and will look for the highest peak. If you are having m/z calibration problems, try taking out masses with multiple peaks from the m/z calibration.
Squirrel Baseline
In General
- Should several inspect several individual runs across a data set
- Check for runs at start, middle, and end of experiment (or before and after instrument changes such as filament or MCP changes, loss of vacuum, etc.)
- Goal is to get the “real” peak entirely within the stick regions
- Make sure red baseline runs underneath peaks
- Check several m/z at low (m/z 15), mid (m/z 50) and high (m/z 100, 200 and as high as you care), and see that the baseline regions are proper for all of these regions
Step-by-step
- Increase r0 until the majority the real (integer m/z) peaks are in the stick integration region (both ends of the mass spec). Its normal that there may be a few problem peaks that can be tweaked individually (e.g. 18, 28, 39).
- Check for any peaks where the baseline is incorrect. The 28 peak below will miss mass on the left hand side and over calculate mass on the right. (In this instance this is a very small frac of the total so could leave it).

- Can tweak with “alter stick and complement regions”

- Enter values manually on box and recalculate until baseline is tweaked. Once baseline looks good remember to check it for a few runs over the dataset.

- If noise is affecting baseline you can smooth with smoothed spline. Very computationally expensive. (Not great example data in picture).

Peak Width
The PW function is used to produce mathematical parameters which, once convolved with the user-determined peak shape (PS, see below), give a model of the expected measured signal as a function of mass for a given ion. The PS is simply a look-up table corresponding to the expected intensity of a peak as a function of the deviation in mass space from the centre, thus the m/z-dependence of the instrument model is contained with the PW function.
The mathematical functions that can be used in the PIKA model of this m/z dependence are:
- 1) Line fit, PW = a + b * m/z, and 2) Power fit, PW = a + b * (m/z)^c
Gaussian fits to isolated ions (ie those whose measured signal are not expected to contain interference from adjacent ions) are used to determine the FWHM as a function of m/z. Clearly, pre-requisites of an accurate determination of f(m/z) are an accurate mass calibration (defined here in a shamefully un-quantified manner) and selection of appropriate ions and runs for inclusion in the process.
- 1) Gaussian fits
- In Step 1, the PWPS panel finds gaussian fit parameters for a large range of ions for all the runs in a given todo wave. Only ions and runs fitted in this step can then be used to calculate PW. It is recommended that the user simply fit all the defaults for todo wave "all".
- 2) Choosing the todo for PW calculation
- It is required to go through the remaining steps 3->5 in the PW process for each subset of runs (ie, todo wave) for which you expect to measure a different peak width within the instrument, for example:
- V- or W-mode data, obviously
- Step-changes in TOF setup (new MCP, filament => totally different tuning?)
- For each of these subsets of your time-series, it is necessary in PW calculation to use a collection of runs which representatively reflects the magnitude and variation of PW across the entire subset. This might need to be the entire subset (e.g. "allV")... bear in mind that since the time-consuming step of generating the gaussian fits has already been completed, it is usually advantageous to include all the runs in PW calculation for each subset.
- It is required to go through the remaining steps 3->5 in the PW process for each subset of runs (ie, todo wave) for which you expect to measure a different peak width within the instrument, for example:
- 3) Choose ions to use
- This is achieved through altering the binary masks for V- and W-mode displayed in the upper-left table. An accurate PW calculation could be perturbed in the instance where results are included from:
- ions where signal from adjacent masses broadens the signal within the gaussian fit-range (defined by "delta"),
- ions with low signal-to-noise whose gaussian fit parameters may not be particularly well-constrained,
- ions where the fit routine has failed to find the correct peak owing to imperfect m/z calibration.
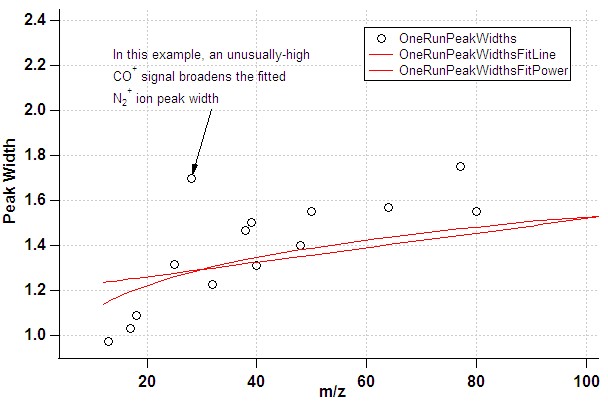
- The default list of ions for the gaussian fits attempts to exclude ions where one might expect interference. However, there are cases where the signal for individual ions may be artificially broadened, in particular in the case of poor instrument tuning (resolution). In the fit of PW vs. m/z this would manifest itself through points clearly deviating from the fit line. If a shoulder or double-peak is visible in the raw mass spectrum at this m/z, this is a clear indication that the ion should not be used in the PW determination.
- In the case of a poor m/z calibration, the fit routine may miss the intended ion altogether:
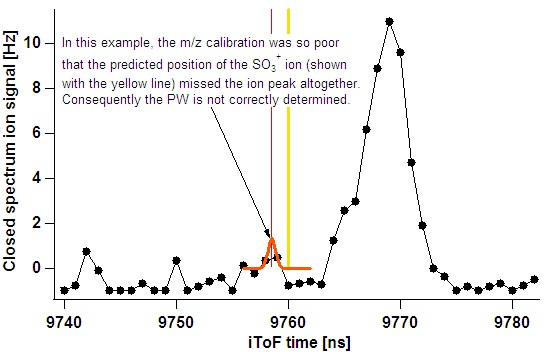
- The user should utilise the single run fits (taking note that the raw spectrum can be popped out) and also time-series results to ensure such problematic ions are not considered.
- This is achieved through altering the binary masks for V- and W-mode displayed in the upper-left table. An accurate PW calculation could be perturbed in the instance where results are included from:


- 4) Remove problematic runs from the time-series
- For each ion selected for use in the PW calculation, the user needs to consider the time-series of the gaussian fits and decide if there are runs for which there are legitimate reasons for removing those values from the PW average calculation. These might include runs for which:
- There is poor signal-to-noise over all ions owing to short save time in the DAQ (for example if saving on a fixed-time-grid of 1 minute and starting acquisition at 57s...),
- There is a huge organic mass loading where usually-negligible CxHy or CxHyOz peaks overwhelm the ions used in the gaussian fits,
- For each ion selected for use in the PW calculation, the user needs to consider the time-series of the gaussian fits and decide if there are runs for which there are legitimate reasons for removing those values from the PW average calculation. These might include runs for which:
- 5) Calculate the average.
- On hitting the orange "Declare these PW parameters for this todo" button, PIKA flattens the time-dependence of your PW function to 2 or 3 parameters (depending on linear/power fit) which are declared to be the "final" peak width parameters for the entire todo wave. In consequent PIKA fitting, this single set of PW parameters are used for the HR fits on every run in the todo wave. This process happens in two steps:
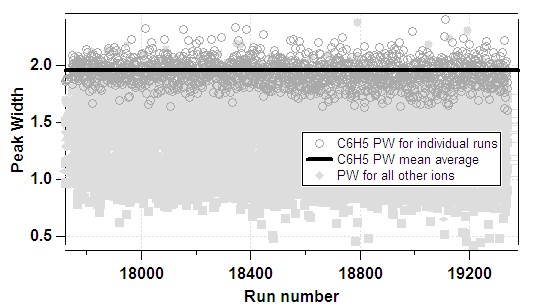
- 1) The average PW for each ion is determined from the time-series:
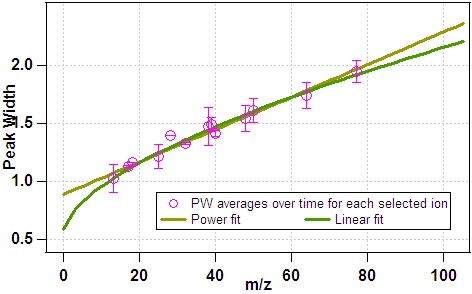
- 2) The fitting functions above are applied to the average data:
- 1) The average PW for each ion is determined from the time-series:
- On hitting the orange "Declare these PW parameters for this todo" button, PIKA flattens the time-dependence of your PW function to 2 or 3 parameters (depending on linear/power fit) which are declared to be the "final" peak width parameters for the entire todo wave. In consequent PIKA fitting, this single set of PW parameters are used for the HR fits on every run in the todo wave. This process happens in two steps:


Peak Shape
- ions have to be isolated at the tail level
Choose Ions

- Better to start simple, with fewer ions, and add ions as needed. Having too many ions in the fit can make the fit look good and have low residual for the wrong reasons. In version 1.05 the set of masses that were fit by default was significantly changed - about 70 HR fragments were changed from the default fitting status.
- Most people think that the CNO family of ions should NOT be used by default, and only added if really needed per users judgment.
- DeLaeter et al., Pure Appl. Chem., Vol. 75, No. 6, pp. 683–800, 2003 is a reference for a 2003 IUPAC Atomic Weights paper that contains many details regarding isotopes. It was recommended by James Allen at the HR Clinic.
- Curators of PIKA Ion List: Puneet Chabra (Chair), Delphine Farmer, Niall Robinson, Qi Chen
- Best Practices:
IMPORTANT DISCLAIMER: Determining what HR ions to fit in your final product is CRITICALLY dependent on how well the upstream procedures (m/z calibration, peak width calibration, peak shape determination) have been performed. This is the individual user’s responsibility. However, when done poorly and bad data is generated as a result, it reflects poorly on the HR-ToF-AMS community as a whole. If there is any doubt as to how well these upstream steps have been completed it is important to STOP fitting ions and re-examine previous steps to avoid this occurrence.
Getting ready to fit ions in PIKA

- PIKA step 3 “Choose HR masses to fit”
- Load current list of masses. Updates to the current list of ions may be available between Pika software releases. Contact the curators listed above for the latest status.
- Use default ion list to start
- To be certain that you are using default list, click “Set all mask values to default” button
- Click “Choose masses to fit” button
- Constrain isotopic ratios
- Click “Choose isotopes to constrain, check for isotopic parents” button
- The code will then do some checking to ensure that if a an isotopic HR fragment is selected to be fit and the user has chosen to constrain the isotope, then the isotopic parent is also fit. It also does some checking to see in which (temporal) order the integer mass groups of HR fragments needs to be fit in order that all parent fragments are fit before the constrained 'child' fragments.
- Opting to constrain isotopic HR fragments is a must for ambient datasets.
- Isotopes can be unconstrained for chamber experiments with isotopes (e.g., 13C)
- Users can opt to not constrain any isotopes via the Step 4 ii checkbox.
- Click “Choose isotopes to constrain, check for isotopic parents” button
- Constrain isotopic ratios
Group Ions into Families
- The concept of HR families was created from a 'book-keeping' point of view. It is not the same as 'species' like Organics or Nitrate.
- Each HR fragment will be a member of one and only family.
- Users can define families for their own purposes.
- To define your own family, follow the example of the tungsten family, separating HR fragments by ; and assigning a red, green, blue color value for this family.
- When the user presses the "Choose masses to fit" button in the Select Masses to Fit Panel, the pika code assigns a family to each fragment, based on the chemical formula.
- The "HR chosen masses table" button will show the list of HR fragments selected to be fit and the family it was assigned to. For those wanting to dig into the code, the function UM_GenerateAxByMaskWaves does the family assignments.
PIKA Fits
- PIKA step 4 “Calculate HR sticks for one spectra”
- Calculate HR sticks for a short (# runs) todo wave to increase S/N
- Inspect raw and fitted data for isolated peaks to ensure quality m/z calibration, peak widths, and peak shape (ex. m/z 32, 40, 64 among others)
- Residuals should be +/- 5% at a maximum for isolated peaks
- If residuals are not +/- 5% for isolated peaks, reexamine either m/z calibration, peak width, or peak shape. Determining the ions to fit will be VERY difficult if residuals aren't reasonable for isolated peaks.
- Evaluate the fits for peak width
- Look at very large, mostly isolated ions like O2 and Ar.
- Evaluate the fits for peak shape
- Look at the left side of m/z 48 and 64, which should not have any real ion to their left
- Look at the right side of m/z 41 (C3H5+)or other fragments with a high number of Hs, which should not have any ions to their right
- Determine what masses to fit beyond those in the default list
- Currently, this is largely a mass-by-mass process
- Best guideline at this point is to examine the residual at each integer mass
- Large positive residual is indicative of a missing ion (underfit)
- Large negative residual may be indicative of an ion that should be removed (overfit)
- More sophisticated fit errors will be built into future PIKA versions and will help
- Fit ALL masses present, even those in the open and closed, but maybe not in the difference
- When a mass is missing and needs to be added
- Check ions existing in the current list of ions (grey masses at bottom of PIKA fit window)
- Check for more obscure ions in the the HR ions list
- Use mass calculator to find candidate ions from websites such as http://omics.pnl.gov/software/MWCalculator.php, a downloadable software tool or http://www.sisweb.com/mstools/isotope.htm an on-line resource
- Add the ion to the list of ions in the experiment using “Add ion below to master ‘all masses’ list
- If no reasonable candidates can be identified, add the mass with a “unique” identifier, being aware that the Pika code will try to assign it a family as if it were a chemical formula.
- When an ion is in doubt (small signals)
- Particularly important for ions with low signal “living” between either between or in the tail of ions with large signal
- Remove and enter into the masses list and examine the impact on the residual
- If no change in residual, best to omit from fitting the ion (particularly important for data entered in PMF)
- Current recommendation is to be conservative
HR Results
- Look carefully at the patterns of CHN, CHNO, CS families spectra
- Also look at the elemental spectra for N, S
- Ions that greatly stick out are suspicious, and the user should go back to the PIKA fits and see whether they are real.
- Look at the “many parameters panel”
- Time series of residuals at different m/z’s
- May reveal patterns that are hard to find otherwise
- Look at spectra for the filter periods
- Compare multiple filters at different times as well as succesive runs within a given filter period
- Running PMF may be useful to clean up your data
- Almost always it finds “pathological ions” dominated by tails, MS woodo, etc.
- Go back to PIKA fits and clean up
HR Batch & Frag Tables
This is not implemented yet, but we are targeting to release a version with these components at the 2009 AMS Users Meeting in Toronto. These tables will define the RIE and CE and the fragments to be used to calculate mass concentrations of species from HR data. The frag table is needed to e.g. apportion the H2O+ signal between sulfate, organics, air, and particle water, or the CO2+ signal between air and organics, etc. Right now the user has to do that manually.
PIKA Species Loadings
For the time being, the users have to do that by themselves. We hope to release the HR frag table by the 2009 AMS Users Meeting in Toronto which will allow the calculation of mass concentrations from the HR data.