Difference between revisions of "ToF-AMS Analysis Software"
(→HR PTOF Step 1. Creating PToF data sets) |
(→Squirrel General FAQ) |
||
| (24 intermediate revisions by 2 users not shown) | |||
| Line 41: | Line 41: | ||
# A modern pc or Mac operating system. Squirrel is tested mainly on pcs using Windows OS, but should work on Macintosh OSX systems. It is not available for Linux operating systems. | # A modern pc or Mac operating system. Squirrel is tested mainly on pcs using Windows OS, but should work on Macintosh OSX systems. It is not available for Linux operating systems. | ||
| − | # The program Igor from [http://wavemetrics.com/ Wavemetrics]. At least Igor Version 6.38 (or the latest update). The latest version of Igor 7 is recommended. It also has been thoroughly tested on Igor 8. | + | # The program Igor from [http://wavemetrics.com/ Wavemetrics]. At least Igor Version 6.38 (or the latest update). The latest version of Igor 7 or 8 is recommended. It also has been thoroughly tested on Igor 8. |
# The HDF5 xop to be placed in your Igor Extensions folder. Igor Extensions are modular bits of code for extending functionality to Igor. The Igor Extensions folder resides in your Igor Pro Folder, and everything in this folder gets loaded automatically everytime you open Igor. The Igor extension you need is called HDF5.xop (or HDF5-64.xop for 64-bit computers) and in fresh installations of Igor resides in the "Igor Pro Folder/More Extensions/File Loaders" (or "Igor Pro Folder/More Extensions (64-bit)/File Loaders for 64-bit computers). Simply make a shortcut or alias to the .xop file and move this shortcut into the Igor Extensions folder. The instruction for this step can is demonstrated in this short [http://cires.colorado.edu/jimenez-group/ToFAMSResources/ToFSoftware/AMSTutorialMovies/HDF5XopSetUpForSquirrelPika.webm movie]. | # The HDF5 xop to be placed in your Igor Extensions folder. Igor Extensions are modular bits of code for extending functionality to Igor. The Igor Extensions folder resides in your Igor Pro Folder, and everything in this folder gets loaded automatically everytime you open Igor. The Igor extension you need is called HDF5.xop (or HDF5-64.xop for 64-bit computers) and in fresh installations of Igor resides in the "Igor Pro Folder/More Extensions/File Loaders" (or "Igor Pro Folder/More Extensions (64-bit)/File Loaders for 64-bit computers). Simply make a shortcut or alias to the .xop file and move this shortcut into the Igor Extensions folder. The instruction for this step can is demonstrated in this short [http://cires.colorado.edu/jimenez-group/ToFAMSResources/ToFSoftware/AMSTutorialMovies/HDF5XopSetUpForSquirrelPika.webm movie]. | ||
# The latest Squirrel software, a packed Igor template, downloadable from the link: [http://cires.colorado.edu/jimenez-group/ToFAMSResources/ToFSoftware/index.html http://cires.colorado.edu/jimenez-group/ToFAMSResources/ToFSoftware/index.html]. If you do not know the credentials for downloading, email [mailto:donna@aerodyne.com Donna at aerodyne.com] | # The latest Squirrel software, a packed Igor template, downloadable from the link: [http://cires.colorado.edu/jimenez-group/ToFAMSResources/ToFSoftware/index.html http://cires.colorado.edu/jimenez-group/ToFAMSResources/ToFSoftware/index.html]. If you do not know the credentials for downloading, email [mailto:donna@aerodyne.com Donna at aerodyne.com] | ||
| Line 357: | Line 357: | ||
===Working with MS data=== | ===Working with MS data=== | ||
| + | |||
| + | * '''What is the difference between the options 'Update' and "Do Nothing" in the Plot menu in the MS tab?''' | ||
| + | For most types of plots there is no difference. For average MS plots where the user has selected to use the Graph controls, then care needs to be taken regarding the UMR sticks, which are traditionally plotted as 'stack to next'. The legend and the top most controls displayed in average UMR mass spectra plots will be recalculated and updated when the 'Update' option is selected. The 'Do Nothing' option means just that; no graphs are touched. | ||
* '''When generating an average mass spectra what does the 'Truncate sticks to 0' checkbox do?''' | * '''When generating an average mass spectra what does the 'Truncate sticks to 0' checkbox do?''' | ||
| Line 429: | Line 432: | ||
The very first hour bin accumulates data with a time stamp from 0:00 to 0:59:59.5 (time stamps are rounded to the nearest integer). The plots that are displayed use the wave root:panel:diurnals:DiurnalCounter which has values from 1 to 24 so the plots x axis show the data at the end of that hour's accumulation. | The very first hour bin accumulates data with a time stamp from 0:00 to 0:59:59.5 (time stamps are rounded to the nearest integer). The plots that are displayed use the wave root:panel:diurnals:DiurnalCounter which has values from 1 to 24 so the plots x axis show the data at the end of that hour's accumulation. | ||
| + | |||
| + | |||
| + | *'''When might the use of separate open and closed m/z calibration parameters be needed? | ||
| + | |||
| + | The use of separate m/z calibration parameters for UMR data is irrelevant. Early on in the development of Pika it was noticed that in rare cases the m/z calibration seemed different between open and closed spectra. This behavior was only seen for aircraft measurements (the same instrument on the ground did not display this behavior), and was only seen upon close examination of peaks, as in the Pika fitting graph. A physical explanation was never determined (to my knowledge). But the behavior was measurable enough such that different parameters for open and closed spectra was needed. Performing an m/z cal on open spectra is not ideal as there are so few isolated peaks to begin with, and the changing aerosol signal can mean that different peaks will appear/disappear throughout the measurements. So Pika users of this feature should proceed with caution, as the Pika fits rely so heavily on the mz parameters. | ||
| + | |||
| + | One declares open or closed m/z parameters in the mz calibration panel. Select to fit the open (or closed) spectra in step 1, fit in step 3 and declare in step 6. In Pika Step 4 and 5 one can elect to use these separate parameters or not via checkbox checkbox 4iii. When not checked, the code will use the last calculated m/z calibration values. To determine if separate open/closed mz cal parameters are needed one should examine isolated ions in the Pika graph window and see a characteristic sharp up-down or down-up pattern in the raw spectra (black dots) across several mzs, when checkbox 4iii is unchecked. | ||
| + | |||
| + | Note that the Pika graph still displays 'fits' in the open - closed spectra section, even though the red y axis legend says "NOT FITTED". For display purposes the raw open - closed spectra black dots are shown and the open m/z cal parameters are used for display of the difference spectra. There is no mapping of the closed spectra on to the open m/z x axis points. Shown difference 'fits' in red are simply for display purposes. | ||
===Working with PToF data=== | ===Working with PToF data=== | ||
| Line 738: | Line 750: | ||
Users must [http://cires1.colorado.edu/jimenez-group/ToFAMSResources/ToFSoftware/ upgrade] to at least pika version 1.22. | Users must [http://cires1.colorado.edu/jimenez-group/ToFAMSResources/ToFSoftware/ upgrade] to at least pika version 1.22. | ||
| + | |||
| + | Below are a series of links to some you tube videos demonstrating HR PToF analysis of a small data set. These videos do not exhaust the available features, but rather provide a visual guide for users new to these features. | ||
| + | |||
| + | [https://youtu.be/CL6wlnF-XRs HR PToF intro] | ||
| + | |||
| + | [https://youtu.be/s6UmdxKs4X0 New Raw PToF data sets] | ||
| + | |||
| + | [https://youtu.be/N-bCDTQkMaQ Setting up a HR PToF matrix data set] | ||
| + | |||
| + | [https://youtu.be/whTjacLxkxk HR Fitting of PToF data sets] | ||
| + | |||
| + | [https://youtu.be/_hrtSLW-QDs HR PToF data set subtraction] | ||
| + | |||
| + | [https://youtu.be/nHDrq_TVvxc HR PToF results!] | ||
| + | |||
| + | [https://youtu.be/aBBR1DIGfds More HR PToF results!] | ||
====HR PTOF Step 1. Creating PToF data sets ==== | ====HR PTOF Step 1. Creating PToF data sets ==== | ||
| Line 745: | Line 773: | ||
The picture below shows that the user has generated 3 data sets. The dc1 data set will be used for later subtraction. | The picture below shows that the user has generated 3 data sets. The dc1 data set will be used for later subtraction. | ||
| − | [[File: | + | [[File:SetupPToFdataSet.PNG|frameless|border|caption|link=http://cires1.colorado.edu/jimenez-group/wiki/images/f/f9/SetupPToFdataSet.PNG]] |
====HR PTOF Step 2. Performing HR fits ==== | ====HR PTOF Step 2. Performing HR fits ==== | ||
| Line 751: | Line 779: | ||
An optional step is to perform an HR fitting for two sets of PToF data sets (Pika step 4). To perform HR fits on the raw PToF spectra, make sure that Pika step 4 the PToF radio button is selected (default is MS). A user may choose to fit many PToF data sets with one push of the HR - Step 5 "Calc HR sticks for all runs in todo wave" gold button by selecting PToF groups in the list box near Pika step 5B. | An optional step is to perform an HR fitting for two sets of PToF data sets (Pika step 4). To perform HR fits on the raw PToF spectra, make sure that Pika step 4 the PToF radio button is selected (default is MS). A user may choose to fit many PToF data sets with one push of the HR - Step 5 "Calc HR sticks for all runs in todo wave" gold button by selecting PToF groups in the list box near Pika step 5B. | ||
| − | + | [[File:HRPToFStep2.jpg|frameless|border|caption|link=http://cires1.colorado.edu/jimenez-group/wiki/images/a/ac/HRPToFStep2.jpg]] | |
| − | |||
====Step 3. Perform the HR version of the DC marker subtraction ==== | ====Step 3. Perform the HR version of the DC marker subtraction ==== | ||
| − | The HR panel above also demonstrates an example of generating a PToF HR sticks data set from HR fitted data sets. Recall that the PToF data requires an analog to the MS Closed, an estimate of the signal seen when aerosol is not in the system. For UMR data we perform this action in the DC marker graph, and use | + | The HR panel above also demonstrates an example of generating a background subtracted PToF HR sticks data set from HR fitted data sets. Recall that the PToF data requires an analog to the MS Closed, an estimate of the signal seen when aerosol is not in the system. For UMR data we perform this action in the DC marker graph, and use define regions in the PToF time dimension to determine these estimates. For the HR PToF data, we do not yet have quite the same infrastructure. Here all HR ions, whether they are gas phase ions, such as Argon or C3H4 at m/z 40 use the same DC marker region for subtraction. In the example above, the PToF raw spectra group identified as the DC marker region 1 (dc1) is subtracted from the matrix data set (M29y114). The difference matrix M29y114_dc1 contain the time series of the HR signal from aerosols within the size range determined by PToF bins 29-114 with an estimate of the background (PToF bins 20-28) subtracted. |
| − | ====Step 4. Generating | + | ====Step 4. Generating size distribution, PToF image plots of HR PToF data.==== |
| − | The panel below shows an example of a | + | The panel below shows an example of a the PToF size image plots of two HR ions C2H3O and C3H7 for the aerosol represented by the (original) size on PToF bins 29-114. |
| + | Size distribution and image plots, and optional normalizing to the MS data features mimic features available for UMR PToF data. | ||
| − | + | [[File:HRPToFResults.jpg|frameless|border|caption|link=http://cires1.colorado.edu/jimenez-group/wiki/images/1/1b/HRPToFResults.jpg]] | |
= Apes (ToF-AMS High Resolution Elemental Analysis software)= | = Apes (ToF-AMS High Resolution Elemental Analysis software)= | ||
Revision as of 13:24, 13 February 2020
Contents
- 1 ToF_AMS Analysis Software Resources
- 2 Squirrel (ToF-AMS Unit Resolution Analysis Software)
- 2.1 Squirrel General FAQ
- 2.2 Squirrel Technical FAQ
- 2.2.1 Todo Waves
- 2.2.2 File and Experiment Organization
- 2.2.3 Default Settings
- 2.2.4 The 'Get Index' Step
- 2.2.5 Working with MS data
- 2.2.6 Working with PToF data
- 2.2.7 Working with ePToF data
- 2.2.8 The Frag and Batch Table
- 2.2.9 Composition Dependent Collection Efficiency (CDCE Panel)
- 2.2.10 Exporting Results to the AMS Unit Mass Resolution Database
- 3 Pika (ToF_AMS High Resolution Analysis software)
- 4 Apes (ToF-AMS High Resolution Elemental Analysis software)
- 4.1 Apes General FAQ
- 4.2 Apes Light Code (A stand-alone APES for use in PMF results or for individual HR spectra)
- 4.3 Apes-in-Pika Code (APES code that has now been merged into Pika versions 1.07+, versions with HR species)
- 4.4 Apes Code (The original APES, or APES classic, for use in Pika without HR species)
- 5 Sparrow Light Scattering Module Analysis
- 6 Help
ToF_AMS Analysis Software Resources
- A shortcut to this page is http://tinyurl.com/tofams-analysis
- If you want to cite this page in a publication, please cite "D. Sueper and collaborators, ToF-AMS Data Analysis Software Webpage, http://cires1.colorado.edu/jimenez-group/wiki/index.php/ToF-AMS_Analysis_Software"
- If you want to cite specifically the high-resolution fitting procedures in the software, please cite also DeCarlo et al. (2006) which developed and reported those.
Useful Links
Squirrel (ToF-AMS Unit Resolution Analysis Software)
Squirrel General FAQ
- What do I need to run Squirrel?
- A modern pc or Mac operating system. Squirrel is tested mainly on pcs using Windows OS, but should work on Macintosh OSX systems. It is not available for Linux operating systems.
- The program Igor from Wavemetrics. At least Igor Version 6.38 (or the latest update). The latest version of Igor 7 or 8 is recommended. It also has been thoroughly tested on Igor 8.
- The HDF5 xop to be placed in your Igor Extensions folder. Igor Extensions are modular bits of code for extending functionality to Igor. The Igor Extensions folder resides in your Igor Pro Folder, and everything in this folder gets loaded automatically everytime you open Igor. The Igor extension you need is called HDF5.xop (or HDF5-64.xop for 64-bit computers) and in fresh installations of Igor resides in the "Igor Pro Folder/More Extensions/File Loaders" (or "Igor Pro Folder/More Extensions (64-bit)/File Loaders for 64-bit computers). Simply make a shortcut or alias to the .xop file and move this shortcut into the Igor Extensions folder. The instruction for this step can is demonstrated in this short movie.
- The latest Squirrel software, a packed Igor template, downloadable from the link: http://cires.colorado.edu/jimenez-group/ToFAMSResources/ToFSoftware/index.html. If you do not know the credentials for downloading, email Donna at aerodyne.com
- When I open a SQUIRREL template I am getting a compilation error at HDF5OpenFile (or HDF5CloseFile or HDF5xxxx). Why?
This compilation errors appears when the HDF5.xop was not loaded. See 'What do I need to run Squirrel?' Typically this happens when users get a new computer, installs Igor, but then forgets to create an HDF.xop shortcut or fix a broken shortcut to this file.
- How do I upgrade a squirrel experiment?
It is always a good idea to upgrade your existing squirrel experiments. Upgrading Squirrel or Pika experiments consists of loading new ipfs (Igor Procedure Files), killing the old ones, and recreating the main panels. Ipfs can be shared or adopted in any experiment; consult the Igor documentation to understand which method you would like to use. The Squirrel and Pika template experiments by default have the ipfs adopted, as this makes it easier for users to share experiments across different platforms and users.
To upgrade old experiments:
- Download, unzip, load and compile the ipf named UpdateSQPKVersion.ipf available at the Squirrel and Pika download site.
- Download, and unzip the file with the latest ipfs that you want to upgrade to. They are available at the same download site.
- From the AMSIpfManager menu item select the first item "Upgrade ipfs and ADOPT ipfs. The user will be prompted to select the folder where these ipfs reside.
- The code will automatically kill the old ipfs, load in the new ones and recreate the main Squirrel (and Pika) panels. Users are advised to save the experiment after upgrading.
- Why Squirrel?
The ToF-AMS can generate large data sets (> 10s Gigabytes) very quickly. The need for a somewhat standard user interface for analyses of these often large data sets was identified, and Squirrel was born. Squirrel is a software tool using Igor on HDF files for analyzing ToF-AMS data. Squirrel is an ongoing, collaborative effort between researchers using the ToF-AMS instrument. Its development to date has been lead by the University of Manchester, University of Colorado, Boulder, Max-Plank Institute, Mainz, and Aerodyne Research, Inc. It is free and is covered by the GNU's General Public License, which means we want to keep it free and give all users the freedom to improve and redistribute the software. An older version of software that has some of the same functionality is called TADA. TADA will eventually not be supported. Squirrel's foundation using HDF files will allow for analysis and manipulation of data sets larger than TADA can handle.
- What is Squirrel?
SQUIRREL (SeQUential Igor data RetRiEvaL ) is a data management utility for Igor designed around the random access of AMS data in HDF (version 5) files and within memory. It is a task-based system that exists as a layer between the function calls and the data processing functions; the idea is that all data processing is done through SQUIRREL. The SQUIRREL name may or may not really come from a White Stripes song.
- What are the advantages of Squirrel over the existing methods?
First and foremost, it eliminates the limits imposed by having to load all the data into memory. Previously, with the Q-AMS data, we were limited to experiment files of less than a gigabyte in size, which is going to hamstring us even further with the advent of the ToF-AMS instruments. But using this system, the binary data is kept on a hard drive as much as possible. Also, as the data is accessed selectively, you only grab as little or as much is needed, greatly speeding up the processing times for simple tasks while still able to perform the big ones. Finally, because it adopts a pseudo-object orientated approach, it should make the development of new analysis methods that can access the data much easier.
- How does Squirrel work?
Instead of simply performing a data analysis task on a wave in memory, a call to SQUIRREL is made. The call consists of a ‘to-do’ list, the operation that you wish to perform on the data, some operation-specific parameters and a list of the data types that the functions operate on. SQUIRREL takes a look at the to-do list, retrieves the data and passes it to the function. In the case that there is too much data to analyse in one go (e.g. when analysing PTOF data), the task is broken into chunks (known internally as acorns) which results in multiple function calls. In order to access the data in the HDF files, an index needs to be built, which is handled by a separate function, assumed to have been run before the function call.
- What are the very basic steps in analyzing a data set with Squirrel?
Analysis steps are generally placed top to bottom, left to right in the ams panel. Briefly:
- Gather all the hdf files you wish to analyze in one folder.
- Press the Get Index button. A prompt ask you to identify the folder of your hdf files. This function identifies runs and gathers basic information about the data set. The program will search in folder you chose and all subfolders (and subfolders...).
- Press the Pre-Process button. This may takes some time to complete. This function generates more handy, organized versions of the data, called intermediate hdf files. A prompt will ask you for a location to put these intermediate hdf files and will save the experiment (will prompt you for a name and location of this experiment).
- Go to the MS and PToF tabs and generate graphs of your choosing, such as time series and size distributions.
- What is an HDF file?
HDF5 is a general purpose library and file format for storing scientific data. In Igor, one can browse the contents of an hdf file via the Data - Load Waves - New HDF Browser feature. Non-Igor tools for browsing hdf files can be found at this link.
- Can Squirrel deal with a data set where a run number is 0?
No. If you are resetting the run number in the DAQ, use a number greater than 0. Squirrel relies on the idea the run numbers are monotonically increasing (runs can be skipped) with time. So if the computer clock changes, or the DAQ crashes and on reboot is using an old menu with an old run number, you won't be able to analyze the data over the time/run reset values. Squirrel is designed to be able to gradually build experiments by 'adding' more DAQ files (via repeated presses of the "Get Index' button). The addition of DAQ hdf files do not have to be consecutive in time, but if 'earlier' hdfs are indexed, some operations, like the AB correction will need to be recalculated.
- Are there problems with Squirrel?
There are fewer problems as time goes by. The essential tasks of generating times series and average mass spectra for species and the conversion to ug/m3 units is considered to be robust.
- What does Squirrel have to do with HieDI?
HieDI and TADA are igor programs that assisted in the transition of the AMS DAQ from saving files in .itx format to hdf. HieDI is a software tool for converting ToF-AMS .itx and .bin files into .hdf files. The .itx and .bin files are generated using older acquisition software (mostly pre-2007). Analysis of the .itx and .bin files can be done through an Igor software package called TADA. TADA is no longer supported and everything must be done through Squirrel and .hdf files.
Squirrel Technical FAQ
Todo Waves
- What is a to-do (or todo or 'To Do') wave?
A todo wave is simply a column of integers containing run numbers. A user selects a todo waves to identify the runs that are to be operated on. For example, if you wanted to average all the runs between 102 and 105, you would make a todo wave that would contain four runs: 102, 103, 104 and 105, and select this todo wave from the todo wave drop down menu. Some todo waves are automatically generated, such as all, allV, allPTof, allsEI, new, etc. Todo waves can also be generated based on mask waves, so you can selectively process data based on an inlet condition, wire position, meteorological conditions or anything else.
- What's some good advice regarding todo waves?
Don't use Igor 'liberal' names. Specifically,don't use spaces in the names, don't begin it with an alphabetic character, etc. Don't use the reserved todo wave names: all, new, and blacklist, allsEI, etc. You should be aware that several graphs automatically color traces that have an AMS species (such as Org or Chl)in their name. For example, squirrel will often automatically designate the color green for those waves with "Org" in the name. If you make a todo wave using these default AMS species names, the colors for graphs will have the color of that species. In general you are advised to name a todo wave "HighNitrate" instead of "HighNO3" or "HydrocarbPlume" instead of "OrgPlume".
- How can I convert a 'regular' wave to a todo wave?
Often users have found it handy to create their own wave of run numbers, and they want to know how to make this wave appear in the todo wave drop-down menu in the panel. In general, I recommend that a user duplicate an existing todo wave, such as the all todo wave. One can then delete all points in this duplicate wave, and then fill it in with run numbers of their choosing. Then simply select the 'Get List' option and the new todo wave should appear. The other way is to straight-forward but technical. A todo wave needs to be a 32 bit unsigned integer type; the wave type can be changed in the redimension window. Also, the todo wave must have this text in it's wave note: "TYPE:todo" (without the quotes). One can add a wave note via the info area in the Data Browser window or by using the Igor Note command (Note mywave,"TYPE:todo").
- Can I un-blacklist a run?
Somewhat. First, save your experiment before you try this. Then make a table of the blacklist wave. Delete rows containing the run numbers you want to un-blacklist. Do not attempt to insert run numbers here, just remove them. When you are finished, press Get-Index again. This will go through some todo wave and indexing functions; the 'all' todo wave will now have the un-blacklisted runs. Unfortunately user-defined todo waves will NOT have the newly-unblacklisted runs inserted. Depending on where you are in your analysis, you may have to re-preprocess for downstream values to appear.
- Is the blacklist wave a todo wave?
No, in squirrel the blacklist wave isn't a 'real' todo wave. Every real todo wave has the wave note "TYPE:todo;" attached to it, and the appearance of this note and the fact that a todo wave is of integer type (not single precision, etc) is what makes a wave a todo wave. The blacklist wave is not in the todo wave table on purpose.The idea is that this wave would always be set apart - the name is always blacklist and it always contains the cumulative list of all runs that were deemed junk, never to be looked at again. The runs in blacklist are cumulative.
- How can I remove a todo wave that's no longer needed from the todo wave list?
If you don't need the wave again, you can simply kill the wave and select 'Get List' from the todo wave drop-down menu. If you want to prevent it from appearing in the todo drop down menu, you can change the wave type to something other than a 32-bit integer or you can remove the todo wave note (See 'How can I convert a 'regular' wave to a ToDo wave'? above).
- How can I make todo waves based on the DAQ menu numbers?
The menu numbers themselves are not saved in any parVal or infoVal setting as menu numbers them selves are meaningless. A user could switch menu 1 and 3 for example, and the menu numbers themselves would not be helpful in determining what kind of data a particular run has. Instead, there are 3 waves that can/should be able to sort out the needed settings for any particular run: tofType ( 1 = v or 2 = w, c = 0), ionizationType (EI, sEI, etc, given by numbers) DAQSamplingType(parVal #162). This is a new wave created and used in version 1.45. The idea is that any unique combination of these 3 waves should be able to uniquely identify all original menus.
The wave root:diagnostics:DAQSamplingType isn't directly a wave menu number, but should indicate different menu settings. You can generate todo waves based on the 1/0 (yes/no) values of a third wave. So if you want to generate a todo wave when the DAQSamplingType is 3 enter the following in the command line
duplicate/o root:diagnostics:DAQSamplingType myTemporaryWave
myTemporaryWave = root:diagnostics:DAQSamplingType[p]==3 // create a wave with 1s where DAQSamplingType is 3 and 0s elsewhere
Then on the squirrel panel, TodoWave Creation section, instead of entering runs enter myTemporaryWave as the Run Interval. Enter a name for the todo wave you want created in the 'Name' and press the New Todo button. To clean up things nicely, you should kill myTemporaryWave after your todo wave has been created.
- Can I use logical operators when I create a todo wave?
Yes, the words 'and', 'or' and 'not' are allowed. Here are some examples of valid entries one can enter in the Run Interval control (instead of simply run numbers).
TodoWave1 and TodoWave2
TodoWave1 or TodoWave2
TodoWave1 and not TodoWave2
72658-74364 or TodoWave1 or 75000,75100
You can also use user-created 'mask waves. See the example in the question 'How can I make todo waves based on the DAQ menu numbers?' above.
- Can I create a todo wave using point numbers (i.e. the row number from the run index table?
Yes. Instead of entering run numbers such as 4130-4227 one can enter p10-p107 (assuming run number 4130 is the 10th run indexed in the experiment, 4227 is the 107th run).
File and Experiment Organization
- What are intermediate files?
The intermediate files are essential components of your Igor experiment. If you were to move the intermediate files to another location and reopen the igor experiment, you will get a prompt asking for their location. Intermediate files can grow large. One good strategy is to create a separate, dedicated folder to house them, and locate this intermediate data folder in the same folder as your experiment. If you are in doubt as to what intermediate files are attached to an experiment, go to the misc tab and press the button 'HDF file Table (do not edit)'. But don't try to edit IN ANY MANNER with this wave, or any other waves in the index folder. That is a big no-no.
- How big should my intermediate files be?
Intermediate files should generally be no bigger than ~ 370 MB. This maximum limit is to allow easier transfer of intermediate files between computers. The items that take the most space are the raw spectra (for both the DAQ and the intermediate files). The _m DAQ files have the MSOpen and the MSClosed data sets. The intermediate files have these raw spectra data sets: MSOpen_p, MSClosed_p, MSDiff_p, and the baseline subtracted versions: MSOpenLessBaseL_p, MSClosedLessBaseL_p, MSDiffnLessBaseL_p. A good rule of thumb is that the sum total of the intermediate files when doing pika should be about 3 x size of the DAQ files. This is a good question so I'm putting it on the pika/squirrel wiki
- Is squirrel making new versions of the data set each time I preprocess (and thus making my intermediate files huge)?
No, Squirrel and Pika always have one and only one copy of any data set. So any time you calculate UMR sticks, it will overwrite that data set MSSOpen, etc.
- On a Mac OSX system how do I change the font size so that the text fits the buttons in the panel?
In the command line enter DefaultGuiFont button={"Geneva",9,0}. Thanks to Pete DeCarlo for the tip.
- What can I do when a pxp file goes missing/bad?
From a user: An HR-Squirrel pxp of mine recently disappeared. I think my computer crashed while it was unsaved, which is very sad. But the intermediate files are still there - is there any useful information that can be easily mined from them, or is best if I just start over? The response: Without the root:index:squirrel_index wave, which 'lives' in the pxp file, the intermediate files are pretty much worthless. An extra ipf named SQ_forBadIntermediateFiles is available for users to eliminate squirrel_index references to corrupted intermediate files. Contact Donna (at) aerodyne.com to obtain it.
- I have been getting the error 'You cannot choose a time interval where the time base interval is <=0. or '..Aborting from Sq_tbase()' when I try to get time series concentrations for Org, SO4, etc. What is happening?
Check the bottom part, "Time Base Selection", of your squirrel panel. Somewhere along the way the radio button "As saved" got unselected and the "Set Interval (m)" got selected.
- If I select a custom wave in the Time Base Selection, why does the resulting time series trace have one less point than the number of points in the custom wave that I selected?
The custom wave has to be a start-stop type of wave. The code needs to know the beginning and ending points of each new time period so it knows how to do a weighted average of the time intervals of the AMS data. The code assumes that the time wave you selected has consecutive times indicating the beginning and ending points. So the AMS time series wave that is created will be 1 points less than the custom wave. So if your custom time wave has data points:12:00:00, 12:05:00, 12:10:00, etc. the code would look for any AMS run that has data between 12:00 and 12:4:59, etc. If it does have data within that time interval it would generate a weighted average for that time point. So if your AMS Org data is (recall AMS time is the END of the measurement)
12:00:00 10
12:02:00 20
12:04:00 30
12:06:00 40
it would do an average like this
(2*20 + 2*30 + 1*40)/5 = 28 for the first data point (between 12:00 and 12:05:00).
Default Settings
- Why is the default RIE value for the nitrate species 1.1 instead of 1?
The RIE is defined compared to the sum of nitrate ions in the m/z (30+46). RIE_x = (Ions_x/Molecule_x) / (Ions_30+46/Molecule_30+46) * MWno3 / MWxThus, if one were to sum ALL nitrate ions (including m/z 63 for nitric acid, 14 for nitrogen, isotope ions due to 15N and 18O, etc.), one gets ~1.1 * (sum of 30+46). Another way of saying this is that (14+30+46+63+...)/(30+46) ~ 1.1.
- What are the basic component of a squirrel template experiment file?
One can create a squirrel template file 'from scratch' by simply importing all these ipfs:
- SQ_AMSPanel_version#.ipf - contains all the global variables, strings, code to make things on the main AMS panel work.
- SQ_Backbone_version#.ipf - contains code for the squirrel infrastructure (extracting and saving only parts of data sets one is working on at any one time).
- SQ_FragDiag_version#.ipf - contains code for 'Alice's diagnostics', which is used to help with checking frag table entries.
- SQ_MSConc_version#.ipf - contains code for generating AMS data products such as Org time series, average mass spectra, etc.
- SQ_MzCalBkgd_version#.ipf - contains code for the m/z calibration and baseline panels.
- TW_ePTOFQ_version#.ipf - contains encrypted code for ePToF Tofwerk deconvolution
- TW_ePTOF_version#.ipf - contains code for ePToF Tofwerk deconvolution
- TW_bslSmUnit_version#.ipf - contains encrypted code for the Tofwerk-derived baseline as can be seen in the baseline panel.
- and importing the 'frag' data folder. Waves in the frag data folder contain text waves with default settings for generating organic, nitrate, etc, AMS species.
- Is there something special that should be done when analyzing non-ambient data?
The default frag waves are optimized for ambient conditions; there are a few places where the default frag entries need to be checked for each instrument, each project - see the checks tab. Also, default frag waves need to be changed when doing lab studies, i.e. using N2 only (and not a clean air gas mixture) as a carrier gas, or when only known components should be present. There is no simple button to press within squirrel that would convert default frag entries to accurately reflect non-ambient conditions.
- I want to examine some of the DAQ parameters that aren't automatically loaded in during the Get Index step. How can I do this?
The function in squirrel named sq_getNewDiagValuesList already does what you want. Here is how you would call it from the command line squirrel_fetch(all,sq_getNewDiagValuesList,"dataFolderStr:diagnostics;colList:2/3;destList:ParVal2/parVal3","ParVal;"). This would dump ParVal #s 2 and 4, counting from 0, into waves called ParVal2 and ParVal4 into the diagnostic folder. The somewhat tricky thing is that it would match the all todo wave, not the t_series wave, if you removed or blacklisted some runs from the all todo wave. It could easily be modified for other DAQ values. Some data sets acquired with older DAQ software (pre-2006ish) may not have some of the DAQ values saved. A user can always open up an hdf file via Igor's HDF browser to examine individual values.
The 'Get Index' Step
- What's the difference between *_series and *_index waves?
The waves run_index, rn_series, time_index and t_series will always have the same number of points. The _index waves track each other and indicate a simple listing of when a run was identified as being under consideration, being in an hdf file. The _series waves also track each other, and they have the same information in them as the _index waves, but the series waves are in chronological and run-number increasing order. Data is processed in squirrel in increasing order, that is, using the _series waves. You should always use the _series waves for plotting and such. I can't think of a reason why a user would need to look at the run_index wave. It may be confusing because often the rn _series and the run_index waves are identical, and one may get used to looking at the *_index wave. But you should always use the *_series waves.
- How does squirrel handle 'fast mode' data?
Fast mode data is a data acquisition mode whereby a only either an MS Open or MS Closed spectra is acquired. It is appropriate for situations where the signals are changing rapidly in time and the amount of time it takes to move the chopper impedes the ability to capture quick events. See the description in FastModeDataTutorial.pdf for more info on the DAQ.
Here are some things to consider when dealing with fast mode data: In the Get Index step, squirrel should automatically create allFastOpen and allFastClosed todo waves. For fast mode runs, it is good to blacklist the first and/or last closed spectra for each fast mode cycle. Squirrel finds these edge runs. You can then blacklist the closed Edge runs. You then want to recalculate your sticks to get Squirrel to get newly interpolated closed sticks across your fast open runs. The first and/or last open runs in your fast mode cycle may also need to be trimmed. You won't want to report these smeared runs as ambient data. The default m/z calibration settings use MSClosed, not MSOpen (and not MSOpen_p and MSClosed_p), so for fast mode open runs, you will need to be prepared for this and handle as you wish. Lastly, often aircraft measurements require different m/z calibration results for open and closed. I am not clear on why this trend seems to be true, but anecdotally this is the case. This has nothing to do with Fast mode data, but it is something to be aware of. See the tutorial pdf downloadable in the tutorials section of this wiki for details.
- Which parameters get loaded automatically into squirrel at the Get Index step?
The DAQ saves hundreds of parameters for each run; about 50 are automatically loaded, and where appropriate, converted to different units upon loading. The list of parameters, grouped into data sets called ParVal (parameter values), ComParVal (common parameter values) InfoVal (information values) are listed in the appendix of the DAQ manual. The waves automatically loaded by Squirrel are in the diagnostics folder. All waves for standard diagnostics, units conversion, and generation of typical AMS data are created at the Get Index step. In the index folder there are 3 text waves which give descriptions of all the saved parameters, whether or not they were loaded into squirrel: CommonParStr, InfoText, and ParStr. Users should be aware that the lists of these data sets often begin counting from 1 (i.e. the first item is #1) whereas Igor counts from 0 (the first entry in a wave is at row 0).
- Does the time stamp of a run refer to the start or end of a measurement period?
The time stamp of a run indicates the end of a measurement interval. In DAQ versions 5.0.5 and higher, the wave root:diagnsotics:TotalTimeElapsedInRun indicates the complete duration of a run. So root:index:t_series - root:diagnsotics:TotalTimeElapsedInRun is the start time.
- What is the difference between all the time* waves that get loaded into the diagnostics folder at the Get Index Step?
The different waves that deal with DAQ time are used for different purposes. The appendicies in the DAQ manual indicate all the parameters that are saved for each run. Some waves are historical artifacts, and for some DAQ hdfs that were acquired with old versions of the DAQ, some timing waves have Nan or -9999 values. The typically most important and valuable parameters are listed in the table below. The units of all the resultant waves are in seconds. All the parameters within the data sets ParVal, ComParVal, and InfoVal. are *counting from zero* (Note that in the DAQ documentation only InfoVal 'counts from zero', while ParVal and ComParVal count from one.)
| Mode | Measured Acquisition Time During Mode | Name Within Squirrel | Use Within Squirrel | Calculated Acquisition Time During Mode | Name Within Squirrel | Use Within Squirrel |
|---|---|---|---|---|---|---|
| MS Open | InfoVal(76) | TimeAcquiringMSOpenInRun | Error calculation | InfoVal(11)* ParVal(82) | TimeMSOpen | No longer used. Can be compared to TimeAcquiringMSOpenInRun to determine timing efficiency |
| MS Closed | InfoVal(77) | TimeAcquiringMSClosedInRun | Error calculation | InfoVal(22)* ParVal(82) | TimeMSClosed | No longer used. Can be compared to TimeAcquiringMSClosedInRun to determine timing efficiency |
| PToF | InfoVal(78) | TimeAcquiringPToFInRun | Error calculation (not fully implementd) | InfoVal(10)*ParVal(10)*InfoVal(16)*InfoVal(14)*ParVal(4)*1e-6 | TimePToFSec | Can be compared to TimeAcquiringPToFInRun to determine timing efficiency |
| BFSP | InfoVal(79) | TimeAcquiringBFSPInRun | Not used |
Several comments to the table entries above:
- Note that for any run, the time associated with it is the end time of that run.
- The parameters TimeAcquiringMSOpenInRun is almost identical to TimeMSOpen; TimeAcquiringMSClosedInRun is almost identical to TimeMSClosed.
- For the calculation of MS errors and the minimum error (for PMF) we want to use the amount of time the DAQ is actually measuring signal. Older versions of Squirrel used TimeMSOpen and TimeMSClosed; versions 1.55 and higher uses TimeAcquiringMSOpenInRun , TimeAcquiringMSClosedInRun, .
- Getting the precise amount of time spent acquiring in PToF mode is somewhat difficult due to the uncertainty in the timing of the spinning chopper.
- There is a difference between TimeAcquiringPToFInRun and TimePToFSec; TimePToFSec <= TimeAcquiringPToFInRun and TimePToFSec will be the value used for the calculation of PToF errors (when it becomes generally available). This is because TimePToFSec accounts for the fractional amount of time within one chopper period that we acquire data. (A chopper period is the time between successive packets of aerosol that enters the system via the chopper slit.) Both TimeAcquiringPToFInRun and TimePToFSec indicate the amount of time spent acquiring data for that run, and doesn't consider the time spent within each PToF size bin.
- An alternative calculation that is an analog to TimeAcquiringPToFInRun is ParVal(10)*InfoVal(10)/ComParVal(37). Like TimeAcquiringPToFInRun, this value does not take into consideration the fractional amount of time within one chopper period that we measure ions.
- In versions of the DAQ prior to May 2012, when a user is in the fast mode, the TimeAcquiringMSOpenInRun, TimeAcquiringMSClosedInRun, TimeMSOpen and TimeMSClosed are incorrect; all these waves give timing values of 1. Users can use the values in wave FastModeAvgTimeSec (see below) for the fast mode periods. The timing of duration within each MS open/closed mode is very accurate. In versions 1.52+ versions of squirrel TimeMSClosed and TimeMSOpen will have the correct time when in fast mode.
Other timing waves in the diagnostic folder and their calculations are given below. These waves are generally informational only and are not used in default calculations. Typically users do not need to know the difference between these waves. Some waves may no longer exist it later versions of Squirrel and Pika to prevent confusion.
- DurationOfRun = InfoVal(80)
- SavingIntervalTime = InfoVal(3) This wave can be useful for creating start - stop waves to average faster data onto the AMS time base.
- PercentTimeMSOpen = ParVal(85)
- SampledTime = InfoVal(1)
- SecsInPToF = ParVal(1)
- SecsInMS = ParVal(2)
- FractionBuffersSavedMSOpen = InfoVal(11)
- FractionBuffersSavedMSClosed = InfoVal(22)
- DutyCycleMS = ParVal(80) * (InfoVal(4) or nan for older DAQs)
- DutyCyclePToF = ParVal(79) * (InfoVal(5) or nan for older DAQs)
- DutyCycleBFSP = ParVal(81)* (InfoVal(6) or nan for older DAQs)
- DutyCycleGenAlt = InfoVal(7) or nan for older DAQs
- FastModeAvgTimeSec = ParVal(193)
- nSecMSsamplingInterval = ParVal(15)
- How do I load in a parameter that was saved in the DAQ hdf files but wasn't loaded automatically into squirrel?
To generate a time series wave of a DAQ parameter one can use the built in command sq_getNewDiagValuesList in the SQ_AMSpanel ipf. For example, to generate a time series wave of every run in the todo wave called all for parameters 2 and 4 in ParVal data set one would execute the following in the command line:
squirrel_fetch(all,sq_getNewDiagValuesList,"dataFolderStr:diagnostics;colList:2/4;destList:ParVal2/parVal4","ParVal;")
The resulting waves would be named ParVal2 and ParVal4 and would reside in the diagnostics data folder.
- In the diagnostics plot, there are several step functions in 'm/z cal peak position'. What is this 'm/z cal peak position'? What may cause such changes?
This is almost always nothing to worry about. On the contrary, it would be very odd to have these traces be constant for > 6 hours, say. The DAQ can only resolve the center peak position to integer values in ns space. But we know that it should typically drift continuously, so step changes or 'stuttering' between two values is fine. It is only when you see big step changes (>3 ns, or point values) or other serious fluctuations is when you should start to become suspicious. In general the DAQ does a very good job of tracking the individual peaks chosen by the user (typically N2, a Tungsten, and a 3rd peak). If things go really wrong, typically you will see other, more glaring symptoms (step changes in all stick values including 28, etc)
- I want to add newly acquired DAQ hdf files to my experiment - is this ok?
Yes, squirrel was designed to allow experiments to grow, as would be the case where one is acquiring ambient data for several days. At the Get Index step the folder and all subsequent folders are searched for DAQ hdfs; the search is recursive. If one adds new/more DAQ hdfs to the selected folder and subsequently presses the Get index button, the code will find these new files. When one is copying newly acquired DAQ hdf files from the AMS's computer, one should not copy the very last hdf. This is because (1) the DAQ may need access to that file to write more data and one doesn't want to possibly supersede DAQ commands and (2) Squirrel may get confused about runs in the file if more runs or more data from a run is added.
- What's the m/z duty cycle checkbox?
This is a multiplicative factor applied to stick data (integrated raw spectra, UMR or HR) to account for the different speed of different masses from fragments. The default is sqrt(28/mz). It is not applied to raw spectra.
- What can I do when my data set has duplicate run numbers?
This unfortunate circumstance can happen if the system has a hard crash and the DAQ reverts to an old run number. The best approach is to create a duplicate set of DAQ hdfs with the run numbers incremented so that the entire set of runs is monotonically increasing. Squirrel can handle jumps in run numbers just fine, but it cannot handle duplicates or a non monotonic series. Use this this ipf to help you perform this operation.
Working with MS data
- What is the difference between the options 'Update' and "Do Nothing" in the Plot menu in the MS tab?
For most types of plots there is no difference. For average MS plots where the user has selected to use the Graph controls, then care needs to be taken regarding the UMR sticks, which are traditionally plotted as 'stack to next'. The legend and the top most controls displayed in average UMR mass spectra plots will be recalculated and updated when the 'Update' option is selected. The 'Do Nothing' option means just that; no graphs are touched.
- When generating an average mass spectra what does the 'Truncate sticks to 0' checkbox do?
Traditionally one plots average mass spectra of different species on the same graph as stacked sticks. That is, the value of one species is shown above the value of the previously plotted species. But this type of graph only works when all entries are greater than zero. When the 'Truncate sticks to 0' checkbox is checked the negative values in individual species waves (such as mssd_todowave_org) are set to 0, immediately before this wave is plotted but after the sum is calculated. If one find the sum of this wave, you do not get the same value as indicated in the legend because you are only adding all the values > 0, because all the values < 0 have been replaced with zeros.
- When generating an average mass spectra, why doesn't the sum of the Org sticks in the graph equal to the Org value in the legend?
The difference is that the stick waves in the graph are *nitrate equivalent* so that they are using an RIE and CE of 1 for all species. The values in the legend reflect values where the *species RIE and CE have been applied* (is not nitrate equivalent). The legend indicates the total average species concentration, such as Org, for that todo wave. So if you compare this number with the number you would get by averaging the time series wave of Org for this todo wave, you should get the same result. Note that squirrel provides a time-weighted result, so that if you had one run of 10 second duration and another run of 60 second duration the second run would be weighted by 6.
- When generating an average raw mass spectra why does it appear as if the m/z duty cycle was applied?
When one retrieves a raw spectra (or an average from a todo wave via the MS tab, Average Mass Spectrum Raw vs iTOF or raw vs m/z, a correction is applied to conserve area under the curves. This correction is the first derivative, dt/dmz, and this does have a power term so it behaves very similarly to the duty cycle correction. Within the code this term is defined as dtdmz_tmp=mzpower[p1]*(mzslope[p1]^(1/mzpower[p1]))*((p-mzint[p1])^(1-(1/mzpower[p1]))) where p1 is the row number of the run in question. (You can search for this line in the code yourself if you like.) The reason for this term is to allow users to do integrations 'properly' on the raw spectra and to allow for a more intuitive unit of Hz/samplingtime. When squirrel recalculates sticks it does not use the results of the average raw spectra as generated from the MS tab; the order of operations in which the m/z duty cycle is accounted for is different.
- Is there an easy way to compare values found in V and W modes?
There are a few options. If one was alternating between V and W one could simply offset one time series Org wave, for example, by one point. Alternatively, one could use the 'Set interval' time base selection instead of the 'As saved'. For example, if you were taking 1 minute V mode, then 1 minute W mode, you could create an Org time series wave of V only using the AllV todo wave and a 2 minute time interval, and then another Org time series wave using the allW todo wave with the 2 minute time interval. You could then do correlations on these two org waves.
- How does the airbeam correction work if I run the AMS with v/w mode switching?
You need to choose only one airbeam region, one set of airbeam reference runs. If the AMS was operating in both modes during this region Squirrel will automatically calculate the airbeam average for the v mode only and the w mode only for these reference runs and then combine these to generate the aribeam correction factor. If you select a value from the ToF Type drop down box (in the corrections - airbeam tab) you can view the airbeam average for each of the modes.
- What happens if I want to change the ion efficiency value? If I trust the original air beam value, do I need to do the Airbeam correction?
Ion efficiency values are stored in waves called root:diagnostics:ionEff_logged and possibly root:diagnostics:ionEff.
Values in root:diagnostics:ionEff_logged are read from the parameter values stored in the DAQ; these values should have been entered into the system by the user after an ionization calibration.
As is true for any wave in the diagnostic folder, these values can be overwritten when one presses the button "Update Diagnostics" in the HDF index tab. Also, as is true for a few diagnostic waves, there can be a 'logged' = DAQ version, and a copy of this wave that may be modified by the user (without the '_logged' suffix).
For an airbeam correction and/or ionization calibration, there are 3 values that are interdependent: AB signal in Hz, flow rate, and the single ion value. Each of these values are run-number dependent (we have one value per run; they are waves, not constants for any Squirrel experiment).
We use the single ion value to convert from bits-ns to Hz to get our sticks, including the m/z 28 (=airbeam) stick. When we do an airbeam correction, our goal is to 'normalize' or 'calibrate' data that have been collected during a non-calibration period. Everyone should do an airbeam correction to their data before it is final. Often the airbeam correction factor is on the order of a few percent, but this correction can be reliable applied when it is a factor of 2, 3.
This correction is necessary because we know that the MCP degrades over time. We attempt to quantify this degradation by the assumption that the amount of N2 present in all samples is constant. The idea is to select a period (AB reference period) of ambient measurement close to a calibration where all values are known. The idea is then to use the ratio of the /z 28 signal of the reference period to all other periods as our correction factor. After the ratio has been calculated, we presume all fluctuations in N2, regardless of their origin, have been quantified. So to correctly apply this factor, one should hold the ionization efficiency value to be constant. Thus the AB correction code creates the wave root:diagnostics:ioneff and inserts a constant value (the ion eff during the reference period) for ALL runs. This ioneff wave (not ioneff_,logged) is subsequently used in all conversions to ug/m3, regardless of whether the 'Use MS AB correction' checkbox is checked. So to be consistent, one should always use the AB correction once it has been found.
- What is the Flowrate offset(cc/s) value in the Corrections - Airbeam tab?
This is an additive offset to the flowrate called airbeam_ref_flowOffset_sv in the code. In theory when the flow rate would extrapolate to zero when the airbeam values are zero, but often times it is not. If you plot flow rate vs airbeam you would get a slope and the intercept (Y axis is flow rate) would be this flowrate offset.
It is used in the following way if the Correct AB for flowrate is used (which should be the case for final data): corr_fact_flow=(flowrate+airbeam_ref_flowOffset_sv)/(airbeam_ref_flow_sv+airbeam_ref_flowOffset_sv) and then corr_fact *= corr_fact_flow
where airbeam_ref_flow_sv is the average flow rate for the AB reference period and flowrate is the time dependent wave.
You can think of corr_fact_flow as a time dependent wave, similar to the corr_fact, that is 1 near the reference period and a fraction of 1 elsewhere.
More details can be found in the Field Data Analysis Guide here.
- When generating an average raw mass spectra, why are both 'As Saved' and 'Regrid' checked by default for the m/z base? And what does regrid mean if it doesn't mean using a defined grid as specified in the checkbox below that?
In general, averaging raw (non-stick) spectra is confusing because each run has it's own unique mapping from iToF space to the m/z space. When one wants to generate an average raw spectra, one has to be careful to handle these different mappings. When "As Saved" and "Regrid" is checked and one is generating a raw average mass spec, the m/z base of the first run in the todo wave is used as the x-axis and all other runs are regridded (using a fancy non-linear interpolation) to this one base. If regrid is not checked, it assumes that all other runs in the todo wave have the identical x-axis mapping and a point by point averaging is done. If one doesn't want to use the x-axis mapping of the first run (the first run of the todo wave is arbitrary - we could have also used the last run in a todo wave, i.e.) one can decide what x-axis values to map all raw spectra onto. This is the regrid option checked with the second radio button checked. This option would be useful for one to compare two completely different raw spectra, but don't want to have to fix either to some artibrary x-mapping. One could get a raw open spectra obtained at noon and 6pm, and be able to compare two raw spectra with completely different x-mapping.
- How do I generate the waves needed for a PMF analysis?
Use the button in the MS tab labelled 'Calc UMR 2d matrix (not plotted, no RIE)'.It is important to know that the RIE and CE are *NOT* applied to the Org and Org error matrix if you choose unit so ug/m3. The general convention is that whenever Squirrel or Pika outputs anything with an m/z dimension the units are NO3-equivalent. The thinking behind this convention is that whenever we have an m/z dimension, such as with an average mass spectra, we want to be able to sum the unit resolution sticks to get back to the unspeciated signal an any nominal mass. The code will also generate a minimum error time series wave typically needed for input into PMF.
- How are the diurnal values generated? Does the graphs show values from the beginning or end of the hour?
The diurnal calculations group measurements into (x):00 to (x+1):00 bins, so from 7am to 8am. The time stamps for individual runs is the end of the measurement, and we don't do any fancy averaging for runs that partially overlap x:00 cutoffs. So for example if you have a 5 minute run with a time stamp of 7:02am, that measurement gets put into the 7am group, and a partial fraction of it going into the 6-7am bin and the other going to the 7-8am bin.
We also don't filter for a minimum number of runs per hour bin. You could have 100 measurements in the 7-8am bin and 2 measurements in the 8-9am bin and the code wouldn't necessarily alert you to the lopsided number of points in each bin. The number of points in each bin can be found in the wave root:panel:diurnals:DiurnalCounter
The very first hour bin accumulates data with a time stamp from 0:00 to 0:59:59.5 (time stamps are rounded to the nearest integer). The plots that are displayed use the wave root:panel:diurnals:DiurnalCounter which has values from 1 to 24 so the plots x axis show the data at the end of that hour's accumulation.
- When might the use of separate open and closed m/z calibration parameters be needed?
The use of separate m/z calibration parameters for UMR data is irrelevant. Early on in the development of Pika it was noticed that in rare cases the m/z calibration seemed different between open and closed spectra. This behavior was only seen for aircraft measurements (the same instrument on the ground did not display this behavior), and was only seen upon close examination of peaks, as in the Pika fitting graph. A physical explanation was never determined (to my knowledge). But the behavior was measurable enough such that different parameters for open and closed spectra was needed. Performing an m/z cal on open spectra is not ideal as there are so few isolated peaks to begin with, and the changing aerosol signal can mean that different peaks will appear/disappear throughout the measurements. So Pika users of this feature should proceed with caution, as the Pika fits rely so heavily on the mz parameters.
One declares open or closed m/z parameters in the mz calibration panel. Select to fit the open (or closed) spectra in step 1, fit in step 3 and declare in step 6. In Pika Step 4 and 5 one can elect to use these separate parameters or not via checkbox checkbox 4iii. When not checked, the code will use the last calculated m/z calibration values. To determine if separate open/closed mz cal parameters are needed one should examine isolated ions in the Pika graph window and see a characteristic sharp up-down or down-up pattern in the raw spectra (black dots) across several mzs, when checkbox 4iii is unchecked.
Note that the Pika graph still displays 'fits' in the open - closed spectra section, even though the red y axis legend says "NOT FITTED". For display purposes the raw open - closed spectra black dots are shown and the open m/z cal parameters are used for display of the difference spectra. There is no mapping of the closed spectra on to the open m/z x axis points. Shown difference 'fits' in red are simply for display purposes.
Working with PToF data
- What is the PToF normalization factor?
The PToF normalization factor is a scalar used to multiply PToF size distributions (typically) so that the total mass (i.e, Org) calculated by integrating over the size bins, is equivalent to the Org mass as seen by the MS runs for the same todo wave. Suppose you take an average mass spectra and get 10 ugm3 for Org for todo wave MyTodoWave. Suppose we get a PToF size distribution for Org, and it's total Org signal is 8 (to get to total signal you have to be careful to get the x-axis binning correct). Then the normalization factor would simply multiply the entire PToF size distribution spectra for Org by 10/8, so that the sum of PToF data over all size bins is now 10.
- What is the GP/PP boundary?
The term GP/PP refers to the gas phase and particle phase boundary. When scaling PToF data to MS data users may enter an estimated Dva size for which PToF data will be calculated to be zero. This estimate value is only used for the integration of PToF data across the PToF dimension.
- What would I use the max m/z (0 = default) parameter?
PToF data at larger mzs is often simply noise. When comparing MS to PToF it is helpful to limit noise from these higher m/zs. It can also slightly speed up calculations as less data is transferred from intermediate files to memory (for PToF data).
Working with ePToF data
ePToF data, or 'efficient' or 'encoded' PToF data, is acquired with a chopper that has multiple slits in the wheel, corresponding to approximately half open, half closed. ePToF acquisition has been available since approximately 2013. Previous AMS Users Meetings have included talks describing it's acquisition and sample data, including 2013: John Jayne, 2015:Pedro Campuzano-Jost, Leah Williams, and Peter DeCarlo, 2016: Joel Kimmel, Leah Williams.
In 2017, at the Beijing AMS User's meeting Donna Sueper was scheduled to give a talk regarding the analysis tools in Squirrel for ePToF data. Due to time constraints the presentation was not given, but is linked here for future reference.
It is not currently possible to perform High Resolution (HR) analysis on ePToF data, because this would entail performing HR peak fitting on each of 254 ePToF bins for each run and then performing the ePToF deconvolution. This is very computer intensive and time consuming analysis, and the HR peak fitting is likely not ideal due to higher signal to noise raw spectra. If you feel as if you have a small data set for which this would be a fruitful endeavor, please email Donna Sueper at donna(at)aerodyne.com
The Frag and Batch Table
- What is the frag and batch table?
The frag table consists of several text waves that apportion the m/z signals to different species. Some general background information can be found here. The batch table is a set of waves that assigns frag waves or frag table entries to aerosol species. The batch table also contains relative ion efficiency (RIE) information. There is an identical analog to the Pika frag and batch table, with many waves having the HR_ prefix attached.
- How do I make a time-dependent entry in a frag wave?
All you need to do is enter in the name of the wave in the frag wave. Be sure that the wave is in the root folder and any mapping to get the data onto the ams time base has already been done. If there is a nan in the wave, the resulting frag value will be nan. It is always a good idea to first test this feature and syntax using a dummy wave that has a constant value in it. For example at m/z 44 in the frag_CO2 wave the default entry is this 0.00037*1.36*1.28*1.14*frag_air[28]. If you have a wave called myCO2 with the gas phase CO2 amounts in it (being careful of units) you could change the entry to a time-dependent frag entry to look like myCO2*1.36*1.28*1.14*frag_air[28]. Lastly, the time dependent wave must appear first or second in the frag wave entry. So myCO2*1.36*1.28*1.14*frag_air[28] and 0.9*myCO2*1.36*1.28*1.14*frag_air[28] would work correctly, but 1.36*1.28*1.14*frag_air[28]*myCO2 would not. The placement for a time dependent frag wave is similar for the HR frag entries.
- How do I make a species-specific time-dependent correction?
In the batch table there is a text wave on the far right that is by default blank (empty strings) called speccorr_list (species correction factor list). In this list one can enter the name of a wave residing in the root folder that you would use as a multiplicative species correction. Below I outline how one can create and apply such a wave. In this example I create a species specific correction for the organic species - this is for illustrative purposes only - to demonstrate functionality - it does not reflect what one should actually do for any particular species.
(1) First I make a wave that consists of all ones. Later I will put different values in this wave, values that starts at 1 and then vary between 0 and 2. I plot this graph to see that it is a constant value. make/o/n=(numpnts(root:index:t_series)) myOrgCorr = 1; display myOrgCorr // 1 + sin(p/100) // this is what I will use later
(2) In the batch table, in the row corresponding to organics and the column titled speccorr_list, I enter the text 'myOrgcorr' (without the quotes - this needs to be the name of a wave that lives in the root folder and has the same number of points as the time series wave).
(3) Now to demonstrate I create an Org time series wave where this new species correction factor wave has a constant value of 1 (which is the same effect of multiplying by 1, or no effect) and another Org time series wave that changes from the original one where this species specific correction varies between 0 and 2. (3a) I go to the MS tab in squirrel, the time series section, and enter Org as a species, create a new graph, select the all (or allV, etc) todo wave, and press the gold calculate button. I should get an Org time series trace that is familiar. (3b) Now I go to the history window and enter the following make/o/n=(numpnts(root:index:t_series)) myOrgCorr = 1 + sin(p/100) I notice in my plot of myOrgCorr I see something that looks like a sine wave, with values varying between 0 and 2. (3c) In the MS tab in squirrel, the time series section and change the display option to "Append to graph" and check the checkbox "Ask for wave name suffix". Press the gold Calculate button again and give the wave a suffix name such as "spCorr". You should be able to see the two different Org traces, one with the (arbitrary) species correction wave factor multiplied by this sine wave.
- How does Squirrel handle PAHs?
PAHs are poly aromatic hydrocarbons, a subset of the organic species in squirrel. For most ambient measurements these values are too low to be interesting. However, for very polluted regions there may be interest in quantifying PAHs. In squirrel there are two frag waves that deal with PAHs: frag_PAH and frag_OrgLessPAH. These frag waves were generated from work done by Dzepina et al, International Journal of Mass Spectrometry, 263(2-3), 152-170, 2007. Beginning at m/z 198, estimates of PAH are indicated in frag_PAH and subtracted in frag_OrgLessPAH. If users are interested in examining the PAH organic component, then one must manually enter and execute this one lines of code:
root:frag:frag_organic[197,]=root:frag:frag_orgLessPAH[p]
This line will then change the definition of organic to be all organic less the PAH values. To change the definition of organic to be organic including PAH one can enter this line of code:
root:frag:frag_organic[197,]=num2str(p+1)
By alternating the values in the frag_organic wave between these two sets of values for m/zs >=198, a user can change whether organic = all organic including PAHs, or whether organic = organics less than PAHs and have PAH as a separate species. This unfortunate, possibly confusing situation is due to the recursive nature of the frag waves. If there is interest, email Donna Sueper to lobby for buttons in the frag panel that does performs these two lines automatically.
- How does the 'Time Base Selection' work ?
When users want to average their data over a different time periods than when the data was acquired, squirrel can average the runs in a 'smart' way be weighing the relative amounts of time spent in each run compared to the amount of time in the new time bins. For example 25 second runs can be averaged over time spans of 1 minute without user calculations about how much time in each run was spent in each minute.
Composition Dependent Collection Efficiency (CDCE Panel)
As of Squirrel version 1.52 a panel exists to assist users with determining the collection efficiency (CE). A formulation for the chemical dependency on the collection efficiency for ambient data is detailed in Middlebrook et al. Aerosol Science and Technology, DOI:10.1080/02786826.2011.620041, 46, 258–271, 2012. There is a direct analog for the high resolution (Pika) code.
Pressing the gold "Step 1. Calc. aerosol TS with CE=1 for current todo wave" will result in generating the time series of the 5 main aerosol species with a collection efficiency of 1 and putting the results in root:CE:. These aerosol time series values calculated using the airbeam correction factor, the RIEs for different species in the batch table, the species corrections for each (if they exist), and for a CE of 1 (ignoring CEs in the batch table). The flow chart below indicates the nature of the corrections.

If the user chooses to correct for relative humidity, it is imperative that the RH values reflect the at the AMS sampling inlet AFTER the dryer and at the temperature of the aerodynamic lens, *not the ambient relative humidity outside* or some other value. The code will not execute if the user requests to use a relative humidity wave that has nans in it. It is left to the user to interpolate the relative humidity wave as appropriate; recall that any relative humidity value less than 80 (or the user defined inflection point) will have not effect on the CDCE.
The final time series wave of the CDCE is called CE_fphase and resides in the root data folder. To use this time dependent CE wave automatically in mass loading calculations enter the string CE_fphase in the CE wave column in the batch table.
Users may wish to use HR NH4 time series values, if available, because these values are much less noisy than the UMR NH4 values. To do so, simply replace values in root:CE:NH4_CE1 (generated after step 1) with the HRNH4 time series wave calculated with a CE of 1. Then proceed with the rest of the steps in the CDCE panel as usual.
For advanced users only, a small panel for setting different inflection points for the different corrections is available.
The wave note for wave root:CE_fphase retains the setting used to generate its values (i.e. minimum NH4 values to consider in calculations, smoothing parameters, etc.).
The decision as to whether to use the time-dependent wave root:CE_fphase (by entering CE_fphase in the CEWave_list in the batch table and entering 1 in the CEfac_list) or to use a constant value (entering values in the CEFac_list in the batch table) is left to the user.
Exporting Results to the AMS Unit Mass Resolution Database
- The AMS Unit Mass Resolution Spectral Databaseis a resource for all AMS users (Quad, CToF HRToF). Submission to this database requires the creation of a spectral file in Igor Text format (*.itx).
An AMS Database Export Tool has been created to assist users of Squirrel for creating these files. A button in the average mass spectra section (MS tab) in Squirrel version 1.49 presents users with a panel to select the todo wave from which to average and input several metadata values. Once this file has been created, users can submit this file via email to Michael.Lechner 'at' colorado.edu.
If using the UMR (Unit Mass Resolution) option in this tool, the average difference spectra of unit resolution sticks ('squirrel' sticks) is calculated in the following manner: (1) data is converted to ug/m3 (2) The AB correction factor has been applied (3) Data is not normalized (so that the sum of the spectra is 1) and (4) The spectra is trimmed or extended to correspond to the maximum value set by the user (default is 300 m/z for unit mass resolution).
Users are strongly encouraged to create a supplemental file containing closed stick spectra, raw (unsticked) closed and difference spectra and an associated m/z wave, and the InfoVal, ParVal and ComParVal settings for the first run in the selected todo wave. These supplemental files have the same file name as the difference stick spectra, with an additional "_supp" in the file name.
Pika (ToF_AMS High Resolution Analysis software)
Pika General FAQ
- Why Pika?
The high resolution aerosol mass spectrometer (HR-ToF-AMS) allows for measurement of chemical componenets within aerosols. A software tool was needed for the speciation and quantification of HR-ToF-AMS data and Pika was born. Its development has been lead by the Jimenez Group at the University of Colorado, Boulder. Like Squirrel, it is free and is covered by the GNU's General Public License, which means we want to keep it free and give all users the freedom to improve and redistribute the software.
- What is Pika?
PIKA (Peak Integration by Key Analysis) is a software tool for Igor built upon SQUIRREL. It is based upon the algorithm by Peter DeCarlo and others detailed in DeCarlo P.F., J.R. Kimmel, A. Trimborn, M.J. Northway, J.T. Jayne, A.C. Aiken, M. Gonin, K. Fuhrer, T. Horvath, K. Docherty, D.R. Worsnop, and J.L. Jimenez, Field-Deployable, High-Resolution, Time-of-Flight Aerosol Mass Spectrometer, Analytical Chemistry, 78: 8281-8289, 2006. Pika is a cute mammal that lives in the Rocky Mountains. See a video clip here.
Pika Technical FAQ
Setting up Pika
- How do I turn a Squirrel experiment into a Pika experiment?
This is generally not recommended. One can always begin an analysis with a pika template - one never has to use the pika panel if it is not needed.
- How do I update a Pika experiment?
It is recommended that you use the UpdateSQPKVersion ipf downloadable from the squirrel and pika software download page. The basic steps involve (1) killing all the ipfs with a sq_* tw_* or pk_* prefix (2) killing the main squirrel and pika panels (you may want to kill auxillary panels such as the mz calibration panel, baseline panel, etc) (3) loading in all the new ipfs and (4) recreating the main squirrel and pika panels through the AMS top-most menu.
- The HR_PeakHeights graph (or other graph) is too small on my Macintosh system and it won't let me resize it - what do I do?
Many graphs and panels are a fixed sized because sometimes resizing them can cause them to update incorrectly. However, the HR_PeakHeights graph can safely be resized. To enable resizing, select the graph, then go to the top Igor Graph menu, select Modify graph, and select "Auto" instead of "Absolute" in the drop down menus for both the Width mode and the Height mode.
- Can I do a high resolution analysis on C-mode data?
It is currently not recommended to do a fully HR analysis on C-mode data, but under certain conditions some information about separated peaks may be useful. Th easiest way to do a high resolution analysis on C-mode data is to overwrite the variables from values indicating C-mode to V-mode. Specifically execute from the command line these lines any time after the Get Index step:
root:diagnostics:TofTypeVKey=1; root:diagnostics:TofType=1; root:diagnostics:VWSwitching=0; root:diagnostics:isV=1
Pika will then treat the data as if it were V-mode and the peak width, peak shape, etc steps will work.
HR Species and Families
- How do I generate a new HR species?
Every HR species has to be prefixed with the letters 'HR'. This is because pika has to understand the difference between an HR species (whereby it needs to look at the list of family inclusions and any HR frag wave modifications and between an HR ion such as CHO. So for example when one wants a time series of HR results the first thing pika has to do is figure out what kind of result it is - an HR ion, a family or an HR ion.
Also, the pika code requires that the HR_specFrag_list entry be not blank. If your new species doesn't require any estimate of HR ions that you didn't fit or HR ions like H2O that need to be parsed into several species, the HR frag wave can be blank, as is done for HR_frag_chloride or HR_frag_ammonia.
An HR species is defined by two parameters: the list of families, if any, that comprise it, and any HR ion parsing and assigning that is done by the associated HR frag wave. Entries in the HR frag wave take precedence over inclusion or exclusion based on family designation.
- How do I generate a new HR family?
There are two methods for generating a new family. Both methods involve adding a new row to the HR_familyTable. A new row must contain the name of the family, such as Cx, and the method for identifying the family members. One can identify a family by using a semicolon separated list the ions such as done for Tungsten, i.e. "j182Wplus2;j184Wplus2;j186Wplus2;W;WO". Another method for identifying family members is to generate a text wave in the HR folder with the name familyWave_* such as make/t/o root:HR:FamilyWave_APAH={"C16H11N","C18H13NO","C20H13N","C21H13N"}. One can then make an APAH family by entering familyWave_APAH in the column of the family table entitled HR_FamilyListDefinition.
One cannot remove the default list of existing families, Cx, CH, etc, but one can generate a new family by simply listing the HR ions as is done for the Tungsten family. There is no limit to the number of HR ions one can have in a family, and it doesn't matter if any or all of the HR ions in the family are fit. An HR ion will be a member of one and only one family. The HR frag table can be used to parse a HR ion like H2O into different families. An ion's HR family determination is made at the time the HR ions are chosen to fit (the gold button in the HR Ion Group tab). If you do not want to add or remove any HR ions from the fit, and simply want to reassign HR ions to different families, just press the gold button every time an HR family definition has changed.
- How does HROrg work if I choose to remove familyCx from the list of families for HROrg?
As mentioned above, an HR species is defined by the list of families and it's associated HR frag wave. If a user chooses to remove familyCx (or any other family from the default list of families for HROrg) then no HR ions in the family Cx will be associated with HROrg. If a user subsequently generates the 5-axis aerosol species, the contribution to HROrg of family Cx will be zero.
- How does HR_specFamilyExceptions column in the HR Batch Table work?
If there is any HR ion that a user wishes to not include in the definition of an HR species, this ion can be listed in the HR_specFamilyExceptions wave. The way this works is that the code will first generate a list of all HR ions from the families listed in the HR_specFamilyBase column and will then remove any HR ions in the HR_specFamilyExceptions wave. Then any manipulations that are done within the HR frag table are performed. For example, in the HROrg species the entry in the HR_specFamilyExceptions wave changed to be C8H5O3;C16H23O4; these are the HR ions for the 149 and 279 pthalates. These are removed because we believe these HR ions are instrumental artifacts due to lubricants. If one wanted to remove CO2 from HROrg, then one would have to change the default entry in HR_frag_organic to be 0* the current entry, and not by entry in the HR_specFamilyExceptions. Whatever is in the HR frag table 'trumps' any inclusion/exclusion; it is the last thing that gets applied when defining an HR species.
- I am using the HR species and generated a HRMxD_HROrg matrix, but the number of columns in this matrix (which corresponds to the number of HR ions considered) is larger than expected. What is going on?
When we include other HR ions that were not fit we will have a larger matrix. For example, if 430 HR ions were chosen to fit, and one got an HRMxD_HROrg matrix with 433 columns, then 3 ions were not fit but were included in HROrg (i.e. j13CO). To line up the columns with their appropriate HR ion, you need to use the species waves that live in the HR_frag data folder. Specifically, go to root:HR_frag:SpeciesMassText and root:HR_frag:SpeciesMassWave. The wave root:HR_frag:SpeciesFamilyText copies which family an HR ion that was fit was grouped into, and is created only as a convenience.
- I have some sulfate salts XSO, XSO2, XSO3 that keep getting put in the SO family. How do I prevent this from happening?
You will want to create a new family that contains these ions. Follow the example of the Tungsten family where the list of HR ions is given. It is ok if an ion in the list is not chosen to fit, but it must exist in the All HR ions table (in the HR Ion Groups tab). The code for associating an HR ion with a family first searches the list of explicitly identified families. Then if an ion is not found in any of these lists, it will assign it to a family based on the chemical formula.
Issues with specific HR ions
- How should I think about mz29, Org29 and the j15NN ion? OR I am getting a negative value for my HROrg at mz 29. What is going on and how can I fix it?
The signal at m/z 29 is a combination of signal from air due to 15NN, and organics such as 13CO, CHO, and C2H5.
In the UMR case, it is standard procedure to check Org at 29 and modify the standard frag table of frag_air[29] from the default of 0.00736*frag_air[28]. The default entry for frag_organic[29] = 29,-frag_air[29]; a small fraction of the mz28 signal (N2) should exist at mz29 (15NN) and the rest of the signal at mz 29 is attributed to organic. Because of individual instrumental settings and tunings, this default value of 0.00736 may not accurately reflect the amount of 15NN detected. Users are to change the 0.00736*frag_air[28] entry such that (1) for filter periods Org29 is ~ 0 and/or the intercept of Org29 vs Org43 is at the origin.
In the HR case a similar method is needed to apportion the air from the organic aerosol. One approach to estimate CHO and 15NN contributions would be to generate a fit for the combined 15NN and CHO peak and apportion the combined CHO-and-j15NN signal into 15NN and CHO in the HR frag table. This would provide a direct analog to the UMR method. However, this option is less ideal because at mz 30 the NO and 13CHO peaks typically overlap. We can get a better estimate of NO if we have a good estimate of 13CHO and this happens if we have a good estimate of CHO. By determining the fraction of j15NN we expect from N2 ahead of an HR fitting step, we can ensure that all isotopes of CHO are correctly accounted for in higher nominal masses.
- At m/z 28 I chose to not fit C2H4 because it is too noisy in the tail of N2. However, I do want to estimate C2H4 for inclusion of my elemental analysis (EA) How can I do this?
One can add the C2H4 HR ion in the HR frag table. The HR frag table requires that the listed HR ions appear in increasing mass order, so the C2H4 ion would appear as a row after CO. Then in HR_frag_organic one can enter a value such as "0.5*{C2H3},0.5*{C2H5}", which would estimate C2H4 as the average of two similar HR ions C2H3 and C2H5. This formulation assumes that the user fit C2H3 and C2H5 and the user should check that this formulation is appropriate. This method for estimating an HR ion is similar to several formulations in the squirrel (unit resolution) frag table for some organic m/zs.
- How are the isotopic values in the master list of all ions calculated?
The values in the isotopic column indicate the amount of that isotopic ion one should see *as a fraction of it's parent*. In a 2000 -era document of chemical masses the abundance of C is 0.9893 and that of 13C is 0.0107. To get the amount of j13C we should get as a fraction of C is 0.0107/.9893 = 0.0108157 which is the value in the table. If we have multiple carbons in an ion, such as C2j13CH9 we need to account for the probability that one (out of several) carbons is an isotope.
- When I add the isotopic metal j54Fe (with a parent Fe at 56 and an isotopic abundance of 0.0637029 I get an error about the order of masses to fit. Why is this and what can be done?
The first thing the pika code does, before it generates any HR sticks, is figure out the order of masses to fit. All integer m/zs that have no isotopes are fit first, and then m/zs with isotopes are fit next. For almost all mz/s over approx. 50 there are organic isotopes, and the mz has to fit before mz+1 because the CR fragment has to fit before the j13CR fragment. The way to get around this is to not constrain j54 Fe. It is quite isolated so this shouldn't be a problem.
There are a few other elements for which the isotope has a smaller mz than the parent: Ar, Cr, Ti, V, Kr, W, Hg and Pb. In these cases there just isn't a workaround - some isotope, either the isotope of an organic or these elements will have to NOT be constrained.
- I'd like more details about the 'There is a problem resolving the mass order..' error that I get. What is going on?
The function for figuring out the order of mzs to fit is iterative. The name of the function is HR_SortIsotopicValues(). The code compiles a string list which contains the order of all the mzs which to be fit. The string gets appended with each iteration. This string will later be made into a wave called root:HR_Sticks:MassFitOrder which will be the sequence of mzs that are fit. The first set of mzs that are fit are those for which no isotope is fit.
To demonstrate, I added a print statement in this function at this place:
   do     // while numToCheck>0 or we are at a stalemate
       numToCheck=ItemsInList(MassToCheckList)
       bad2goodindexList=""
       print massDoneList        // added for demonstration of order of mzs to fit
I used the default list of ions to fit, and to prevent lots of long lines from printing to history, I set all ions to fit past 90 to 0 via the command
root:HR:mask_stick_integration[650,]=0
So the max HRion I fit will be < mz90. Then I press the Check iso. parents button in the HR Ion Groups tab. When I do this I get the series of lines in my history:
12;21;22;23;24;28;35;48;
12;21;22;23;24;28;35;48;13;25;29;49;
12;21;22;23;24;28;35;48;13;25;29;49;14;26;30;50;
12;21;22;23;24;28;35;48;13;25;29;49;14;26;30;50;15;27;31;32;51;
etc...
12;21;22;23;24;28;35;48;13;25;29;49;14;26;30;50;15;27;31;32;51;16;33;34;52;17;36;53;18;37;54;19;20;38;55;39;56;40;57;41;58;42;59;43;60;44;61;45;62;46;63;47;64;65;66;67;68;69;70;71;72;73;74;75;76;77;78;79;80;81;82;83;84;85;86;87;88;89;
The first line
12;21;22;23;24;28;35;48;
is the list of all mzs for which no isotopes were fit. There are 8 mzs that fit this criteria. Next the code searches through every mz not in this list of 8 for which if an isotope is fit, the parent isotope is also fit. This adds 4 more mzs:
13;25;29;49; 13 works because the only isotope at that mz has a parent at 12 (j13C's parent is at 12), which is in my list of 8. Ditto for 25, 29, 49 (j13CC, j15NN, j13CC3). Now I have 12 mzs that are fit: 12;21;22;23;24;28;35;48;13;25;29;49. I go through the list of mzs not in the list and see if the isotope's parent are now fit. This adds 4 more mzs: 14;26;30;50. 14 now works because j13CH parent, CH, at 13 is now fit. And so on, until all mzs are accounted for. If there is one or more mzs which never made it to my list of mzs to fit, the code gives an error.
If I add j36Ar and j38Ar and constrain them this code generates an error:
There is a problem resolving the mass order in which todo (sic) the HR fits because of isotope parent conflicts with:
36;37;38;39;40;41;42;43;44;45;46;47; Aborting from HR_SortIsotopicValues.
The last print statement from this code gives me:
12;21;22;23;24;28;35;48;13;25;29;49;14;26;30;50;15;27;31;32;51;16;33;34;52;17;53;18;54;19;20;55;56;57;58;59;60;61;62;63;64;65;66;67;68;69;70;71;72;73;74;75;76;77;78;79;80;81;82;83;84;85;86;87;88;89;
which does not have the list of mzs stated in the abort statement.
This is because in order to fit 36, which includes j36Ar, I need to fit 40 (Ar). In order to fit 40 which includes j13CC2H3, I need to fit 39 (C3H3). To fit 39, which includes j13CC2H2, I need to fit 38 (C3H2). In order to fit 38 which includes j13CC2H, and j38Ar I need to fit 37 and 40 (C3H and Ar). And so it becomes an infinite loop. After you have done this exercise don't forget to comment out the added print statement to avoid cluttering your history window.
- What is a good resource for finding chemical formulas for ions at a nominal mass?
Go to http://www.chemcalc.org/ and then go to the MF Finder tab. Then enter the upper limits for the different atoms. Enter an exact mass or a mass range. Be sure to uncheck the "Allows only integer values" for insaturations.
- Somewhere in the code there is a place that identifies chemical elements for the mass calculator. Where can I find it and can I modify it?
The function is named PK_CreateElementWaves(). This code contains several commented out lines for rare HR ions, such as the isotopes of metals and fragments which are not typical. It is completely fine to de-comment any and all lines for these chemicals. The waves created by this code are used to determine mass values in the calculator, and are used as a tool, but not in the peak fitting. All masses given in the 'All HR ions table' in the HR Ion Groups tab are the ones used to do the pika fitting.
- I'm not sure I'm doing the checks in the HROrgCheck panel correctly. Can you help?
The HROrgCheck Panel focuses on the 2 major issues with HROrg that must be checked and verified for each instrument and tuning. These two issues are (1) determining the amount of the 15NN air fragment, and hence the CHO fragment and (2) determining the amount of the CO2 fragment that is air and the amount that is aerosol. The first issue is estimated via the UMR frag table correction. Once a Pika fit has been performed then this estimate can be fine-tuned and Pika refit again. The second issue is always performed after the HR fits have been completed. Because the CO2 ion is fit once (within the multipeak fitting pika tools) the task becomes how to apportion the CO2 ion fragment loadings between air and aerosol, and hence the user need not redo any pika fits. The last task within the HROrgCheck panel has to do with using corrections from issues (1) and (2) to correctly calculate H/C and O/C ratios. Users can refer to the presentation at the users meeting where this panel was first presented.
- I'm trying to generate elemental ratios and I get an error saying that there are more than 30 HR ions that seems suspicious. What is this about?
The way the EA code works is that it forces/assumes that calculations will be done on the species called HROrg. Users are allowed and encouraged to modify the definition of HROrg as is appropriate for their conditions. The EA code uses calibration factors for O/C H/C ratios as discussed in Aiken et al. Those recommended calibration factors were the best estimate for ambient data, but values for Lab data targeting individual compounds (non-ambient data) varied quite a bit. For lab studies for other aerosol sources with unusual signals these calibrations may not apply. As a crude indicator of non-ambient conditions, the code checks for the existence of nonstandard HR ions within the definition of HROrg. Nonstandard mean ions such as CH4Br, COP, etc., ions that have something that are composed partially what we might consider organic, i.e. CH and CO, but also have an atom of something that is NOT C, H, O, N, S, i.e. Br, P. There is an arbitrary cut off of 30 HR ions that would flag potential problems. If you want to remove this arbitrary cutoff, you may do so by doing a search in the ipfs for the text "The number of HR " and commenting out the abort statement with //. The code will proceed with the calculations. But you should be aware that the the resulting H/C etc may reflect the relative, not absolute ratios, so that plotting these values on a Van Krevlin graph may not be appropriate without caveats.
Pika Errors
- What is the difference between 'HROMinusCTotCountErr' and 'HROMinusCTotSigErr' and which should I use? The short answer is that you should use the *TotSigErr estimates, as these include signal error from adjacent peaks. *TotSigErr >= *TotCountErr and are equal for isolated HR ions. A document describing the methodology and the calculations for HR errors was created in May, 2014. As of Pika 1.17 the error data set HROMinusCTotCountErr will no longer be generated.
Why doesn't it do X?
- In HRResults tab I select the data set OMinusC and I get results. If I ask for the data set Diff, it gives me an error "The dataset HRDiffStick not found. Perhaps you need to fit HR sticks? Aborting from HR_butt_MS_Calc" I don't see any option to choose to calculate diff sticks in the HR Fits for Many Runs tab. What is going on?
When the gold button in step 5 "Calc HR sticks for all runs in todo wave" is pressed, by default the difference spectra is fit and HRDiffStick exists. The user should also typically have the "Find open and closed HR sticks also" checkbox checked. When this is checked HR fits for the open and closed spectra are also found, then at the end the OMinusC data set if calculated using the newly fit Open and Closed sticks. The only exception is if you have chosen to use different m/z parameters for open and closed spectra, then there isn't a good choice for what m/z parameters to use for the diff spectra, and hence the HR sticks for the diff spectra haven't been found.
- The main Pika HR ion peak fitting window is too small, and the controls on the left side are fully visible. What should I do?
You can resize this graph by going to the main menu named 'Graph' and selecting 'Modify Graph' and entering larger values for the width and height, such as 8 and 7 (or other values for non-inches units).
Exporting Results to the AMS High Resolution Database
- The AMS High Resolution Spectral Databaseis a resource for all AMS users. Submission to this database requires the creation of a spectral file in Igor Text format (*.itx).
An AMS Database Export Tool has been created to assist users of Pika for creating these files. A button in the average mass spectra section (HR Results tab) in Pika version 1.08 presents users with a panel to select the todo wave from which to average and input several metadata values. Once this file has been created, users can submit this file via email to Michael.Lechner 'at' colorado.edu.
Average High resolution spectra is calculated in the following manner: (0)'Open Minus Closed sticks = OMinusC' (pika sticks found by subtracting Open Pika sticks - Closed Pika sticks) is used unless the open and closed sticks have not been found. In this case the Diff sticks are used. (1) data is converted to ug/m3 (2) The AB correction factor has been applied, (3) Data is not normalized (the sum of the spectra is not1), and (4) The spectra is trimmed or extended to correspond to the maximum m/z value set by the user (default is 300 m/z for unit mass resolution). A copy of the HR spectra that has been summed to unit mass into family groupings will be also saved. The high resolution mass wave values and corresponding text waves and tag waves and family designaltion (ExactMassWave, ExactMassText, ExactMassTag, ExactMassFamilyText) are saved. For the HR data summed to unit resolution, all family waves (OMinusC_familyCH, etc. as well as a unit mass m/z wave, amu_HR), are saved.
When opening the itx file from an igor experiment the unit mass resolution spectra with data grouped into the family designations and the familyAir and familyOH spectra removed, is plotted.
Users are strongly encouraged to create a supplemental file containing average raw (unsticked) closed and difference spectra and an associated m/z wave, and the InfoVal, ParVal and ComParVal settings for the first run in the selected todo wave, peak width and peak shape parameters, and the HRfrag waves. The supplemental file has the same file name as the difference stick spectra, with an additional "_supp" in the file name.
Preparation for PMF
In Pika 1.09F and higher there is a handy checkbox that when checked will automatically generate an itx containing all the waves necessary for the PMF (with the exception of any data preparation steps such as the minimum error, Nan removal, etc.) It is important to know that the RIE and CE are *NOT* applied to the HROrg and HROrg error matrix if you choose unit so ug/m3. The general convention is that whenever Squirrel or Pika outputs anything with an m/z dimension the units are NO3-equivalent. By using nitrate equivalent mass, we are scaling all ions equally (i.e. not scaling differently according to which species each ion contributes to). This means that the mass spectra in ugm3 units are identical to those in Hz units except for a single scaling factor. The thinking behind this convention is that whenever we have an m/z dimension, such as with an average mass spectra, we can sum the unit resolution at any nominal mass to compare to the unspeciated signal.
HR PToF
In order to do HR PToF, the user must have saved the raw PToF data files. These are DAQ generated files with an '_p' suffix i(i.e 090831_044847_p.hdf) and are saved in the DAQ hdf PToF folder (not in the 'main' folder). Depending on your DAQ version the default may be to *not* save these files as they are large and are only useful if you recalculate your PToF sticks or do HR PToF. If you are unsure as to if these *_p files have been indexed, go to the Squirrel Misc tab and press the button 'HDF file Table (do not edit)'. This is a table of all the files that have been indexed and all the intermediate files, in the order they were indexed (or created). Note that you can use the baseline panel to view raw PToF spectra (the data in the _p files). The stick PToF data is saved in the _m files, so just because you have produced UMR PToF data, this doesn't indicate that the raw PToF spectra has been indexed.
In general it is assumed that the user has done a full HR MS analysis. Several settings are assumed to be the same for the same run numbers for MS as for PToF. Specifically, the m/z calibration, the HR peak width and peak shape are all carried over from the MS analysis. It is recommended that the choice of HR ions to fit is the same as for the MS data. If you have PToF runs without MS data, you may need to declare the peak width and peak shape for these PToF- only runs.
Users must upgrade to at least pika version 1.22.
Below are a series of links to some you tube videos demonstrating HR PToF analysis of a small data set. These videos do not exhaust the available features, but rather provide a visual guide for users new to these features.
Setting up a HR PToF matrix data set
HR PTOF Step 1. Creating PToF data sets
The first task is group the data into new PToF data 'bins'. Raw PToF spectra has >100 times less signal than MS data. Performing HR fits on noisy data can be problematic, hence it is advised to decrease noise by combining DAQ PTOF bins. The DC marker graph indicates the noise in UMR data, which will be less noisy than HR data.
Within the HR_PTOFDVaGraph users are to generate at least one single new PToF bin corresponding to either DC region 1 or region 2, and a new matrix that encompases DVa sizes that do not extend too far from your PToF size calibration limits (generally ~ 80 - 3000nm). The HR fits of the single bin will be subtracted from the matrix to mimic the DC marker subtraction done for UMR PToF data. In version 1.20 there is no option to isolate the air ions such as N, O, N2, O2, Ar, CO2 and only subtract DC region 2. All HR ions will have the single bin data subtracted from all HR ions. It is a common mistake for users to not acquire data at the highest PToF times; in this case generating the single PToF bin in region 1, after the air peak but before the smallest aerosol size, is appropriate. In this step, all that is happening is that raw PToF spectra is averaged in anticipation of HR peak fitting. Note that it is anticipated that The picture below shows that the user has generated 3 data sets. The dc1 data set will be used for later subtraction.
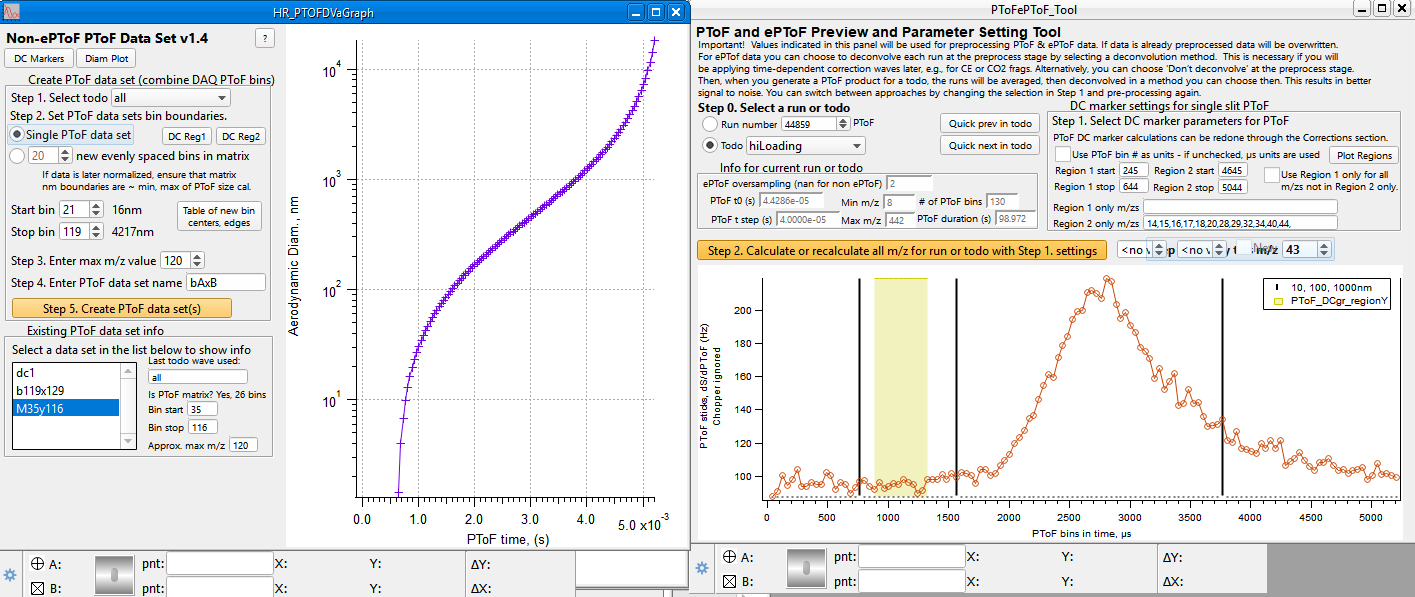
HR PTOF Step 2. Performing HR fits
Note that for the MS HR analysis step 2 (determining peak width and peak shape) and step 3 (choosing which HR ions to fit) should be determined for the MS data for the same runs; PToF data will use these same values for each run. An optional step is to perform an HR fitting for two sets of PToF data sets (Pika step 4). To perform HR fits on the raw PToF spectra, make sure that Pika step 4 the PToF radio button is selected (default is MS). A user may choose to fit many PToF data sets with one push of the HR - Step 5 "Calc HR sticks for all runs in todo wave" gold button by selecting PToF groups in the list box near Pika step 5B.
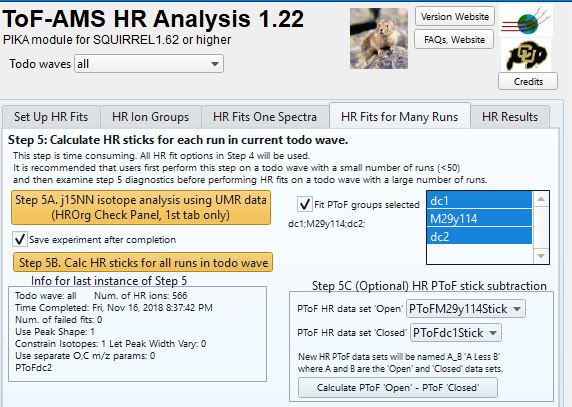
Step 3. Perform the HR version of the DC marker subtraction
The HR panel above also demonstrates an example of generating a background subtracted PToF HR sticks data set from HR fitted data sets. Recall that the PToF data requires an analog to the MS Closed, an estimate of the signal seen when aerosol is not in the system. For UMR data we perform this action in the DC marker graph, and use define regions in the PToF time dimension to determine these estimates. For the HR PToF data, we do not yet have quite the same infrastructure. Here all HR ions, whether they are gas phase ions, such as Argon or C3H4 at m/z 40 use the same DC marker region for subtraction. In the example above, the PToF raw spectra group identified as the DC marker region 1 (dc1) is subtracted from the matrix data set (M29y114). The difference matrix M29y114_dc1 contain the time series of the HR signal from aerosols within the size range determined by PToF bins 29-114 with an estimate of the background (PToF bins 20-28) subtracted.
Step 4. Generating size distribution, PToF image plots of HR PToF data.
The panel below shows an example of a the PToF size image plots of two HR ions C2H3O and C3H7 for the aerosol represented by the (original) size on PToF bins 29-114. Size distribution and image plots, and optional normalizing to the MS data features mimic features available for UMR PToF data.
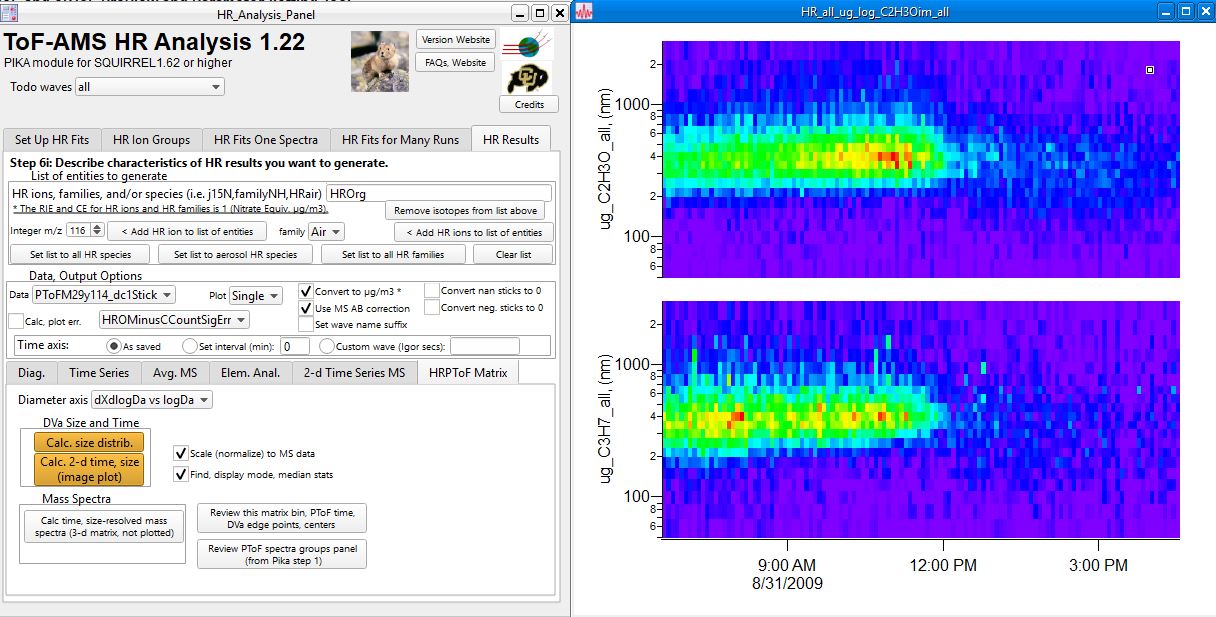
Apes (ToF-AMS High Resolution Elemental Analysis software)
Apes General FAQ
- Why Apes?
Apes (Analytic Procedure for Elemental Separation) is a software tool used to separate High resolution AMS ions to their elemental components. It uses the chemical formula of an HR ion and the HR ion mass value to sum, average, or ratio the amount of elements C, O, H, N, and S that are present in an AMS sample.
- What is Apes?
Apes is the name for the code that performs the elemental analysis calculations. In Pika version 1.07, this code is incorporated into the HR analysis section. This code is also a stand-alone ipf for use in situations where the squirrel and pika infrastructure is not needed (i.e. PMF HR spectra factor results).
An essential primer on the analysis method was given by Jose Jimenez at the 2008 AMS User's meeting in Manchester, UK. The pdf can be found at: http://cires.colorado.edu/jimenez-group/UsrMtgs/UsersMtg9/2008-09_AUM_Jose_Elemental.pdf The defaults for the elemental analysis code described below are appropriate for ambient data. Users should modify the settings as needed for laboratory or unusual ambient conditions.
This code is named APES (Analytic Procedure for Elemental Separation) and is based on the work done in A.C. Aiken, P.F. DeCarlo, and J.L. Jimenez, Analytical Chemistry, 79, 8350-8358, doi:10.1021/ac071150w, 2007 and Aiken, A.C., et al. Environmental Science and Technology, 42, 4478–4485, doi: 10.1021/es703009q, 2008
Apes Light Code (A stand-alone APES for use in PMF results or for individual HR spectra)
This ipf is for use with stand-alone spectra, such as one may obtain via a HR PMF analysis. This ipf is self-contained and will compile by itself; it does not need the squirrel and pika infrastructure. It presumes the input spectra contains only HR ions under consideration (typically all Organic Mass, OM). Such a spectra can be generated with Pika version 1.07 or greater, because these versions have the ability to precisely define HROrg, the High resolution version of the typical AMS organic species. The ability to define HROrg greatly simplifies the elemental analysis. Much of the original APES code dealt with the cumbersome, limited assumptions about organic mass HR ions that did not have a C atom within an ion.
Apes-in-Pika Code (APES code that has now been merged into Pika versions 1.07+, versions with HR species)
The ipf PK_elemAnal_1_07.ipf and higher contain the essential components of the original APES and merged it into Pika. This ipf is now automatically included with all Pika template experiments. It contains the same essential code as the original APES, and in the stand-alone, APES Light code.
Apes Code (The original APES, or APES classic, for use in Pika without HR species)
This ipf must be used within a Pika experiment even if the HR spectra to be analyzed is not Pika generated, because it relies on function within Squirrel and Pika ipfs. Users need at least Igor 6.0; this code was primarily tested using Igor 6.1.
Version Information and Download Site
You do not need to use this version of Apes if you are using Pika 1.07 or higher. The latest 'classic' version of the Apes code is 1.04 and was released on 28 Oct 2009. Version 1.04 is the same as version 1.03, it is simply formatted to fit smaller screens and Macs. This version and all previous versions are available at the ToF AMS software download site at
http://cires.colorado.edu/jimenez-group/ToFAMSResources/ToFSoftware/index.html#APES
Before You Begin
The elemental analysis code (APES) assumes that the high resolution (HR) sticks used for input are both quantitative and inclusive of all measured HR fragments. Generating a complete and quantitative set of HR AMS sticks is non-trivial, especially for ambient data with low concentrations or with higher m/z mass fragments.
Step 0: HR Data to be Analyzed
The user can select either Pika calculated sticks or user-defined sticks. When APES is used with Pika sticks the data set HRDiffSticks, the wave containing the chemical formulas for those HR sticks, and the todo wave and all the associated Squirrel/Pika infrastructure is used. When the 'User chosen' option is selected the user identifies the names of the waves needed for the calculations: the HR sticks, the wave with the chemical formulas of the fragments and the chemical mass of the fragments, and if needed the names of the family mask waves (step 1E). The code assumes that all waves reside in the root folder.
Step 1A, 1B: Mathematical Treatments
HR results from Pika can include nans (Not a Number) and small negative (~ -1e-6ish) values. The APES code needs to know how to handle these values. Default options are to set the nans and negatives to zeros. Users should be aware that nan HR stick results from Pika should be investigated before this option is employed to ensure the validity of APES results. The APES code will return nans for instances where there are nans in the HR stick matrix and the user chooses not to change nans to zeros.
AMS chemical fragments do not ionize at equal proportions; calibration factors are needed. Default calibration factors are as given in the Aiken et. al. Anal. Chem. paper with the exception of the S/C factor which has not been found. It is given a default value of 1.
Step 1C - 1G The Definition of Organic Mass (OM)
OM is defined as the sum of the masses of all HR species which have at least one carbon atom. While this definition seems intuitive and straight-forward, the application of this definition for AMS data requires user input.
In the case of CO2, the Pika generated HR stick may reflect gas-phase and aerosol loadings. CO2 is often one of the larges components of OM, so it is critical to correctly partition this fragment. The frag checks in squirrel will inform this accurate partitioning. User choices are entered in section 1C of the panel. If the HR stick for CO2 is already correctly partitioned and reflects only the aerosol loading, then the user may enter 0 (ppm)for the estimate of the gas phase CO2 and the entire stick value will be used in the analysis.
In the case of CO, it may be difficult in Pika to accurately resolve this HR peak with its neighbor N2. User choices are entered in section 1D of the panel.
A portion of the non-carbon containing water fragments of H2O, OH and O should often be included in the definition of OM. For example organic acids often fragment into H2O, OH and O. Users are able to specify the amount of these three fragments which contribute to OM in step 1E of the panel. The default for this option is given as indicated in Aikin et al Anal Chem paper, Table S-3.
Users can include entire inorganic families of HR fragments to the total OM by using the checkboxes in step 1E. This option is intended for laboratory studies, when the organic aerosol is composed of a known compound. For example if laboratory generated aerosol contains only organic nitrates, the user may want to include all variations of NO fragments, which is the NO family.
The concept of families of HR fragments was introduced into Pika as a way of grouping similar fragments. In Pika, once the user selects the fragments to fit mask waves (waves with 1s and nans or 1s and 0s) are automatically created which indicate the truth/false of whether an ion belongs to a family. Every ion belongs to one and only one family. The Pika code tries to decipher the chemical formula to determine a fragment's family status. If the chemical formula is strange or not formatted properly the fragment may default to belong to the 'other' family.
Users can include additional individual HR fragments by entering the names of the HR fragments in step 1G. This list of HR fragments should be separated by commas; spaces will be ignored. This option is especially useful for the analysis of laboratory standards where all fragments should be more easily identified as originating from an organic molecule. When the OH family is checked, the partitioning of the water fragments H2O, OH and O will proceed as indicated in step 1D. The remaining HR fragments in the OH family (H3O, etc) will be included in OM as an other non-carbon containing fragment.
Users can exclude HR fragments which may be due to air or other interferring species that would otherwise be included in the OM grouping by entering the name of the HR fragment(s) in 1G. This list of HR fragments should be separated by commas, spaces will be ignored.
Step 2 Elemental Analysis
Users can opt to calculate and display the elemental ratios (Step 2A) or the elemental mass spectrum (Step 2B). The order in which either calculation is performed is irrelevant. Once the analysis has been performed, one can view the table of elemental mass fractions to troubleshoot and verify the correct parsing of the chemical formulas and the grouping of fragments to the organic mass entity.
Step 2A
When this button is pressed the code will sum the the elemental loadings and apply the calibration factors. If the Pika HR sticks are used, the results will be displayed as a time series (runs not in the chosen todo wave will have values of Nans). If user defined HR sticks were used, a simple table of all the ratios will be displayed.
Step 2B
When this button is pressed the code will find the elemental loadings and display the results as a mass spectrum. The elemental calibration factors are not applied in this analysis.
Sparrow Light Scattering Module Analysis
Is under development. See this technical ppt to see some technical details.
Help
Are tutorials available?
Before using Squirrel, one should be familiar with the basic concepts of Igor. Several good Igor tutorials are available in the Wavemetrics/Igor Pro Folder/Learning Aids folder. You should know how to create, edit and find waves, and create, modify and find graphs.
The briefest of summaries (3 pages) for creating quick-look AMS plots can be found here.
A series of short movies explaining small steps within squirrel and pika are:
0. Setting things up
- AMS DAQ HDF contents
- HDF5 xop shortcut for setting up Squirrel and Pika
- Get index
- Ugrading an existing Squirrel or Pika experiment
1. M/z calibration
2. Baseline and UMR stick integration region
3. Pika HR families defined via familyWave_* waves
Currently, there are 3 Squirrel tutorial presentations which can be downloaded:
- Squirrel overview power point presentation. The original form of this ppt was presented at the 2006 User's Meeting, and has been updated a few times since then.
- Squirrel pre-preprocessing power point presentation. This covers the m/z calibration and baseline fitting options.
- Squirrel post-preprocessing power point presentation. This covers the airbeam correction factor, DVa and DC marker calculations. It is available as a ppt.
For users of the DAQ Fast Mode, a tutorial for squirrel versions 1.50+ is available here.
A presentation comparing the Squirrel and Pika analysis steps can be downloaded: Squirrel vs Pika Analysis Overview.
How do I report a problem with the ToF-AMS Analysis software? (Squirrel, Pika, Apes, etc)
There are a few places you should look before reporting any problems.
- The Technical FAQ
- The release notes of the version of Squirrel you are using and previous version release notes, if appropriate.
There are a few things you should try before reporting any problems:
- Make sure the problem is replicable.
- Isolate the problem to simplest, smallest case where the problem still occurs.
- Gather the following (as appropriate):
- the operating system of the computer, version of Igor, error message and symptoms
- a screen shot of the problem or "Save Graph" if appropriate (e.g. if a graph looks odd)
- the Igor experiment if it is small, or an example DAQ hdf if the problem is in regard to a specific file
- Send an email to Donna Sueper (donna(at)aerodyne.com).
Please be aware that the latest versions of Squirrel will often have bugs fixed. Users should try upgrading to the latest Igor and ToF-AMS analysis software version to see if the problem persists.
How do I analyze AMS data with Squirrel?
The best resource is the wiki at http://cires.colorado.edu/jimenez-group/wiki/index.php/Field_Data_Analysis_Guide
How do I analyze AMS data with Pika?
The best resource is the wiki at http://cires.colorado.edu/jimenez-group/wiki/index.php/High_Resolution_ToF-AMS_Analysis_Guide