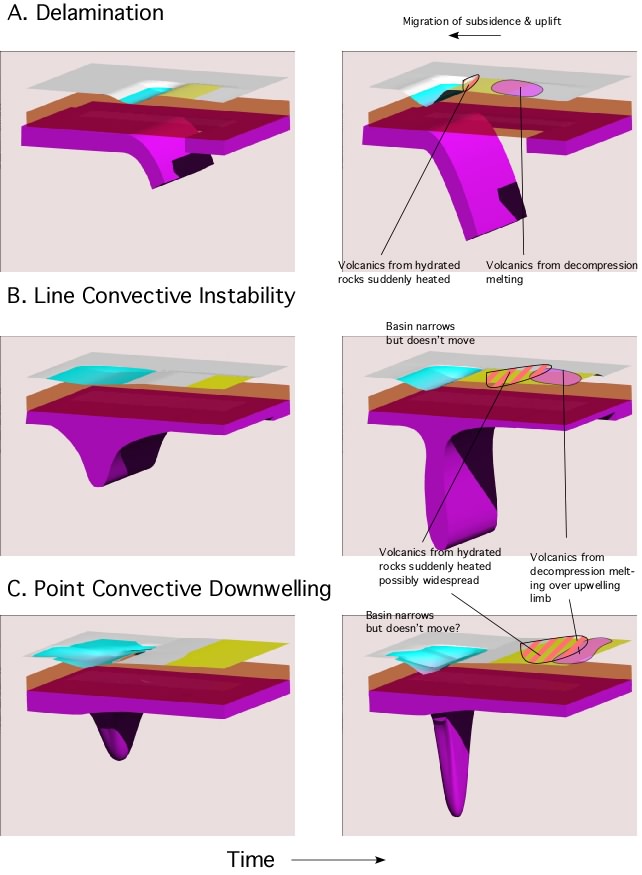
Fig. 1. Cartoons highlighting some of the potential differences between removing dense lithosphere (purple) through (a) delamination and (b) convective instability. Subsidence of the surface (top surface) is blue, uplift yellow. The bottom panels (c) illustrate a kinematic concept where the downwelling focuses into a cylinder as upwelling remains linear. Such a possibility has not yet been simulated numerically. Note that (c) has an asymmetric removal of material, which we suspect is likely in view of the plutonic origin of eclogite, but again is untested to our knowledge. In all cases shear between the continent and underlying asthenosphere could skew the geometry of the downwelling material.
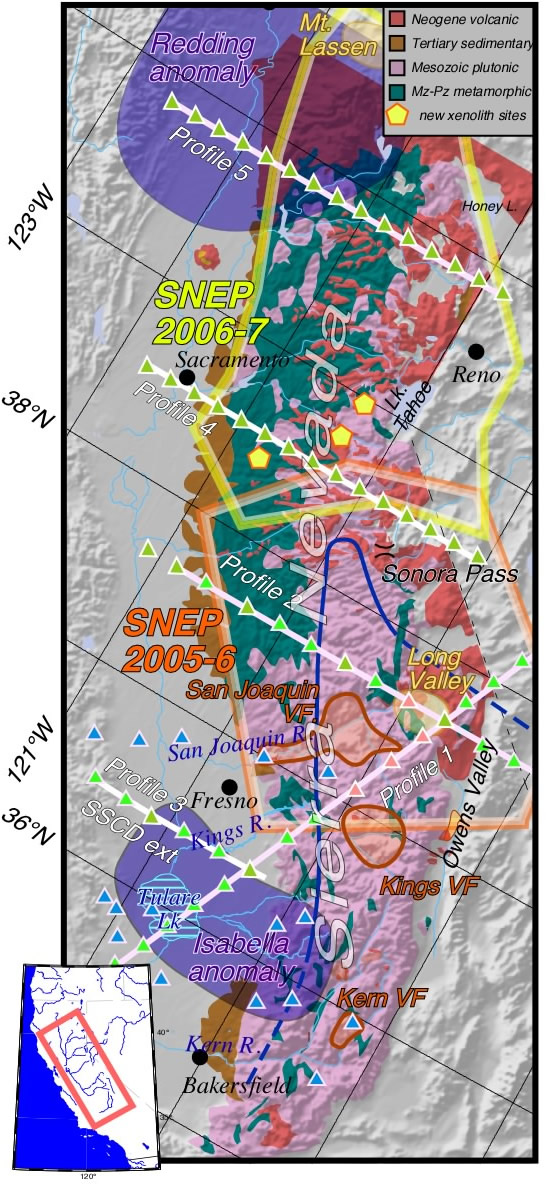
Figure 2. Simplified geology of the Sierra, with Neogene volcanic fields in the southern Sierra as indicated in orange outline. 87Sr/86Sr = 0.7060 line in blue. High P-wave speed anomalies in purple. Note the north to south changes in the width of the Cenozoic sedimentary rocks on the west flank of the Sierra, and the extensive volcanic cover in the northern Sierra. MT profiles in white; existing broadband MT site blue triangles. New xenolith localities as yellow pentagons. Outline of ongoing (orange) and phase 2 (yellow) SNEP seismometer deployment shown.

Fig. 3. Comparison of east-west geophysical profiles through the southern Sierra by Park [2004] and Boyd et al. [2004]. Profiles at left are more typical geophysical profiles (P wavespeed and resistivity); at the right are more unusual sections (vp/vs and attenuation, resistivity-derived temperature and melt). Outlines of bodies from Boyd et al superimposed on all profiles; solid outline to left is inferred garnet peridotite, dashed line outlines possible eclogites, dash-dot is likely warm spinel peridotite. In light of the resistivity structure, it is possible that the seismologically inferred eclogite is in fact melt-rich peridotite and the eclogite is in fact richer in garnet and present between the dashed and solid line bodies.
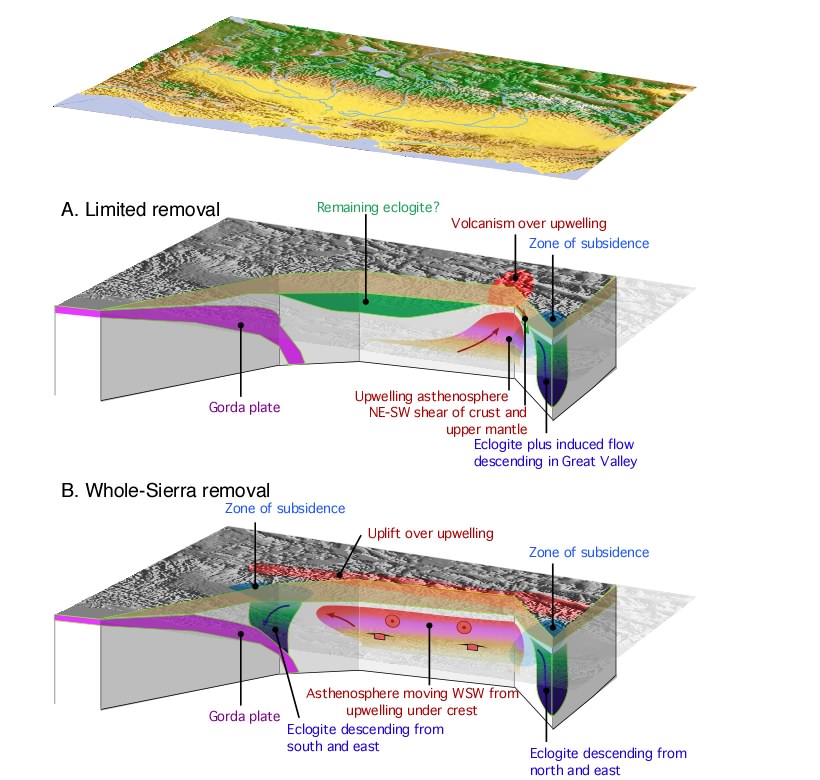
Fig. 4. Two views of Sierran geodynamics (a) eclogite and lithosphere only removed in the Kings-San Joaquin area and (b) eclogite and lithosphere removed from nearly the full length of the Sierra.
Figure 5. Cave-derived river incision rates in South Fork Kings River canyon. A: Topographic profile across South Fork Kings River canyon in vicinity of Boyden Cave. Note ~2 km local relief. B: Inner gorge of South Fork Kings River canyon, containing suite of dated caves preserved by exceptionally steep canyon walls. These caves reveal order of magnitude decline in incision rate toward present. While oldest cave demonstrates 400 m of canyon cutting in past 2.7 m.y., larger context shown in A shows that this represents only ~20% of present local relief. (From Stock et al., 2004)
Figure 6. Response of South Fork Kings River to late Cenozoic tectonic and climatic events. A: Conceptual model of late Cenozoic uplift. Westward tilting steepens pre-uplift surface (dark gray) and river profile (dashed red); surface uplift increases orographic precipitation on western slope of range and enhances rain shadow to east. Thin crust beneath range crest (Wernicke et al., 1996) likely reflects delamination of batholithic root (Ducea and Saleeby, 1998). B: Example of stream power-based numerical simulation. Steady river profile (dashed red) with steps corresponding to quartzite in two metamorphic belts is subjected to ~1.5 km of crestal uplift. 1 m.y. profiles (blue) show that over next 9 m.y., wave of rapid incision begins at hinge line and propagates up profile. Inset shows 6 m.y. incision history at cave site; wave of rapid incision passes between ca. 5 and 2 Ma, followed by return to low pre-uplift rates (dashed curve after 2 Ma). Further reduction in late Quaternary rates (solid curve after 2 Ma) reflects sediment mantling of bed associated with large glaciers in headwaters. Final modeled river profile (purple) fits modern profile (red) to just upstream of cave site, above which glacial erosion, not represented in our river incision rule, has dominated past few million years. (Stock et al., 2004)
 Figure
7. Theoretical thermal histories derived from river incision histories and
modeled 4He/3He data. We compare a 1-step erosion history (a) where the entire
river gorge is formed in one event to a 2-step history (b) where the river
canyon is formed in two events that yield identical bulk 4He age, but distinguishable
4He/3He ratios. Known incision histories are constrained by (U-Th)/He vertical
profiles [Clark, et al., 2005] and references therein] and cosmogenic dating
of cave sediments [Stock, et al., 2004] (grey). Thermal histories are calculated
from linear cooling rates, geothermal gradient, incision rate and a surface
temperature of 10°C. White region represents time period of unknown incision
history that we aim to constrain. A) We linearly extrapolate the 0.27 mm/yr
erosion rate measure between 2.7 - 1.4 Ma [Stock, et al., 2004] to 5.7 Ma,
to account for 1200 m of incision during this interval. We assume that the
incision rate of the river prior to this event was equal to 0.04 mm/yr, implied
by the helium data, and that this incision rate in the channel is equal to
the overall landscape lowering. Likewise, we assume that the < 1.4 Ma incision
rate of 0.02 mm/yr [Stock, et al., 2004] also represents the overall landscape
lowering such that no net gain or loss of relief occurs in the river during
this time period. The 2-step model (b) describes a history where the 1200 m
of river incision occurs in two discrete time periods: 820 m of incision between
18-16 Ma, and 350 m between 2.7 - 1.4 Ma. Both of these scenarios yield identical
bulk helium ages of 35.4 Ma but discernable 4He/3He ratio
evolution curves. B) Evolution of the 4He/3He ratio (normalized to the bulk
ratio) during step heating. Qualitatively, the difference in the two isotopic
ratio evolution occurs because the red sample (b) cools quickly through much
of the PRZ at an earlier time, whereas the blue sample (a) initially cools
slowly through the PRZ then is rapidly cooled at a later time. In effect, the
earlier history of sample (a) is detectable by more 4He accumulation
at the outer edge of the grain.
Figure
7. Theoretical thermal histories derived from river incision histories and
modeled 4He/3He data. We compare a 1-step erosion history (a) where the entire
river gorge is formed in one event to a 2-step history (b) where the river
canyon is formed in two events that yield identical bulk 4He age, but distinguishable
4He/3He ratios. Known incision histories are constrained by (U-Th)/He vertical
profiles [Clark, et al., 2005] and references therein] and cosmogenic dating
of cave sediments [Stock, et al., 2004] (grey). Thermal histories are calculated
from linear cooling rates, geothermal gradient, incision rate and a surface
temperature of 10°C. White region represents time period of unknown incision
history that we aim to constrain. A) We linearly extrapolate the 0.27 mm/yr
erosion rate measure between 2.7 - 1.4 Ma [Stock, et al., 2004] to 5.7 Ma,
to account for 1200 m of incision during this interval. We assume that the
incision rate of the river prior to this event was equal to 0.04 mm/yr, implied
by the helium data, and that this incision rate in the channel is equal to
the overall landscape lowering. Likewise, we assume that the < 1.4 Ma incision
rate of 0.02 mm/yr [Stock, et al., 2004] also represents the overall landscape
lowering such that no net gain or loss of relief occurs in the river during
this time period. The 2-step model (b) describes a history where the 1200 m
of river incision occurs in two discrete time periods: 820 m of incision between
18-16 Ma, and 350 m between 2.7 - 1.4 Ma. Both of these scenarios yield identical
bulk helium ages of 35.4 Ma but discernable 4He/3He ratio
evolution curves. B) Evolution of the 4He/3He ratio (normalized to the bulk
ratio) during step heating. Qualitatively, the difference in the two isotopic
ratio evolution occurs because the red sample (b) cools quickly through much
of the PRZ at an earlier time, whereas the blue sample (a) initially cools
slowly through the PRZ then is rapidly cooled at a later time. In effect, the
earlier history of sample (a) is detectable by more 4He accumulation
at the outer edge of the grain.
Figure 8. Paths through pressure-temperature space taken by the sinking instabilities (dashed lines) in numerical experiments. Instabilities that sink quickly are not conductively heated effectively at low pressures; their paths are shown on the left. Instabilities that sink more slowly (paths on the right) may themselves melt or may trigger damp melting of the surrounding asthenosphere. The depths of melting suggested by the numerical experiments (blue shaded region) is in agreement with experimentally-determined melting conditions of potassic continental magmas (black dots) and the melting conditions of the Sierran olivine leucitite from Elkins-Tanton and Grove [2003] (red dot), though this last requires either higher mantle temperatures or larger volatile contents. The region of dry adiabatic melting (red shaded oval) in shallow convection currents just below the lithosphere would produce significantly different compositions. Light blue region has water as a free phase. Phase boundaries and melting conditions from Ohtani et al. [2004], Herzberg et al. [2000], Hirth and Kohlstedt [1996; 2003], Takahashi et al. [1993], Edgar and Condliffe [1978], and Edgar et al. [1976; 1980], Barton and Hamilton [1978; 1979], Nicholls and Whitford [1983], Esperanca and Holloway [1987], Righter and Carmichael [1996], and Sato [1997].
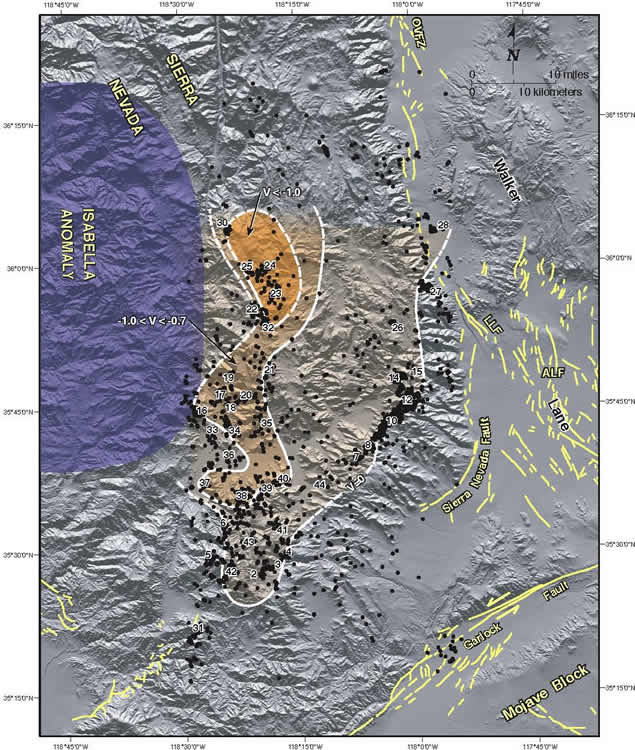
Fig. 9. Map of the southern Sierra Nevada and western Walker Lane belt showing results of kinematic analyses of background seismicity [modified from Unruh and Hauksson, 2004]. Focal mechanisms from individual groups of earthquakes (numbered) have been inverted for components of a reduced strain rate tensor [Twiss and Unruh, 1998]. Values of the vertical deformation parameter V, defined as the vertical component of the strain rate tensor normalized by the maximum extensional principal strain rate, are contoured to determine areas characterized by strike-slip faulting (V = 0), transtensional shearing (-0.7 < V < 0), horizontal extension (-1.0 < V < -0.7), and oblate flattening or “pancaking” of the crust (V < -1.0). Note that horizontal crustal extension in the southern high Sierra occurs in an approximately 25 km wide, north-south trending region directly east of the Isabella anomaly. There is a 20-30 km wide “transtensional” domain between the extensional southern High Sierra and the dominantly strike-slip Walker Lane belt. ALF = Airport Lake fault; LLF = Little Lake fault; OVFZ = Owens Valley fault zone.
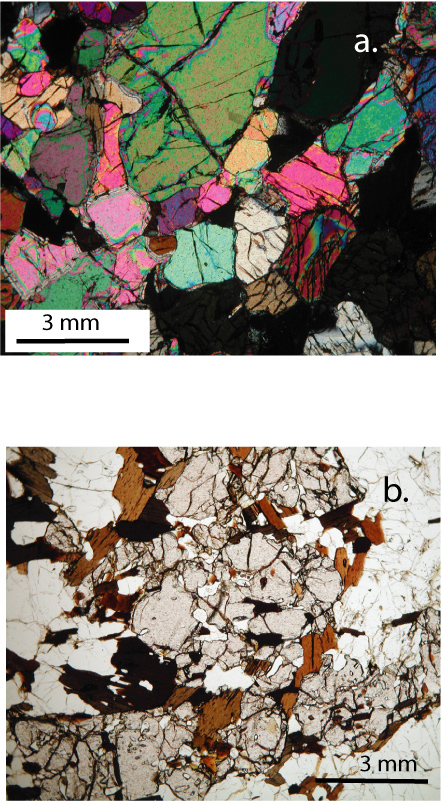
Fig. 10. A spinel peridotite (a) and a garnet amphibolite (b) from Jackson Butte. Peridotite is in cross polars, amphibolite in in plane view.
Fig. 11. Stratigraphy of volcanic units in selected parts of California. Generalized stratigraphic columns for the Mojave Desert, southern Sierra Nevada, and proposed study area. Tan swath give the approximate time of passage of the Mendocino fracture zone under the various regions, based on the reconstruction of Atwater and Stock (1998). There is little correlation between these plate-boundary events and volcanism.

Fig. 12. Wt. %K2O, and Wt. % Fe2O3t/MgO vs. wt. % SiO2 for late Cenozoic igneous rocks at ~38°N in the northern Sierra Nevada. Data from Brem (1977), Priest (1979), Farmer et al. (2002), Roelofs (2004) and Farmer (unpublished).
Fig. 13. A: Three vector fields from numerical experiment d8 by Elkins-Tanton [in review], with Newtonian rheology and a weak layer in the mid-lithosphere. The images show cross-sections from the top of the crust into the mantle. The left boundary is an axis of symmetry, passing through the center of the downwelling, axi-symmetric plume. The scaled model box represents 250 km in width and height. Arrows show the velocity vector field and shadings represent density. Solid contours are isotherms. Detachment along the horizon of low viscosity allows strong upwelling to form in an annulus around the instability, creating the opportunity for adiabatic melting. Shortly after the final image the downgoing plume, hot enough to have dehydrated, sinks out of the model box and is detached from the lithosphere.B: Surface topographic evolution of the gravitational instabilities from model d8. Topography is given in meters, and distance from the axis of symmetry in km. Arrows in this figures show the sense of time evolution of the topography and give the scaled end time of the experiment. C. Melting rate from dry adiabatic melting in the annulus of upwelling flow induced by the sinking plume. Dry adiabatic melting occurs mainly in a pulse during growth of the instability and initial fall. Wetter melting is predicted by these experiments to follow dry melting, as the instability devolatilizes, just as a subducting slab does
Fig. 14 Initial eNd vs. age for northern Sierra Nevada volcanic rocks. Data from Farmer et al. (2002), Farmer (unpublished), and Roelofs (2004).