 |
 |
| Steffen Home | People | Projects | Publications | Classes | Contact |
| RESEARCH GROUPS @ CIRES > |
September 28, 2005
Greenland Melt Extent, 2005
Konrad Steffen
and Russell
Huff
Cooperative Institute for Research in Environmental Sciences (CIRES),
|
Passive
microwave satellite data are used to map snowmelt
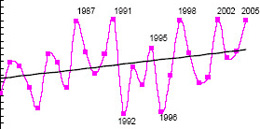
extent and duration on the The total melt area for the same time period in 2005 is slightly lower than 2002 (0.6%) and 1991 (1.1%) as of September 25th. However, we expect a record total melt area for 2005 given the fact that the southern and western part of Greenland are still melting in late September, whereas 2002 and 1991 experienced almost no melt in late September and during October. The melt during October 2003 was 2.3 times that of 1991 and 4.3 times that of 2002. We expect the melt of 2005 to be equal or even larger. There
was extensive melt for 7 days during 2005 that covered The melt extent for 1992 (minimum extent)
and for 2005
(maximum extent) are displayed in the same 3-D view of Greenland in
light red
(1992) and dark red (2005) color. Detection of surface melt
at large spatial
scales is most effectively accomplished through the use of satellite
microwave
data, which has a clear melt signature that arises from the transition
from
volume- to surface-scattering during melt onset. As such, wet-snow
emission
approaches black body behavior, and this change in emission
characteristics is
detectable by most microwave sensors. These changes in emission
characteristics
have formed the basis of several passive-microwave-based melt
assessment
algorithms.
CIRES is a joint institute of CU [ About CU ] and the National Oceanic and Atmospheric Administration [ About NOAA ] . Steffen,
K., S.V. Nghiem, R. Huff, and G. Neumann, The melt
anomaly of 2002 on the Greenland Ice Sheet from active and passive
microwave
satellite observations, Geophys. Res. Lett., 31(20), L2040210.1029/2004GL020444, 2004. Hanna,H., P.Huybrechts,
|
See Also
|
||||


