Field ToF-AMS Operation: Difference between revisions
| Line 308: | Line 308: | ||
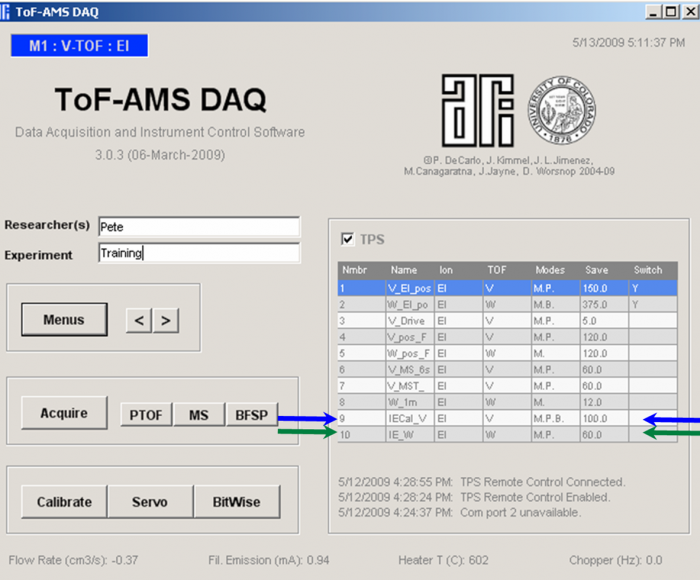
*You need to make sure that all the TPS (TOF power supply) settings in the IE cal menu are the same as for the menu used during normal sampling. If the values are not the same, they cannot be changed in this tab if “TPS remote control” is enabled. In that case you can change them in the tuning tab of the “m/z calibration” window. Consistency with the standard operating menus is most easily achieved by cloning the standard menus and then making the modifications described here.</blockquote> | *You need to make sure that all the TPS (TOF power supply) settings in the IE cal menu are the same as for the menu used during normal sampling. If the values are not the same, they cannot be changed in this tab if “TPS remote control” is enabled. In that case you can change them in the tuning tab of the “m/z calibration” window. Consistency with the standard operating menus is most easily achieved by cloning the standard menus and then making the modifications described here.</blockquote> | ||
[[file:EI calibration-figure6.png|700px]] | |||
<blockquote> | |||
''Figure 6 Screenshot during acquisition of IE calibration data with pure NH4NO3 particles'' | |||
</blockquote> | |||
===figure 6=== | ===figure 6=== | ||
'''For the BFSP calibration'''<blockquote> | '''For the BFSP calibration'''<blockquote> | ||
Revision as of 22:12, 13 August 2010
The purpose of this page is to serve as a repository of best practices on how to calibrate, operate, and document the calibrations/operation of a ToF-AMS during a field study. Much of it will also be relevant for lab studies.
Once the data have been acquired, please refer to the ToF-AMS Field Data Analysis Guide to guide the (very complex) data analysis phase.
This page was created by the Jimenez Group at CU-Boulder and Peter DeCarlo from PSI, with contributions from multiple other AMS Users.
Important Spares for a ToF-AMS Campaign
- ToF-AMS Spares and Repair parts
- Filaments (1 set of 2), HS-81 servos with metal gears (3), MCP sets (1-2 sets of 2, stored in vacuum chamber), critical orifices (3)
- pulsers (if available)
- Miniature tool set to replace filaments etc (check that ALL tools are inside -- the ones missing otherwise are likely to be the ones you need!)
- Electronics cards: timer card, NI-6024E
- Fans for AMS pumps: one small, one large
- Clone (recent) of AMS Computer Hard Drive
- Varian turbos: 1 V301 pump, 1 V70 or V81 pump, 1 V301 controller, 1 V70 or V81 controller (See Ed plan for vacuum failures)
- Backing pump
- CDs & usable serial No. for Visual Basic .NET 2003
- He lecture bottle, regulator, hose, and "gun" for leak testing
- Blank NW63 flanges (2), spare NW63 and NW100 O-rings (2 each)
- Chopper motor
- TORX T8 driver (for TPS module)
- Important spares (electrical & electronic)
- AC Plug tester
- Multimeters (2)
- Oscilloscope (Textronix TDS 220 is a nice one)
- x10 dividing probe for scope
- Soldering iron
- Solder
- High voltage probe
- Variable DC power supply (1-2)
- Function generator (1)
- Important spares (computer)
- 50 ft KVM cable (check USB or PS2)
- Important spares & parts(flow)
- Drycals (low and high range)
- Small TSI flowmeters w/ power and RS-232 cables (3)
- White HEPA filters (2+) (rated to 70 lpm)
- Set of two large 2-way valves to test whole inlet with filter regularly
- Blue Balston filters (4x grade AA, rated 3.5 lpm)
- Assorted stainless swagelok
- Assorted brass swagelok
- Set of O'Keefe critical orifices (check completeness)
- Inlet manifold
- Hardware
- Field Microscope
- Logistics
- First aid kit
- Knee pads
- Gloves (for moving)
- Latex gloves (for vacuum)
- Aerodyne phone number on a cell phone
Inlet and Dryer Set up
General References on Particle Transmission thru Inlets
For a guide on particle transmission on inlets, see the following references:
- Hinds, Aerosol Technology (Very good introductory and mid-level book)
- Baron and Willeke, Aerosol Measurements ("The BIBLE of aerosol measurements")
- Tutorial on Aerosol Sampling and Transport: To be posted soon
For calculation of losses thru inlets:
- Particle Loss Calculator by Drewnick and co-workers.
- This is an Igor program. To download a 1-month free trial version of Igor go to Wavemetrics web page
- Aerosol Calculator from Paul Baron (in Excel, refers to formulae in Hinds and Baron-Willeke books)
Other useful inlet-related info:
- O'Keefe Critical Orifices. In particular their assortments of orifices on 1/4 inch steel tubes are extremely useful in the field or lab to be able to quickly control a variety of flows. These are part numbers KK4-30-SS or KK4-90-SS in the Orifice Kit Document
Dryer Set Up
It is highly recommended that air is dried before AMS analsysis in order to reduce uncertainties in the bounce-related collection efficiency (Eb) and possible losses in particle transmission (E_L) if the particles grow too large at times of high RH. For more information see the CE section of the Field Data Analysis Guide.
There are 2 basic types of dryers that can be used. You need 2 dryers if you use diffusion dryers (like the TSI one with silica gel) so that you can regenerate one while the other is being used. However they often have to be replaced daily (depending on ambient RH and size) and doing that automatically is very complicated. (Although possible, IFT Leipzig has built some industrial-quality systems to do this). An easier alternative is to use a nafion dryer. We recommend dryers with metal casing, as those with plastic casing were observed to lead to losses of charged particles by P. McMurry's group (Jose can provide a report on this upon request). For the small flows that are typically needed, the MD series dryers from Perma Pure work well. What you need to do is to plumb the aerosol flow through the "straight" path, and then put a critical orifice on one end of the "outside" path and a pump on the other end. You want to have some flow on the outside path, but at a much reduced pressure (~1/10 of 1 atm). What drives the drying is the absolute humidity, so you are dropping that by x10, and that will drive the gas-phase H2O on the aerosol flow through the nafion membrane and to the outside path. A typical Gast pump/compressor will do. Very important, be very careful with the fittings on the dryer, as if rotated strongly one can break the internal connections of the nafion tube, and then you have a large leak and end up sampling room air.
If is worth convincing yourself that you don't have a leak by putting a filter before the dryer and sampling with a CPC, and similarly (w/o the filter) convincing yourself that particle number losses thru the dryer are not important.
Tuning the Ion Source and ToF-MS
Note: these are some notes on tuning put together by P. DeCarlo and J.L. Jimenez, and circulated via email to Tofwerk and some core users. The responses that we got via email are inserted in the original list. There appear to be different schools of thought on how to tune, so these are given here only as guidelines.
- ORDER OF TUNING
- Tune ion source first for signal, then tune reflectron voltages for resolution, then tune Pulsers for detailed peak shape
- ION SOURCE:
- The tuning appears to depend on the emission current (maybe really filament current?) in a way that we don't understand. So it is important to tune at the emission current that will be used during measurements (typically 2 mA)
- Don't change ion chamber from design values for that ToF by more than 10% (design values = 49V for cToF, 35V for vToF, and 8.5 for wToF, from Katrin's email on 3/1/2006)
- In general we don't tune the ion chamber. Rather we tune the heater bias, which will typically be a few volts lower than the ion chamber value.
- Response from Achim T: Tuning the ion chamber makes a lot of sense. It affects the ion signal a lot by a better extraction of the ions into the Pulser region. In the moment we have no evidence that changes in a certain range (not up to 80 V) will lead to a loss of small ions. The post acceleration affects this loss in a similar way like the ion chamber voltage. By increasing it the ions get a higher velocity perpendicular to the ion extraction. This has the opposite effect to increasing the ion chamber voltage.
- The difference between the ion chamber and the filament should be 70 V (this is the electron energy)
- Response from Katrin F: This is somewhat flexible, since depending on where you set your extraction lens voltage you may have a range of potentials in the ion source (due to field penetration). The problem is that what you see on the tof detector will be a folding of the Energy acceptance of the TOF (which is on maximum at the 49eV for the C etc) And the energy distribution of the ions transferred in the TOF extraction. Depending on your LV settings you will get ions of different energies into the TOF extraction. To be sure that you have preferentially 70eV ions one would need to compare to a reference spectrum, and tune the LV until you reproduce the reference spectrum. In principle you should be fine if you use the same voltages relative to the ion source as with the quad settings (what voltages did you use there to get the 70eV reference spectra?) for filament, ion chamber, and extraction lens.
- The ion energy into the ToF orthogonal extractor is determined by the ion chamber. Changing the ion energy will change the m/z-dependence of the extraction efficiency. This should not be changed during a campaign.
- Deflector flange needs to walk with the deflector voltage, small changes between the two are okay, and fractional volts can help a lot
- Electron Pusher is not connected and is disabled in recent TPS software versions.
- HIGH VOLTAGE:
- Tune reflectron grid and backplane together. This is the best way to increase resolution.
- Response from Katrin F: Just tuning RG is sufficient.
- Lens: this was added to tune off V-mode ions in W-mode. It should be high (~2800 V) in W mode and low (~1000) in V-mode
- Response from Achim T: Tuning the lens voltage helps a lot by reducing the vmode ions in W mode and by increasing the signal. The quoted numbers of 1000 V for Vmode and 2800 V for Wmade are typical but they vary a lot. There are instruments which have the best vmode performance with a lense voltage of 2300 V.
- MCP and post-acceleration are NOT tuned, these are set for amplification depending on other considerations (saturation, signal-to-noise, etc.)
- Hardmirror doesn't have much effect on signal or resolution, no need to tune much
- Response from Katrin F: Yes, hardmirror should NOT be tuned
- Response from Achim T: The hardmirror has an effect on the peak shape and signal height. But you may have to vary it by some hundred Volts. In a well tuned instrument it has really no effect.
- Tune reflectron grid and backplane together. This is the best way to increase resolution.
- PULSERS
- The three should be tuned together
- Response from Katrin F: I would prefer in the future that the pulser is left at the settings I ship it. You can get the same effects by just tuning the LV.
- These should NOT be set higher than 800V
- Tuning these 3 together is the best way to tune out leading and tailing edges
- U+Low is not connected and doesn't do anything
- The three should be tuned together
Standard Field Calibration procedures
Data Acquisition and Instrument Control Software (DAQ): Make sure you are doing data acquisition with the latest version of Acquisition software whether a ToF or a Quad. (upgrade before field campaign, and check for any problems)
- ToF-AMS Software: http://cires.colorado.edu/jimenez-group/ToFAMSResources/ToFSoftware/index.html
- Quad-AMS Software: http://cires.colorado.edu/jimenez-group/QAMSResources/Software/index.html#Acq
Saving Frequency: at least 5 min data on fixed time grid (on the hour).
m/z Range: at least scan m/z 0-300 (Q). One should go higher with the ToF instruments around m/z 10-500 is encouraged.
m/z's for Q-AMS PToF Mode: For particle TOF data the following masses should be used at a minimum: 16, 28, 30, 35, 43, 44, 46, 48, 55, 57, 60, 64
JMS Mode: For Q-AMS Jump mass spec (JMS) mode can be used, but it is not necessary for ground based monitoring unless mass concentrations are very low (remote clean sites). Note that the m/z's used in JMS mode are hardwired to be the same as those in PToF mode.
Vaporizer temperature: 600C is standard.
Dryer: If you have the ability to dry the aerosol inlet, do that. It simplifies the application of the componsition-dependent CE (Eb), see the Field Data Analysis Wiki for details. A nafion dryer from Perma-Pure (MD-110 with Steel casing, AVOID plastic casings) is recommended. The drying counterflow can be provided by ambient air whose pressure is reduced with a critical orifice, so no dry air supply is needed. Diffusion dryers filled with silica gel can also be used but require constant monitoring of the indicator and frequent changes which is more prone to leaks. Depending on the humidity and the sample flow rate they may be spent and no longer dry after only one day of sampling. If you cannot dry, at the very least measure of the RH at the AMS inlet is needed if the inlet line is not dried. This measurement is best done in the line to the pump for the AMS bypass flow, to avoid perturbing the flow going into the AMS which could lead to particle losses.
| Calibration | Frequency | Description |
| Inline HEPA Filter | At least every 3 days, best to do every day at the site.
Also do this every time the instrument has been vented/pumped down. |
30 minute (if every 3 days) or 10 min (every day) HEPA filtered, particle free air from inlet (NOT air from the room which will have increased CO2).
Do not filter at the same time every day. See suggested schedule below. HEPA should be put on inlet outside (if possible) and this will also allow a check for leaks in the inlet system, using a CPC or the AMS itself (although the CPC is much more sensitive to small leaks). Note that there is an Inlet delay, so one should reinitialize (F5) AMS acquisition after the inlet residence time has elapsed so that the data files are not mixed filter/ambient data |
| IE calibration | Every Week (minimum)
2x a week better, and anytime the instrument has been pumped down, or there has been a problem. Specifically it is CRITICAL to do at least one new IE calibration if a filament and/or MCP/electron multiplier are changed. |
Standard Ammonium Nitrate IE calibration. |
| Baseline / SI calibration | Before every IE calibration | See Instructions for Bitwise below |
| Size Calibration | Do at beginning and end of Campaign, and if there is a large instrument problem (e.g. loss of a pump etc.) | Standard AMS size calibration
Note that size calibration changes if lens pressure changes. So if you change the orifice and the lens P changes more than 3%, you should do another size cal. (changes in P are amplified into larger changes in size) |
| Flow Calibration | Do at beginning and end of Campaign, or if you change or clean the cirtical orifice, or if there is a problem or change on the baratron P gage used to quantify AMS flow | Standard AMS flow calibration
Please note whether the flowmeter you are using reports volumetric or mass flow. For volumetric flow, note whether it reports it under ambient T & P conditions, or under some standard conditions (e.g STP of 1 atm and 273 K, but people use many other definitions). |
| Clock Synchonization | Computer clocks can drift by up to 1 min per day (occasionally worse). Either set up automatically or keep track of instrument clock in relation to other clocks. |
Suggested Filter Times (perform the filter blank during the time interval indicated):
| Day of week | Week 1 | Week 2 | Week 3 | Week 4 | Week 5 |
| Monday | 800-900 | 1000-1100 | 1200-1300 | 1400-1500 | 1600-1700 |
| Tuesday | 1100-1200 | 1300-1400 | 1500-1600 | 1700-1800 | 900-1000 |
| Wednesday | 1200-1300 | 1400-1500 | 1600-1700 | 800-900 | 1000-1100 |
| Thursday | 1500-1600 | 1700-1800 | 900-1000 | 1100-1200 | 1300-1400 |
| Friday | 1600-1700 | 800-900 | 1000-1100 | 1200-1300 | 1400-1500 |
| Saturday | 900-1000 | 1100-1200 | 1300-1400 | 1500-1600 | 1700-1800 |
| Sunday | 1200-1300 | 1400-1500 | 1600-1700 | 800-900 | 1000-1100 |
Single Ion Calibration (Bitwise)
(from Peter DeCarlo's powerpoint)
Weiwei will add text here
Ionization Efficiency (IE) Calibration
(from Peter DeCarlo's powerpoint)
Weiwei will add text here soon
The Principle of the IE calibration
- The ionization (and transmission) efficiency (IE) is the number of ions measured from a “known” amount of mass entering the ToF-AMS.
- The Relative Ionization Efficiency (RIE) is the ratio of the IE of a species (e.g. NH4) to IENO3
1 What is the “Known” amount of mass
- The known amount of mass is based on generation of dry particles size-selected by a DMA system.
- Typical sizes used in the calibration are 350 ~450 nm in mobility diameter. The critical consideration is that ALL particles must produce detectable signals. Since there will be a distribution of the number of ions produced for various particles (due to random variations of the ionization and detection process, plus the fact that the particles are not truly monodisperse), some particles will produce more ions than others. If only the particles that produce more ions are detected, and the ones that produce fewer ions are not, then the IE determined with the detected particles (with BFSP) will be too high, and the concentrations reported with this IE will be too low. From experience, for typical V-Mode HR-ToF-AMS sensitivity, this requires 400 nm particles. For a Q-AMS 350 nm particles are typical (and this is easier to verify with the graphs in the main PToF window in the Q-AMS software). For a C-ToF-AMS, probably 300 nm may still be sufficient. A way to check whether you are not detecting all particles is to plot the AMS/CPC number ratio as a function of particle size. This ratio should be between 80%-120%, and will have a plateau when all particles are detected, but will decrease when particles start to be too small. It is possible to use larger particles than the minimum size, but normally the number of particles size-selected by the DMA decreases strongly with size, so the statistics of the IE calibration get worse (i.e. the calibration is noisier).
- The number concentration should be kept low enough so that the probability of having two particles within one chopper cycle is small (e.g. < 5%). This typically means < 200 particles/cm3. Otherwise you will often have more than one calibration particle during a chopper cycle. However the calibration analysis software assumes that only one particle is present, and then the IE will be overestimated. To estimate the number concentration which is tolerable, let’s assume a 2% chopper duty cycle with a flow of 1.5 cm3/s and a chopper frequency of 130 Hz. If we assume that the output of the DMA has 100 particles/cm3, then each second 100*1.5 =150 particles are entering the instrument. The chopper removes 98% of those, so each second only 150 * 2% = 3 part/sec are reaching the AMS vaporizer. Given the chopper frequency of 130 Hz, that means that 3/130 = 2.3% of the chopper cycles will have a particle, and thus the calibration data is good with respect to this criterion. In fact we could work with 200 part/cm3 and still have less than 5% coincidence errors. (Note that the probability of having two particles, when at least 1 particle is present, is the same probability as having one particle, as this is a Poisson process with uncorrelated events, i.e. one particle doesn’t know what the other particles are doing. E.g. in our example the probability of having one particle in a chopper cycle is 2.3%, and the probability of having two particles in any chopper cycle is 2.3%*2.3%. But the probability of having two particles when at last one is present is 2.3%. So in summary the particle number shold be kept around 200 p/cm3. On the other direction, you can work with much lower particle concentrations without having coincidence errors, but then you will detect very few particles per unit time, and the calibration will take a long time, or be noisy.
- For the BFSP calibration, you want to detect at least 300 individual particles (no matter whether it takes a short or long time). This is because from experience, once this number is reached the result of the IE calibration changes little, while it can be variable (noisy) for much smaller numbers of individual particles.
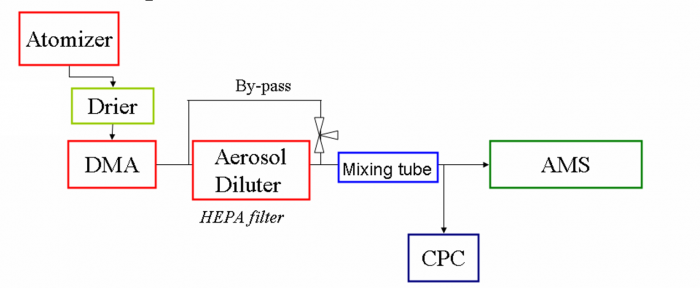
- For comparison with the CPC, it is important that the particles are well mixed across the tubing, and that losses between the point in which the CPC and AMS flows are split and the instruments themselves are very small. For this reason a mixing volume is needed between the output of the DMA and the CPC+AMS, and short sampling lines avoiding sharp turns are needed for this calibration. Also a bypass line as close to the AMS as possible is useful to reduce residence time (and thus losses) on the AMS line.
- Properly drying particles before the DMA is very important. Otherwise the particles may contain water, and when they are selected by the DMA they will contain less NH4NO3 than dry particles of the same mobility diameters. This would cause a low bias in the determined IE. One can look for the particle-phase water signal with the AMS, although the detection limit is typically high due to the high background H2O+ in the AMS vacuum chamber. This needs to be done with the PToF mode, as the BFSP mode is too noisy for H2O+, and the MS mode also responds to water vapor which is difficult to separate from particle-phase water.
- Evaporation of NH4NO3 on the lines is possible, and has been reported by some investigators, especially for long lines or lines exposed to hot components or air. Most of the time however evaporation is not observed. For this reason it is also recommended to keep lines as short as possible, and to avoid exposing the lines to any hot elements, or hot air arising from fans etc. Also for this reason the AMS size measurement should be used to determine the particle size. If the size does not agree with the DMA-selected size, and the AMS has been calibrated with PSLs and is being operated at the same lens pressure as during the PSL calibration, it is possible that this is due to NH4NO3 evaporation on the lines (or wet particles).
2 General Set-up
Figure 1 the diagram for AMS and other instrument setup for IE calibrations (drier can be Nafion or Silica Gel dryer)
- Currently there are two common methods being used, 1, DMA/CPC mass based method; 2, Single particle based method, Brute Force Single Particle (BFSP). Both methods should be used at all times. The DMA/CPC method is very risky as one depends on the CPC counting efficiency and plumbing, and it is easy to have large errors in the IE for this reason. CPCs are notorious for having problems that reduce (or sometimes enhance) the particle counting efficiency. Your CPC should always be checked before calibration by comparing it to at least one other CPC. The CPC is also used in the BFSP method, to provide a comparison to the particle concentration determined with the AMS. This can be critical to uncover problems with the calibration setup.
- The BFSP calibration is only possible with the C-ToF or the V-ToF modes. The number of ions detected in W-mode is way too small for the BFSP calibration. The DMA/CPC mass-based mode can be applied to all ToF-AMS versions.
3 Setting up the AMS DAQ Software for IE calibration
- It is useful to use more than one menu during IE calibration. The menu used for acquisition should generally be used. In addition, it is useful to have another specific calibration menu (a menu similar to the acquisition menu that will be used in the lab experiments or field sampling, but modified as described below) (see Figure 2).
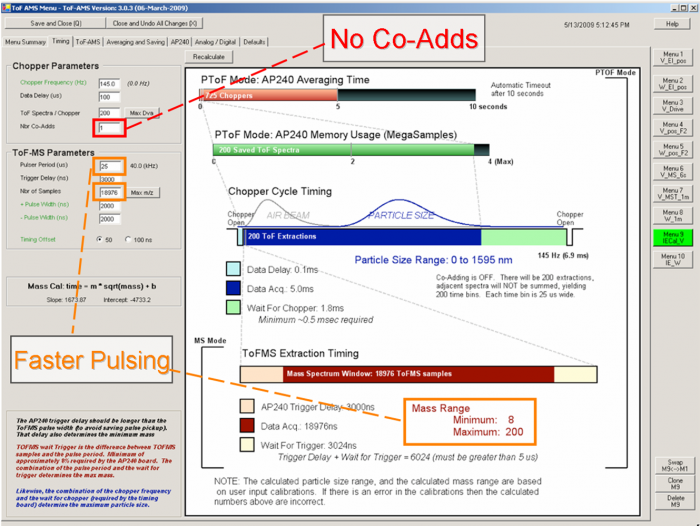
Figure 3 Timing example for IE cal V Menu
♣ Timing tab
- No Co-Adds - This gives better size resolution.
- Faster Pulsing - This increases the actual number of ions measured and improves the probability of detecting a particle, as well as the detected ions per particle (IPP). Pete DeCarlo recommends using the pulsing period of 25 s for V-mode, And the Maximum of m/z AMS can detect will limited within 200. (18,100 samples). Jose thinks that that an even smaller m/z range with a faster pulsing period (e.g. going to m/z 60) is even better. Note that a pulsing period shorter than about 12 us is not allowed by the software, as otherwise you could destroy the pulsers by overheating (this has been “achieved” in the past).
- IMPORTANT:The measured IE value with a menu with faster pulsing will need to be scaled by the ratio of the pulsing period during calibration to the pulsing period during measurement. E.g. if you determine IE = 1e-7 with pulsing of 25 us, and your regular acquisition menu uses 50 us, the IE that applies to your regular acquisition menu is 1e-7*25/50 = 5e-8. (Due to possible confusion arising from this and other similar effects, it is useful to actually use both menus in your IE cal. Then the faster pulsing menu provides better quantification, while your regular acquisition menu provides a check on that quantification).
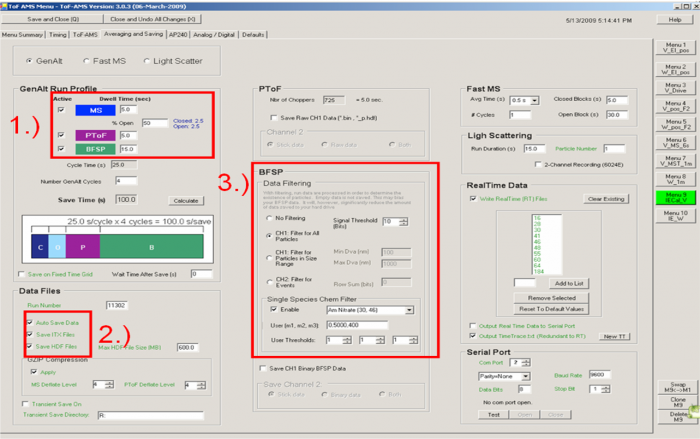
Figure 4 Averaging and Saving example for IE calibration V menu
♣ Averaging and Saving tab
1) IMPORTANT: operate the instrument and save data from all GENALT modes: BFSP, MS, PTOF. Generally we give a larger fraction of the time to BFSP as it takes longer to accumulate the data needed for calibration. For example in Figure 4 we have 5s for MS, 5s for PToF, and 15s for BFSP (60% of acquisition time). The other modes are important for:
- PToF mode: determining the doubly charged particle correction and to detect the possible presence of particle-water.
- MS mode: to apply the DMA/CPC method and to determine RIENH4 since signal-to-noise is highest in MS mode.
2) Save both itx and HDF files; itx files are needed for the IE calibration software, and HDF files are needed for use in Squirrel. (Note from Jose in Aug-2010: I am not sure that saving ITX is still needed. Squirrel only uses HDF files for PToF and MS data).
3) Filter BFSP data for ammonium nitrate particles; so that an excessive amount of data is not saved. This tells the DAQ software to only save BFSP data if an ammonium nitrate particle is detected. The Signal Threshold for the BSFP always is set to 10 bits. (This assumes typical settings for the Acquiris AP240 board in terms of gain (voltage range) and threshold and bandwidth. If the number of particles counted with the AMS vs CPC is not consistent, one could experiment with this threshold. Using a filter as the inlet, you can lower or increase the threshold to a point for which no false particles are counted, but not much above that).
♣ For the Bitwise tab (baseline and SI threshold)
- Check the baseline and threshold. See if it is the same with the one we used in the normal sampling. If not, change the bitwise to match the ambient sampling ones. Prior to an IE cal you need to do a baseline and SI calibration. IMPORTANT: if the baseline, threshold, or SI change significantly and you have data acquired with the old settings (that you care about), you need to do the IE calibration with both the OLD settings and the NEW settings, in order to be able to quantify data acquired both ways.
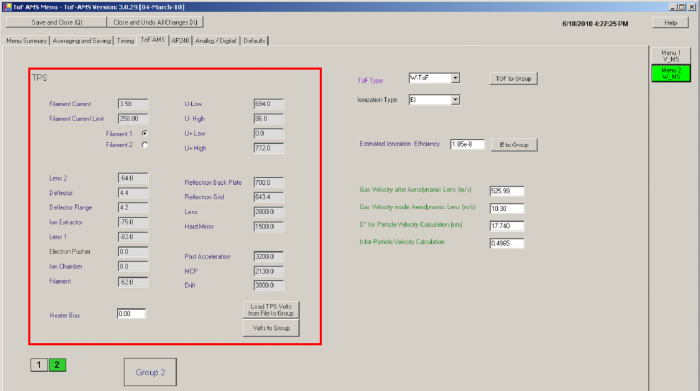
Figure 5 TPS menu tab
♣ For the TPS menu tab
- You need to make sure that all the TPS (TOF power supply) settings in the IE cal menu are the same as for the menu used during normal sampling. If the values are not the same, they cannot be changed in this tab if “TPS remote control” is enabled. In that case you can change them in the tuning tab of the “m/z calibration” window. Consistency with the standard operating menus is most easily achieved by cloning the standard menus and then making the modifications described here.
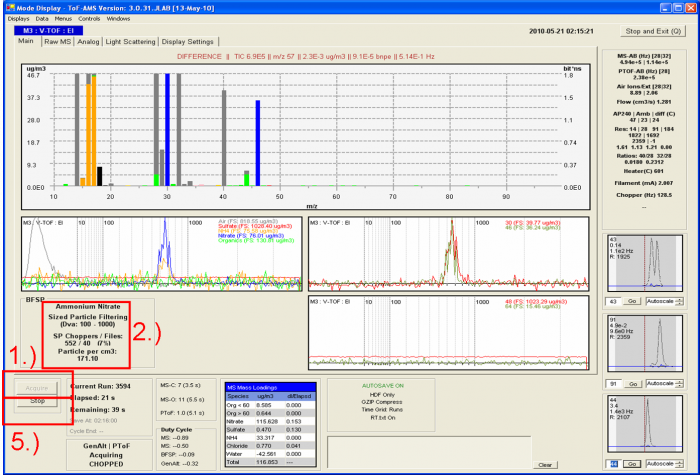
Figure 6 Screenshot during acquisition of IE calibration data with pure NH4NO3 particles
figure 6
For the BFSP calibration
1) Make sure that the experimental setup for the IE calibration is set up properly as shown in Figure 1, and that size-selected ammonium nitrate is being sampled by the AMS.
2) Make sure the SP Choppers / Files is < 5% (depending on the error that you want to tolerate, others would say 10%). This reduces the probability of 2 particles entering the PToF region during the same chopper cycle. For example in the figure above SP_Choppers = 552, meaning that data for 552 chopper periods have been downloaded to RAM memory and the software has determined that only 40 of those (~7%) actually contain signal for an NH4NO3 particle.
3) Take a screenshot or two and paste them into powerpoint, so that you have an easy-to-read (and share with remote collaborators) record of the calibration (Air beam, flow, graphs etc.). Also record all relevant parameters (electronically or in a paper notebook), such as DMA sheath flow, DMA aerosol flow, AMS bypass flow, AMS flow, CPC flow, vaporizer temperature, chopper frequency, CPC screen number, Number co-adds, pulser period, BFSP threshold, MS-AB, SI, Runs, BW (the file name for saving the Bitwise calibration data), MCP value, the AN particle Size for calibration, etc.
4) Wait until particle number acquired in the BFSP mode is above 300 (see the discussion above for the experience behind this number). To check the number of the particles saved look at the particle number which is the last number before “_BFSP” in the file name. Otherwise count all the files which have been recorded in the recent BFSP operation. Another way is to keep an eye on the number of particles detected in the display, but this number gets reset every time data are saved by the software (so you need to sum separately in that case).
5) After 300 files, 300 particles have been saved in BFSP mode, and you can press stop. It is better to record data with more than one particle size, and also to make sure that there is no threshold bias. Afterwards one needs to compare BFSP IE with mass-based IE with different size calibration particles. Details can be seen in Edward Dunleas presentation from AMS User’s Meeting:
http://cires.colorado.edu/jimenez-group/UsrMtgs/UsersMtg7/ie_cal_tutorial.pdf
6) It can be useful to also sample air through a HEPA filter during BFSP calibration to make sure that no “false particles” are being counted..
DMA/CPC-based IE calibration (sometimes known as “mass-based” method)
1) Before sampling ammonium nitrate particles for the DMA/CPC IE calibration, a blank filter sampling should be done first (put the HEPA filter on the inlet to filter particles from room air.). Press “Acquire” and sample the filtered air from the room for 10~20 minutes.
2) Set up the calibration system as shown in Figure 1. Record the CPC into the DAQ software, or otherwise record it manually at regular intervals (it is best if the count rate of the CPC is stable throughout the calibration period).
3) Produce a monodisperse aerosol flow by selecting one particle mobile diameter with the DMA. 400 nm is recommended for V-mode, see discussion above, although the particle size restrictions discussed above do not apply here. However it is important to keep the mass fraction of multiply-charged particles to a minimum. Then continuously acquire ammonium nitrate particle data in MS and PToF modes. Do print screen and record the parameters as described in procedure 3) in the BFSP IE cal.
4) Every 1-2 menu cycles, adjust the needle valve of the aerosol diluter to get different particle number concentrations which can be read from CPC. Note that in this method the number of particles/cm3 can be much larger than 200, since we do not rely on detecting individual particles but rather the total averaged signal from many particles.
5) If it is possible, one can repeat the DMA/CPC IE cal for multiple particle sizes to test if the particle size has an influence on the IE cal results.
6.1 Data processing of IE calibration (for BFSP data analysis)
figure7
- To process the BFSP IE calibration data, use the Igor template which can downloaded from the web at the following link, http://cires.colorado.edu/jimenez-group/ToFAMSResources/ToFSoftware/index.html.
- After opening the software:
1) Find your “BFSPData” folder
2) Find your “AutoSaveData” folder
3) Load your data
figure 8,figure9
4) Press “Graph in New Window” and a new copy Graph named “particle Time of Flight” will show, like the one on the left in Figure 8.
5) Use the Marquee function and right click to select the areas for the IE calibration. There are three regions that need to be defined. One is the “Particle Arrival Region”, the other two are “Baseline Region #1” and “Baseline Region #2”. To mark the “Particle Arrival region” for example, one can use the Igor Marquee to select this region in the green box (Figure 8) and right click to select “Tof IE Calibration-Set Dva Range” .And then there will be dialog box to ask you to define the name of this region (red box Figure 9.
The baseline region is the background region, so the signal in this region should be small and stable (before and after the expected particles arrival signals). It is common to see doubly charged particles in the IE calibration (Black box in the Figure 8). When one selects “Particle Arrival Region”, the doubly charged particles should NOT be included, just select the singly charged particle arrival region as shown in the green box selection in Figure 8.
=figure10
6) Check the SI value, enter the mobility diameter used in the IE calibration (calculated from the AMS size measurement, if the DMA and AMS do not agree, see above).
7) Go through several dozen particles individually using the “particle #” scroll. Setting the min IPP to e.g. 2 is fine to start. Redo the calibration with different values of the minimum IPP and see if the results change. If min_IPP is too low, then some individual particle events will look like noise. If that’s the case, either filter those out manually (“Add to Blacklist” button), or increase the value of min_IPP (check that when you do this, you are not removing some real particles as well). Avoid setting too high of a min IPP as you may miss some real particles.
8) Click “Do It!”
figure11
9) The results from the calculations are the IE for ammonium nitrate, RIE (of ammonium; but you should use the one determined with MS mode), Ions-per-particle, IE/AB, Flow rate and Pulser Period. The IE/AB is the number that should be used for input into the DAQ and Squirrel.
Why should we input IE/AB number? If your pulser period is different for your Calibration menu, then the IE you input will be different than the IE you measured, but your IE/AB will be the same! IEDAQ = IEMeas * PulserPeriodIE/PulserPeriodAcq Or alternatively: IEDAQ= IE/ABMeas * ABAcq Where IEDAQ is the value to input into the Menu in the DAQ software; ABmeas is the air beam measured in the IE cal. AB Acq is the air beam measured in the normal ambient sampling.
10) The histograms show the distribution of ion signals for each m/z, and for each species. Look for anomalous values (very high or very low values) which may perturb the result.
11) Panel 11 above shows the IE and RIE results for each individual particle vs particle number. This can be useful for evaluating whether you have enough particles, as well as to look for outliers (e.g. “particles” affected by cell phone or other noise, etc.)
12) For the W-mode we generally do not determine the IE directly. Rather the W-mode IE can be obtained from the following equation:
figure12
13) The RIENH4 of W-mode needs to be determined from the Squirrel data recorded in W-mode.
6.2 Data processing of IE calibration (for DMA/CPC data analysis)
For the DMA/CPC-based IE calibration data analysis.
1) Use Squirrel to calculate mass loadings with an assumed IE.
2)Calculate mass loadings from CPC number concentrations according to the equations below.
3)Make a scatter plot for the different NO3 mass concentrations calculated from the DMA/CPC vs AMS NO3 accordingly, as shown in Figure 14. Do the linear curve fitting to get slope and intercept.
4)The mass based new IE and RIE can be obtained from the equation in the Figure 15, Pulser period calibration is added also.
5) W mode IE is calculated as in the same way as described in the BFSP data processing procedure 10).
- Theoretical explanation of Mass Quantification with AMS see section 5 of:
Jimenez et al. Ambient Sampling using the Aerodyne Aerosol Mass Spectrometer JGR, 2003(and also review paper of Canagaratna et al., Mass Spec Rev 2007).
- See Edward Dunlea’s presentation from AMS User’s Meeting:
http://cires.colorado.edu/jimenez-group/UsrMtgs/UsersMtg7/ie_cal_tutorial.pdf
- ipf for BFSP IE processing:
http://cires.colorado.edu/jimenez-group/ToFAMSResources/ToFSoftware/index.html#ToF_IE_Cal
Particle Size Calibration
(from Peter DeCarlo's powerpoint) Weiwei will add text here soon.
Principle of Particle Size Calibration
- The AMS reports a vacuum aerodynamic particle size (DeCarlo et al., AS&T 2004) based on a particle velocity measurement. The start of the timing for particle flight begins with the opening of the chopper, and ends with the detection of ions. The Particle Time-of-Flight (PToF) timescale is milliseconds, while the ion time-of-flight is microseconds, which is why we can use the ion detection as our “time end”.
- The relationship between particle aerodynamic diameter and particle velocity can be described by an empirical sizing equation. One can use calibration aerosol of known diameter and density, typically calibrated polystyrene latex spheres (PSLs)or SMPS size-selected NH4NO3 particles to determine the empirical parameters in the velocity equation. For the Vel calibration using PSL is standard procedure, For the special purposes use of AMS data, such as a lab SOA experiment and new particle formation, it may better to also include NH4NO3 particles in the velocity calibration since a range of particles extending to smaller sizes may be desired. The velocity equation is (Jimenez et al., JGR 2003):
       Velocity=(Flight length/Flight Time) = (Vgaslens + [Vgasexit – Vgaslens]) / [1 + (Daero/D*) b]   (1)
         Vgaslens = velocity of gas in the lens (m/s)
         Vgasexit = velocity of gas at the lens exit (~15 m/s).
         Daero = vacuum aerodynamic diameter of PSLs or NH4NO3(nm)
           D* = empirical parameter known as scale diameter (~20 nm)
         b = empirical parameter (typically ~0.5, unitless)
         Flight Length = 0.295 m (short chamber)
         Flight Time = Flight time of PSLs or NH4NO3
In practice the equation has 4 degrees of freedom, but all of our data with PSLs lie in a region which is a line in log space, and can be described with 2 parameters. Thus if one tries to do a fitting with all 4 equation parameters free, many solutions are possible. To remove these extra spurious degrees of freedom, we normally only fit D* and b, while Vgas¬_lens and Vgas_exit are assigned values ahead of time and held constant during the fit.
Calibration setup for Particle size calibration
A)Standard calibration for field purposes (“accumulation mode”)
1) Setup a particle generation system consisting of an atomizer and dryer flowing into the AMS inlet (flow should be vented the atmosphere through a HEPA filter to ensure that the AMS inlet is not pressurized)
2) Use only PSLs: 100, 300, 500, 700, 900nm (below 100 nm they stick together and are very difficult to work with, above 900 nm the transmission into the AMS is low). Mixed solutions can be used such as 100, 500 and 900 nmand another with 300 and 700 nm. (Two or three PSL drops from original package PSL bottles are enough for an 100 ml atomizer bottle. Much more may need to be added for the larger sizes since the solutions have fewer particles). It is a good practice to sonicate the solutions for 5 min before use, ESPECIALLY if they are old. Solutions should be kept in the fridge (but not freezer) between uses, as otherwise bacteria may grow.
Figure 1: Add m/z 51 (maybe also 104, but slower evaporation)for PSLs, or m/z 46 for nitrate in the PTOF display list shown above
3) For PSLs, set vaporizer to 800C (not too hot, don’t leave there too long, or you can destroy the vaporizer). The goal is to have rapid evaporation of the PSLs. Once this is achieved, there is no point in having the vaporizer hotter. Choose m/z 51 (potentially also m/z 104 or other PSL ions) in the PToF mode (Figure 1). For NH4NO3 set the vaporizer temperature to 600℃ (m/z 46 is selected).
4) NH4NO3 (Selected by a DMA) can also be used for calibration. In this case IT IS CRITICAL to first calibrate the DMA with PSLs, as DMAs can be easily be off by several percent (often 10 or 20%) in diameter, and the cube of that error in volume/mass. For example a 5% error in diameter corresponds to a 16% error in mass. Use of ammonium nitrate allows for calibration using particle sizes smaller than 100 nm (more easily than trying to work with small PSLs, which is possible but more difficult), as well as calibration with particle sizes for which you don’t have PSLs. However the PSL diameter is known with much higher precision (resolution of ~100, i.e. uncertainty in size of ~1%), while the DMA selection has a resolution of ~10 (uncertainty of 10%). For the NH4NO3 calibration at low sizes (e.g 60nm), it is necessary to increase the atomizer-produced number concentration to produce a post size selection CPC concentration of as much as 1e4 cm-3, so that adequate mass concentration is detected in the AMS PToF mode.
5)One can create a new menu for the particle size calibration (e.g. named “IE”)
i. For the most accurate size calibration, the time resolution of the PToF data is key. If the regular menu (acquisition) has co-adds = 1, it can be used for size calibration
ii. If the regular menu has co-adds > 1, then it preferable to conduct the size calibration with both the regular menu AND a menu with co-adds = 1
iii.Using a menu with faster pulsing may be advantageous because you get more points in PToF space. Note that there can be small shifts in apparent size calibration when pulsing faster though, so it is best to acquire with both a regular pulsing menu and a fast pulsing menu. One can push V-mode to ~25 us pulser period with an m/z range up to ~200 (you can pulse it at 12 us and still get m/z 51).
B) Acquire the particle size calibration data
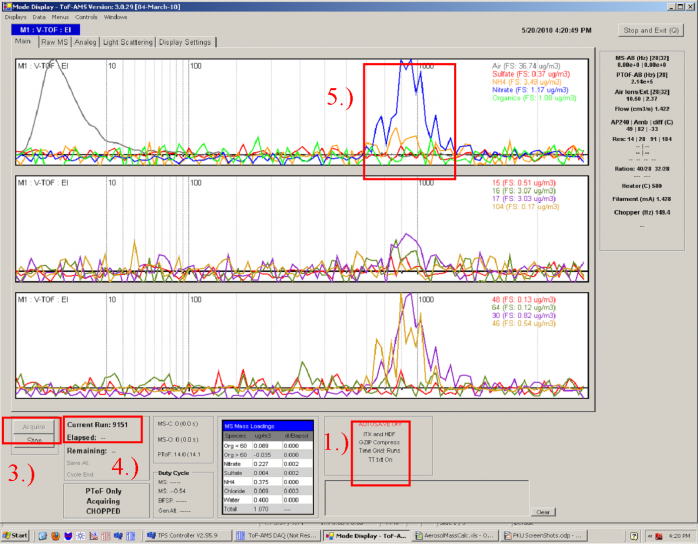
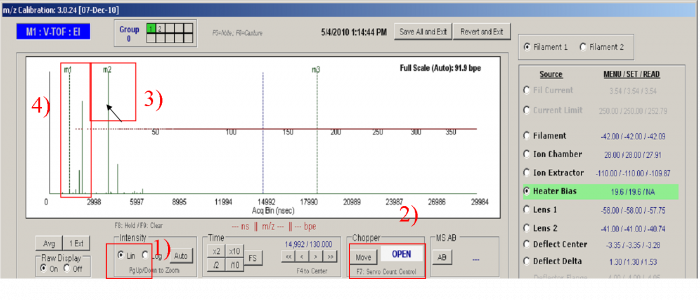
Figure 2 PTOF acquire page layout
1) Make sure that the AUTOSAVE is off (can also be done with autosave, some people prefer this, but operator must ensure that each file saved corresponds to just one particle size – or solution in case of using multiple PSLs at one time). Then the data will be saved manually by pressing the F3 key to save a file, and F5 to reinitialize. And also make sure the ITX and HDF file will both be saved (one can set this in the menu→saving and setting→data files).
2) Check that the pressure in the lens when sampling calibration particles is the same as when doing ambient sampling. If it is not, the size calibration will change, this can be accounted for but it does take some work (see below). Click “PTOF” on the TOF-AMS DAQ Main Menu. Open the page layout as Figure 2 shows.
3)Press “F5” in the keyboard or “Acquire” to acquire the calibration data.
4)Record the current Run number and the detailed information about the this time calibration samples, such as PSLs or NH4NO3, DMA diameter reading, the CPC screen number, Lens pressure (from electronics box and software). It is often useful to save some print screens into powerpoint for easy reference later.
5)Wait until a clear peak (PSL or nitrate m/z) is shown in the PToF screen and the position and height of peak is stable for a while (about 50s or 200 cycles – this will depend on your specific experimental setup, dilution of the PSL solution, etc.). If no clear peak appears for the PSLs, check that the vaporizer is glowing orange. If not, it may not be hot enough, due to vaporizer failure, or a problem with the vaporizer electronics. For nitrate the heater should NOT be glowing, just at regular 600C operating temperature (faint beginning of a glow). Otherwise, too low of particle concentration reaching the AMS is a likely cause of an absence of a PToF peak.
6)Press “F3” to save data. The data will be found in the
file: \\TofAMS\TofAMSData\NonAutoSaveData.
7)Repeat procedure 3 to 6 to acquire data for different size PSLs or NH4NO3 monodisperse particles.
C) When do I need to redo the size calibration?
- The size calibration for a given instrument is ONLY a function of the flow rate (lens pressure). So generally once per campaign is sufficient (or once per critical orifice, if different orifices are used). Once at the start and once at the end of the campaign is good practice, particularly when the instrument is shipped.
It is possible to correct mathematically for small deviations on the flowrate (see Bahreini et al. 2004 in JGR, which has the equations. The equations should be used to calculate the % perturbation on the size cal, and that correction applied to the main calibration).
The data processing of particle size calibration.
- To calculate the particle size in Squirrel one needs the 4 parameters of the standard velocity equation.
- From the PSL data, one has to calculate the empirical parameter D* and b in Equation (1), as well as prescribe V_lens ~ 15 m/s (calculated from the time required for the air stream to transit the lens at 1.4 Torr, don’t need to redo every time) and V_gas ~ 450 m/s (determined in your system using the PToF of m/z 28).
- Thus, the PSLs and NH4NO3 particle vacuum aerodynamic diameter should be known first (remember to calibrate the DMA first when using nitrate test aerosols) and also the velocity in the Equation (1) must be be calculated.
1) For the particle aerodynamic diameter calculation.
The DMA selects particles based on their mobility diameter. Note that we normally want to use particles with a single elementary unit of charge (Q=1). However particles with Q > 1 may also be selected, which are much larger than those with Q = 1. If this is the case, it needs to be accounted for in the processing of the calibration. The mobility diameter can be transformed to vacuum aerodynamic diameter using the general formula shown in Equation (2). The specific conversion for PSLs and NH4NO3 can be obtained from Equation (3) and (4). Further details can be found in DeCarlo et al. (AS&T 2004).
            dva = Dmobility * density * shape factor    (2)
               For PSLs:   Daero = Dmobility * 1.054 * 1   (3)
               For NH4NO3:  Daero = Dmobility * 1.72 * 0.8  (4)
2)For the particle velocity calculation
- The key to calculation of the particle velocity is to obtain an accurate particle flight time in the PToF flight region. There are some effects which need to be kept in mind when calculating the arrival time of particles.
- One is chopper broadening effect which means that the finite with of the chopper opening will broaden the arrival time. I.e. the particles can enter the sizing region at anytime with the chopper slit is open to the particle beam path. The effect increases with a larger chopper duty cycle (open fraction). In reality typically one or no particles enter per chopper opening, but as one averages many chopper cycles the particle flight times average together to form a “square wave” pulse of particles.
- The other is Evaporative Broadening effect, especially for the PSLs. Even with the temperature of vaporizer at 800℃, Evaporation of PSLs still requires a significant time compared to the time-of-flight . This “smears” the signal to longer times, and makes using the “peak” of the signal undesirable.
Velocity calculation procedure for NH4NO3 and PSLs
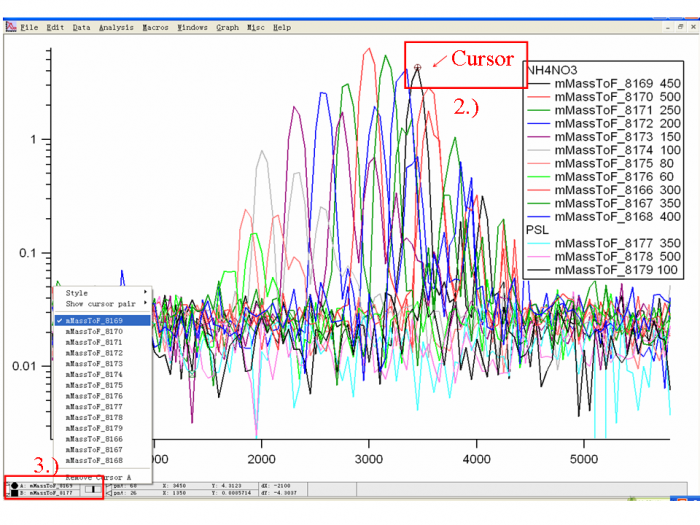
1) Download the particle size calibration data and import into an Igor experiment. Graph all the traces (m/z 46, for NH4NO3; m/z 51, for PSLs) and color code them as Figure 3 shows.
2) Use the Igor Cursor (Ctrl+I) to probe the X value (particle flight time) for each trace (One trace is one experiment, generally one or a few particle sizes).
3) For probing different traces, one can right-click the cursor dialogue to change the trace in which the cursor is sitting.
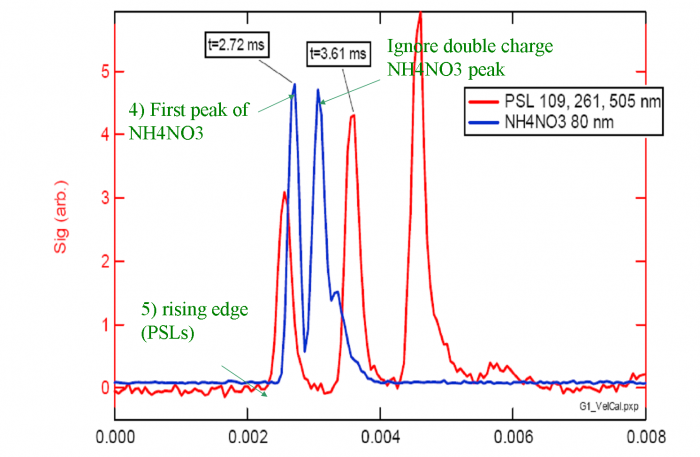
4) For each NH4NO3 trace, the top of the first large peak (Q=1) is the point we are looking for. Ignore the doubly or triply charge particle peaks which occur later in PToF space(as Figure 4 shows).
5) The calibration needs to take into account the evaporation time which is relevant to your experiment. E.g. NH4NO3 particles may evaporate in 50-80 us, which is close to the evaporation times of most ambient particles. PSLs evaporate more slowly than typical ambient particles, and thus a small correction is needed in order to obtain a calibration which is most applicable to ambient particles. 2For PSLs, the point which we know best is the rising edge of the signal (Figure 4) We can then calculate the middle of the chopper opening by adding half of the chopper open time.
       TPSL= Tedge+0.5*(Chopper DC/ChopperHz)
       ChopperDC = Chopper Duty Cycle; Instrument specific: typically 1-4% which can be
       read in the Menu→defaults→chopper duty cycle.
Figure 3 How to read flight time in each trace
Figure 4 A schematic graph for PSLs and NH4NO3 arrival time calculation
6) Calculate particle velocity by Velocity (m/s) =Flight length(0.295m)/Flight Time
7) Make a scatter plot of particle aerodynamic diameter vs. velocity as Figure 5 shows.
Figure 5. Velocities plotted against Particle Aerodynamic Diameter
8)Using the combined PSL/NH4NO3 data set, determine the values of D* and b using non-linear least squares custom fitting in Igor, with “User-defined equation” using Equation (1). The curve fitting function is used as follows:
- Vgas and Vlens are pre-assigned and held as discussed above.
- D* and b are determined with the curvefitting.
  An example of the user-defined function that needs to be used for the velocity calibration is below
   Function PSL(w,dva) : FitFunc
         Wave w
         Variable dva
      // This is a comment with typical values of the parameters
      // Original parameters:
         // w[1]=Vgas = 795
         // w[0]=Vlens = 15
         // w[2]=D* = 3.758(20)
         // w[3]=b = 0.6398(0.4)
    return (w[0]+ ( w[1] - w[0])/(1+(dva/w[2])^w[3]))
   End
In the future we should paste here some screenshots of the Igor fitting window, the results, etc.
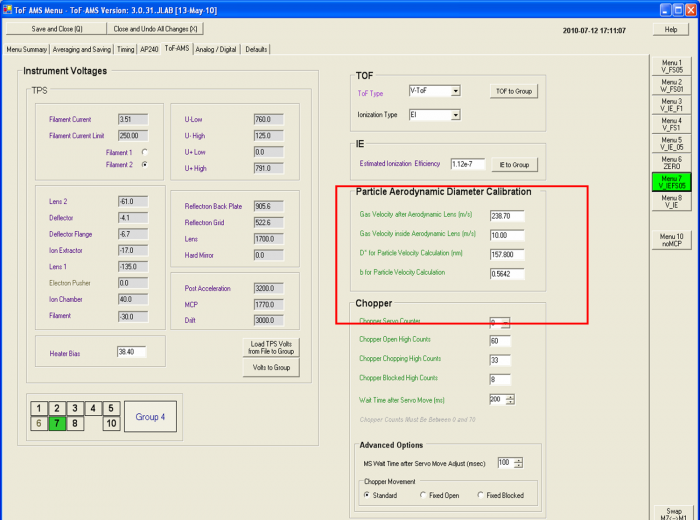
Figure6 Particle Aerodynamic Diameter Calibration window.
9) After determining the coefficients with curve fitting, the user should do two things: First, verify that the calibration equation explains the individual datapoints in the graph. Second, the old parameters should be replaced by the new ones in the AMS DAQ menu window (marked as a red box of Figure 6). If data has been acquired after the size calibration, but prior to inputing the new values in the DAQ software, the new coefficients can be input into the data analysis software (Squirrel). Then you need to redo the corrections for the PToF data (maybe also pre-process, we are not sure).
m/z Calibration in DAQ software
The principle of m/z calibration
- The principal purpose of the m/z calibration is to establish the relationship between recorded ion times-of-flight and ion m/z. The calibration in the DAQ software is based on a 3-point, linear least square fit. To calibrate, a mass spectrum is displayed in time-of-flight space. The user identifies the position of three peaks of known m/z, and the software calculates the linear fit.
- The calculated calibration is used for display purposes throughout the DAQ software. In addition, it is used to calculate the displayed and saved stick values (MS and PToF), and also the airbeam signal, to tune the MS etc.
- SQUIRREL includes a higher order calibration routine. This is generally more accurate than the DAQ calibration, but it requires that the user save raw data. Raw data are always saved in MS mode, but the user decides (through a menu parameter) whether to save them in PToF mode. (WARNING: if your m/z calibration is poor in the DAQ software and you don’t save PToF raw data, you may lose information in PToF that cannot be recovered later).
The procedure to do m/z calibration
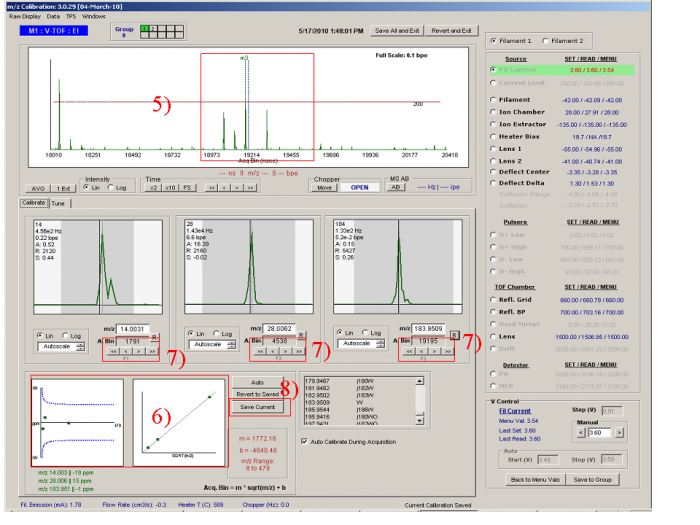
figure 1
- The m/z calibration is based on three user-identified m/z peaks. It is usual to use m/z 14(N+), 28(N2+) and 184(W+). However other ions can also be used as long as they have a strong-enough signal and are dominated by a single elemental composition. Often m/z 40 (Ar+), m/z 149 or 167 or 279 (phthalate background peaks, often but not always present) can also be used. It is good to include a high m/z ion so that the calibration works for higher m/z. If you only use e.g. m/z 14, 28, and 32, then the m/z calibration may not extrapolate well to higher m/z.
1)Set the Y intensity scale to Linear (Ctrl + L, toggle). Make sure the raw display is full scale (Ctrl+A).
2) Move the chopper to the Open position
3) Move the mouse arrow to the highest peak in the m/z raw display which should be N2+ peak. You can double-check the identity of the peak by opening and closing the inlet valve or moving the chopper. The peaks which vary dramatically with valve switching should be N2+ (highest one) and O2+. Once you have made sure that the mouse arrow is pointing to N2+, Press “F2”. A dotted green line with the labels “m2” at the top will mark the position where the mouse pointing. Make sure that the value in the text box below the middle peak contains the exact mass of N2+ (28.00615 ).
4) The m/z=14 Peaks is to the left of N2+(28). One can take the obvious peaks at m/z 15, 17, 18 as reference to find m/z 14, as shown in the figure 1. The N+ peak is very low in signal compared to the N2+ peak. Press “Page Up” and Page down to set the Y-axis intensity to a proper scale. Once the N+ position is confirmed, Press “F1” to move the m1 line to the m/z 14 position. Again check that the value of the m/z below the m1 window is the correct one for N+ (14.00307)
Figure 2
5) Zoom in the area around m/z 184, a tungsten peak (Left click and move the mouse arrow horizontally, then loose the mouse and the raw display will zoom into m/z area in the line length). (Fig. 3) Also press “page up” to re-scale the signal intensity.. One can find the typical tungsten isotope pattern as shown in Figure 2 (m/z 182, 183, 184, and 186 with characteristic fractions). Move the mouse arrow on and press F3. Again check that the exact mass of the ion is entered in the text box below the m3 ion (actually the exact mass for tungsten at m/z 184 is 183.9509 ).
6) If the calibration procedure above is done properly, Red Box 6 should show a good fit in which the peaks line up well (right figure) and the errors in the fit are within the blue lines (left figure).
7) For each peak, the black line indicates the position of the m/z value in time-of-flight space, as calculated from the m/z calibration line. This should align with the maximum of the peak. One can adjust the calibration by using the arrow buttons, arrow keys (up/down/left/right = 1/-1/10/-10), or mouse scroll wheel.
8) Then pressing “Save Current Values”, which will write the current calibration to all menu files in the active calibration group.
How to shut down the AMS
Emergency Shut-Down Procedure(within 5 minutes)
- CRITICAL: Close inlet valve!
- CRITICAL: Turn off the TSP power supply.
- Close the isolation valve between MD1 baking pump and turbo pump2
- (not as critical) Turn off main DC power to Electronics Box
- (not as critical) Turn off main DC power to Turbo Pump Box
Controlled Shut-Down Procedure(Assumes instrument is fully operational)
- Check the AMS instrument status before shut down procedure start, to make sure the AMS could be shut down in control.
- Shut down the flow controller(bypass) which is an extra pump to sample ambient air in a high flow rate.
- Stop sample and exist DAQ procedure.
- Click “shut down all voltage” button in the TSP procedure, and wait until the “all the voltage shut down” appears in the dialogue of TPS. Turn off the power of TSP box.
- Close the inlet valve
- Shut down the power supply of chopper and vaporizer on the Electronic Box, and waiting to drop down the temperature of vaporizer to 70℃, which will takes about half an hour(if time is enough, the temperature should be down as low as possible. Because the non vacuum system will oxidize the vaporizer ).
- Check all the AMS turbo status and record them. Turn off all the turbo pumps and keep the MD1 backing Pump on. The turbo pumps should be allowed to spin down until they stop (~10-20 min for a leak-free system). This Avoids putting additional stress on the pump bearing. If the system is being shut down for venting and must be vented before the turbo pumps have stopped spinning, venting should only be done via the vent port on pump #5 (V301). Open this vent port for just a fraction of a second and let the pumps reach a reduced speed (~ 1-2 minutes) before fully venting to atmosphere.
- After the turbo pumps have fully stopped, close the isolation valve between the MD1 diaphragm pump and turbo Pump2.
- Turn off the MD1 backing Pump. You can touch it to feel the MD1 backing Pump is on or not.
- Stop the power supply of Pump box and electronic box(PB and EB two buttons).
If the outside power failes, it does not need to turn off the UPS. If the UPS consumes all the power, and you want to turn on the UPS, Please wait at least one hour to recharge UPS and then plug in the AMS.
