Difference between revisions of "Size Dist Papers"
From Jimenez Group Wiki
(→2005) |
|||
| Line 57: | Line 57: | ||
*** Does not describe error estimation | *** Does not describe error estimation | ||
** 5 factors: local traffic, nucleation, mixed factors representing secondary and aged primary aerosol, fresh primary aerosol from local combustion sources; stationary combustion sources; remote Pittsburgh traffic, local point sources | ** 5 factors: local traffic, nucleation, mixed factors representing secondary and aged primary aerosol, fresh primary aerosol from local combustion sources; stationary combustion sources; remote Pittsburgh traffic, local point sources | ||
| − | ** | + | **[[File:Zhou_2005_D07S19_fig5.JPG]] |
* '''Dillner, A. M., Schauer, J. J., Christensen, W. F., Cass, G.R., A quantitative method for clustering size distributions of elements, Atm. Env., 39, 1525-1537, 2005.''' [http://www.sciencedirect.com/science?_ob=ArticleURL&_udi=B6VH3-4FC3RN4-2&_user=918210&_coverDate=03/31/2005&_alid=948517069&_rdoc=1&_fmt=high&_orig=search&_cdi=6055&_sort=r&_docanchor=&view=c&_ct=1&_acct=C000047944&_version=1&_urlVersion=0&_userid=918210&md5=91c67f8d6067f85e1243d5b148f518f0 abstract] | * '''Dillner, A. M., Schauer, J. J., Christensen, W. F., Cass, G.R., A quantitative method for clustering size distributions of elements, Atm. Env., 39, 1525-1537, 2005.''' [http://www.sciencedirect.com/science?_ob=ArticleURL&_udi=B6VH3-4FC3RN4-2&_user=918210&_coverDate=03/31/2005&_alid=948517069&_rdoc=1&_fmt=high&_orig=search&_cdi=6055&_sort=r&_docanchor=&view=c&_ct=1&_acct=C000047944&_version=1&_urlVersion=0&_userid=918210&md5=91c67f8d6067f85e1243d5b148f518f0 abstract] | ||
Revision as of 13:24, 20 July 2009
1971
- Lawton, W. H., Sylvestre, E. A., Self Modeling Curve Resolution, Technometrics, 13, 617-633, 1971. pdf
- proposes a 2-factor deconvolution of absorption spectra by a constrained eigenvalue technique that requires no a priori knowledge to solve the components
- constraints include nonnegative spectra and contributions, unit area spectra
- real and synthetic data
- proposes a 2-factor deconvolution of absorption spectra by a constrained eigenvalue technique that requires no a priori knowledge to solve the components
1999
- Yakovleva, E., Hopke, P. K., Wallace, L., Receptor Modeling Assessment of Particle Total Exposure Assessment Methodology Data, ES&T, 33, 3645–3652, 1999. abstract

2001
- Ruuskanen, J., Tuch, T., Brink, H. T., Peters, A., Khlystov, A., Mirme, A., Kos, G. P. A., Brunekreef, B., Wichmann, H. E., Buzorius, G., Vallius, M., Kreyling, W. G., Pekkanen, J., Concentrations of ultrafine, fine and PM2.5 particles in three European cities, Atm. Env., 35, 3729-3738, 2001 abstract
- applies PCA to SMPS, LAS-X, Number conc. in sizes 0.01-0.1 and 0.1-0.5 um, total particle number, and filter absorption (~BC), temp, wind speed, and relative humidity in Erfurt, Germany, Alkmaar, the Netherlands, and Helsinki, Finland from Nov. 1996-March 1997
- 4 factors: ultrafnes, temperature, humidity, PM2.5
- Wahlin, P., Palmgren, F., Dingenen, R. V., Experimental studies of ultrafine particles in streets and the relationship to traffic, Atm. Env., 35, S63-S69, 2001. abstract
- applies COPREM to DMA, CO, NOx, and total # conc. in Copenhagen and Odense, Denmark from Jan - May 1999
- uncertainties for particle number determined from std dev of averages of 10-15 minute data to 1 hr
- 3 factors + offset: non-traffic, petrol+diesel, diesel
- applies COPREM to DMA, CO, NOx, and total # conc. in Copenhagen and Odense, Denmark from Jan - May 1999
2004
- Kim, E., Hopke, P. K., Larson, T. V., Covert, D. S., Analysis of Ambient Particle Size Distributions Using Unmix and Positive Matrix Factorization, ES&T, 38, 202-209, 2004. abstract
- applies PMF and UNMIX to DMPS data in Seattle in winter 2000-2001
- Does not describe error estimation
- 4 factors: residential wood burning, likely secondary aerosol, diesel emissions, motor vehicle emissions
- applies PMF and UNMIX to DMPS data in Seattle in winter 2000-2001


- Zhou, L., Kim, E., Hopke, P. K., Stanier, C., Pandis, S., Advanced Factor Analysis on Pittsburgh Particle Size-Distribution Data, AS&T, 38(S1), 118-132. abstract
- applies PMF to SMPS and APS data from Pittsburgh from Jul-Aug 2001 (nucleation and grown events removed)
- error estimation
- u_h = min(non-0 value, deltaN between two adjacent time steps) (h=size bin)
- sigma'_ij = ((sqrt(x_ih/u_h)+1)u_h
- s_ij = sigma_ij + C3(max|x_ij|,|y_ij|)
- error estimation
- 5 factors: secondary aerosol, diesel truck, traffic aerosol, vegetative-burning-influenced aerosol, nucleation
- applies PMF to SMPS and APS data from Pittsburgh from Jul-Aug 2001 (nucleation and grown events removed)


- Zhou, L., Hopke, P. K., Paatero, P., Ondov, J. M., Pancras, J. P., Pekney, N. J., Davidson, C. I., Advanced factor analysis for multiple time resolution aerosol composition data, Atm. Env., 38, 4909-4920, 2004. abstract
- a model in ME for a data matrix where species were measured with different time resolution
- was referenced by another paper for error estimates
- error estimate = C1+C3*max(|x_ij|,|y_ij|)
2005
- Zhou, L., Hopke, P. K., Stanier, C. O., Pandis, S. N., Ondov, J. M., Pancras, J. P., Investigation of the relationship between chemical composition and size distribution of airborne particles by partial least squares and positive matrix factorization, JGR, 110, D07S18, 2005. abstract
- applies Partial Least Squares (PLS) and PMF to SMPS, APS, PM2.5 species, and gas phase species in Pittsburgh for 5 days in July 2001
- error estimation referenced to Zhou et al., AS&T, 2004
- 11 factors: secondary nitrate I, remote traffic, secondary nitrate II, secondary sulfate, lead, diesel traffic, coal-fired power plant, steel mill, nucleation, local traffic, coke plant
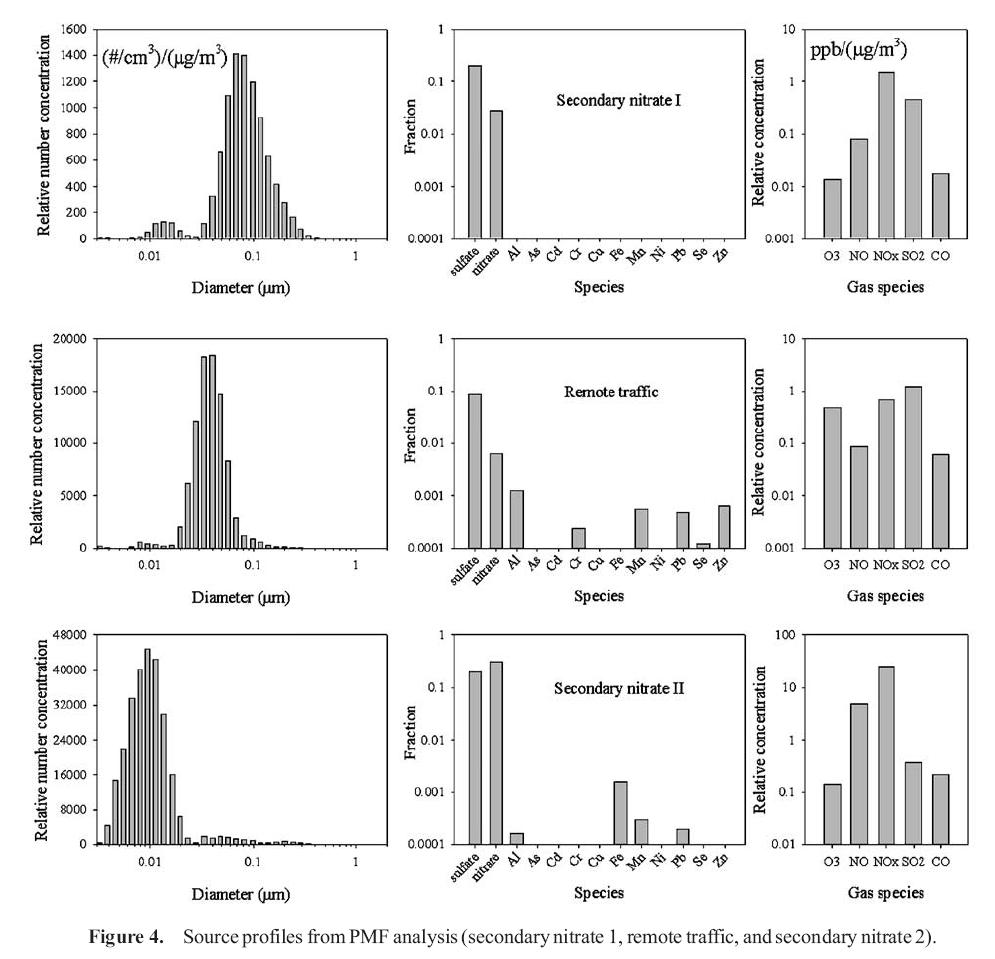
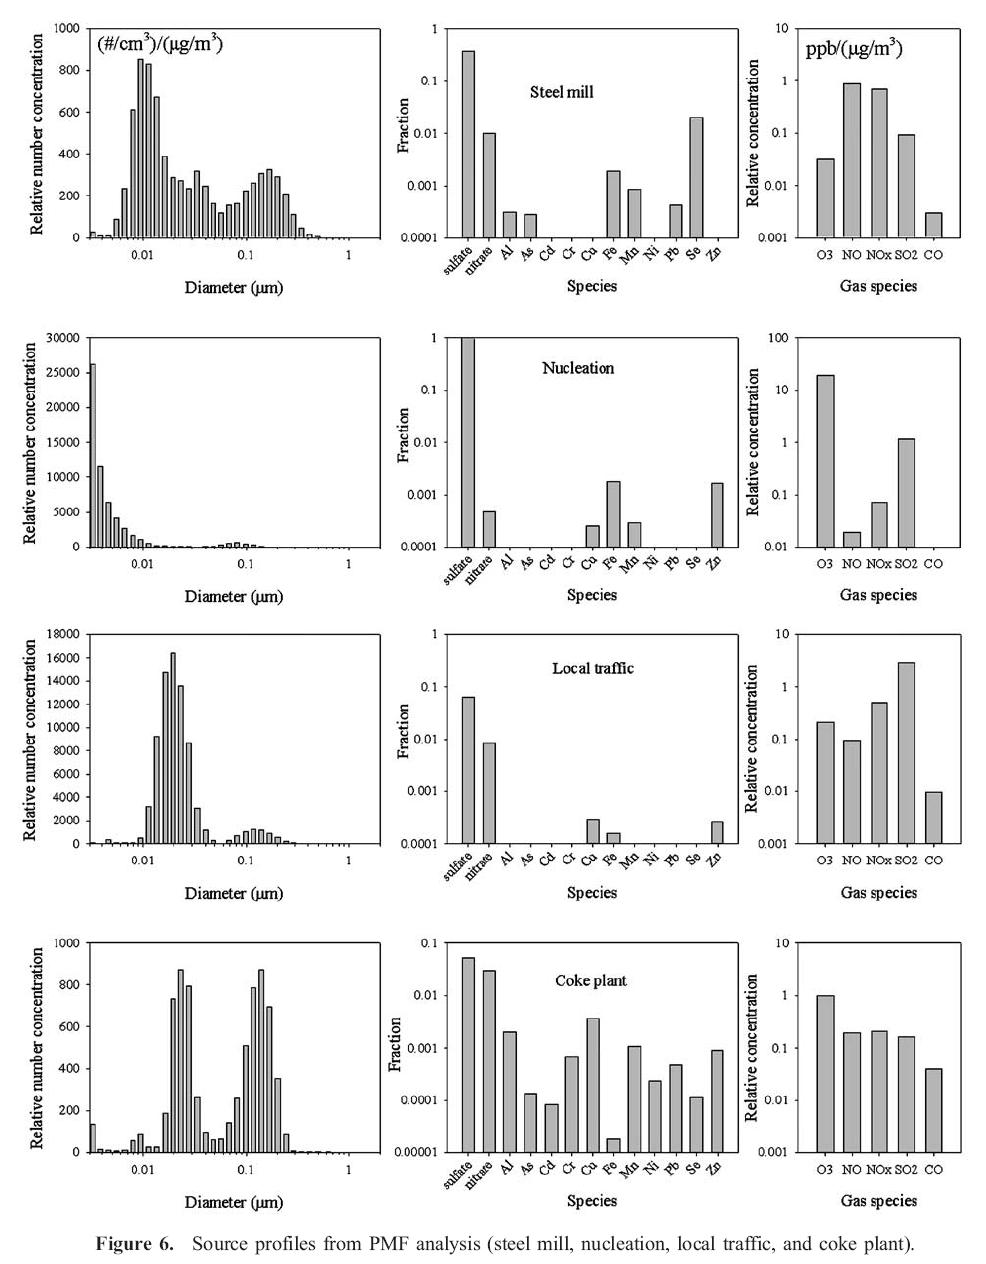
- applies Partial Least Squares (PLS) and PMF to SMPS, APS, PM2.5 species, and gas phase species in Pittsburgh for 5 days in July 2001


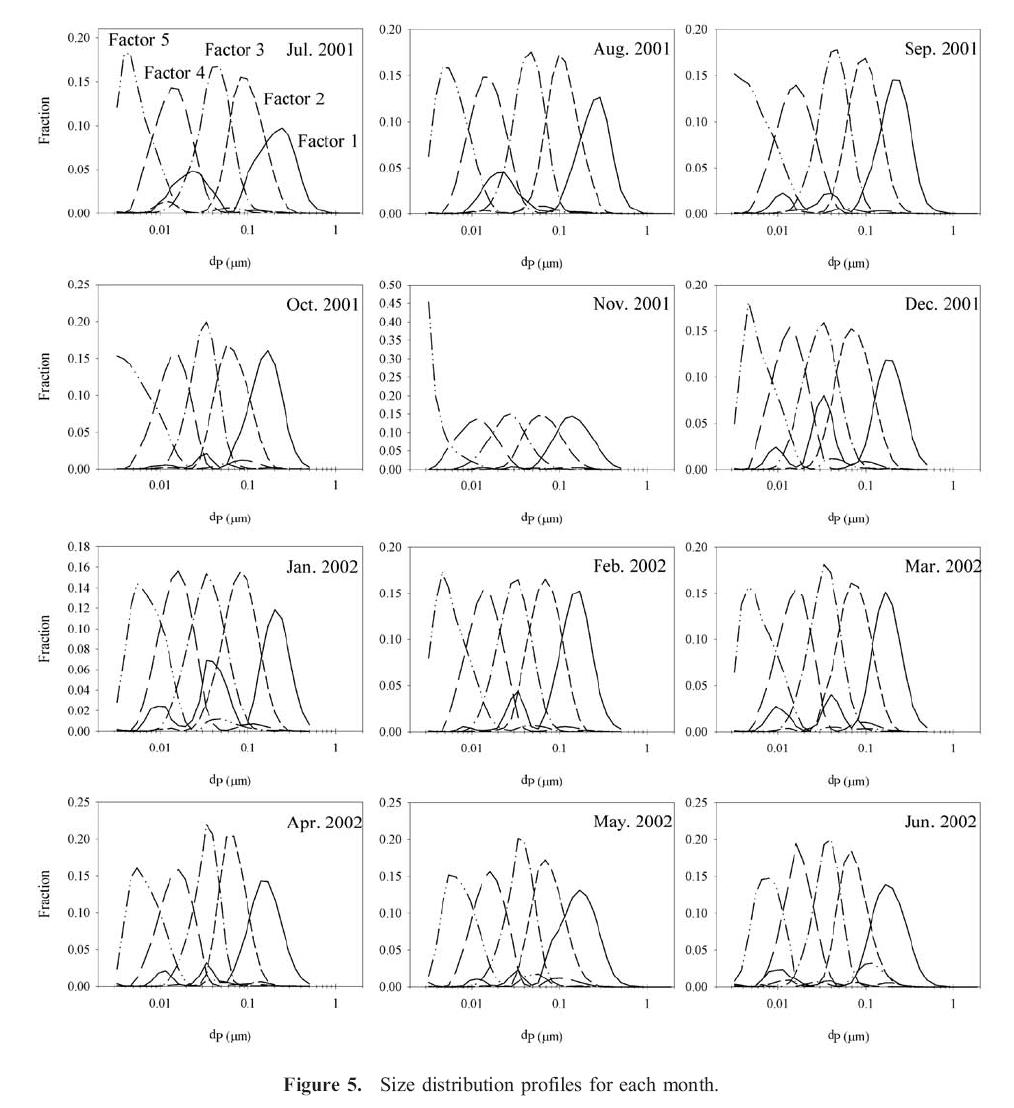
- Zhou, L., Kim, E., Hopke, P. K., Stanier, C. O., Pandis, S. N., Mining airborne particulate size distribution data by positive matrix factorization, JGR, 110, D07S19, 2005. abstract
- applies PMF to SMPS, APS, PM2.5 species, and gas phase species in Pittsburgh for each month (12 mo) from July 2001 to June 2002
- Does not describe error estimation
- 5 factors: local traffic, nucleation, mixed factors representing secondary and aged primary aerosol, fresh primary aerosol from local combustion sources; stationary combustion sources; remote Pittsburgh traffic, local point sources
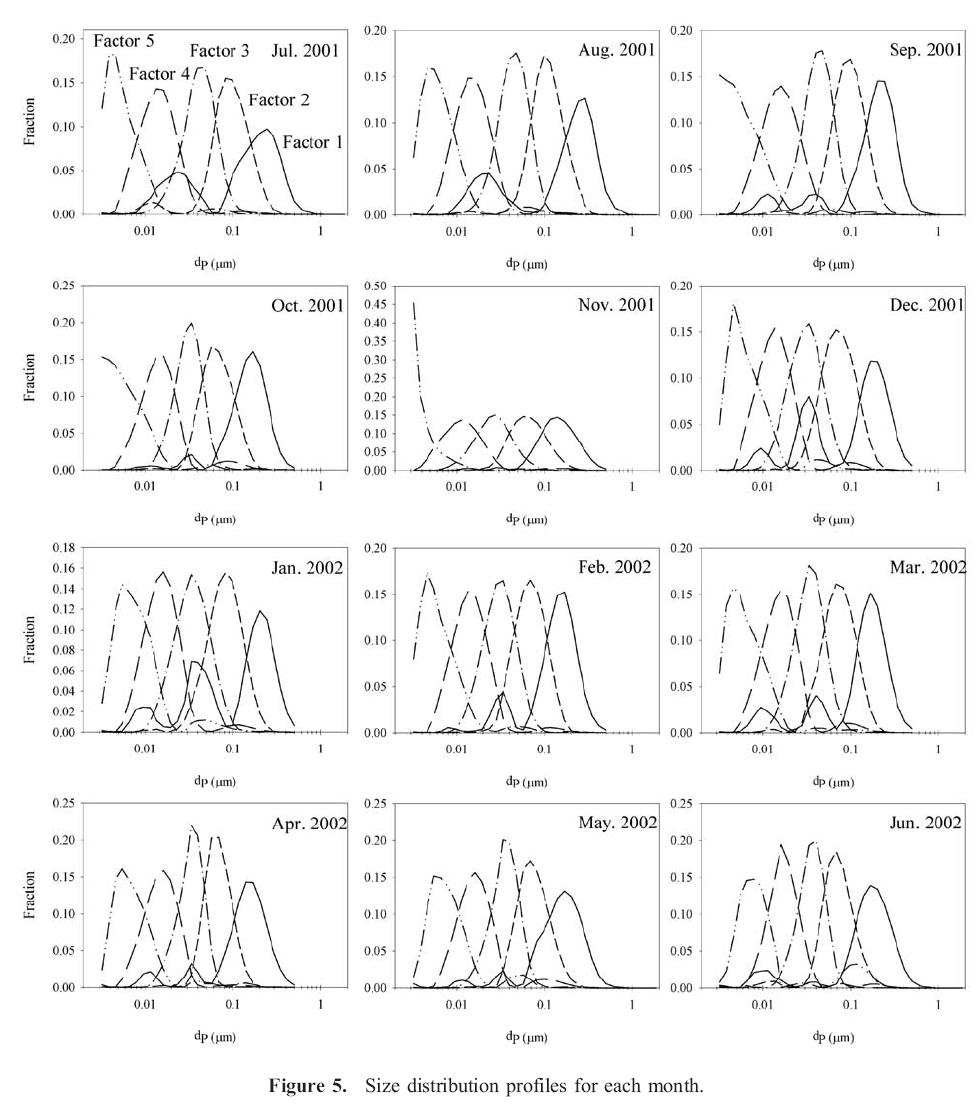
- applies PMF to SMPS, APS, PM2.5 species, and gas phase species in Pittsburgh for each month (12 mo) from July 2001 to June 2002

- Dillner, A. M., Schauer, J. J., Christensen, W. F., Cass, G.R., A quantitative method for clustering size distributions of elements, Atm. Env., 39, 1525-1537, 2005. abstract
- Figs 4-5
2006
- Larson, T. V., Covert, D. S., Kim, E., Elleman, R., Schreuder, A. B., Lumley, T., Combining size distribution and chemical species measurements into a multivariate receptor model of PM2.5, JGR, 111, D10S09, 2006 abstract
- applies ME2 to DMPS, APS, speciated data from from filters (with "missing mass" as a species" in Seattle from Feb. 2000 to June 2003
- error estimation references Kim et al. 2004
- both mass and volume are constrained, and linked by the "average apparent particle density" with Q-terms for mass and volume
- size distributions are downweighted by a factor of 10 to emphasize composition data
- 11 factors: vegetative burning, mobile 1, sulfate rich secondary aerosol, nitrate rich secondary aerosol, oil combustion, mobile 3, aged sea salt, airborne soil, sea salt, mobile 2, metals processing
- Fig. 2
- applies ME2 to DMPS, APS, speciated data from from filters (with "missing mass" as a species" in Seattle from Feb. 2000 to June 2003
- Ogulei, D., Hopke, P. K., Zhou, L., Pancras, J. P., Nair, N., Ondov, J. M., Source Apportionment of Baltimore aerosol from combined size distribution and chemical composition data, Atm. Env, 40, S396-S410, 2006 abstract
- applies PLS and PMF to SMPS, APS, particle species, and gas-phase species in Baltimore in 6 days in July and August 2002
- error estimation sij = sigma_ij + C3 max(|xij|,|yij|)
- 12 factors: oil-fired power plant emissoins, secondary nitrate I, local gasoline traffic, coal-fired power plant, secondary nitrate II, secondary sulfate, diesel emissions/bus maintenance, Quebec wildfire episode, nucleation, incinerator, airborne soil/road-way dust, steel plant emissions
- Figs 3-4
- applies PLS and PMF to SMPS, APS, particle species, and gas-phase species in Baltimore in 6 days in July and August 2002
- Ogulei, D., Hopke, P. K., Wallace, L. A., Analysis of indoor particle size distributions in an occupied townhouse using positive matrix factorization, Indoor Air, 16, 204-215, 2006. abstract
- applies PMF to SMPS, APS data from indoors (townhouse) in Reston, VA in winter 1999-2000
- uncertainty = N_ij(0.01 + C3) + 0.01*N_j_avg; C3=0.4 (chosen by closest to theoretical value); 0.01 by trial-and-error approach
- 9 factors: gas burner use: boiling water; deep-frying tortillas & misc. dinner; citronella candle, combined gas burner/gas oven use: broiling salmon; sweeping/vacuuming; electric toaster oven; traffic-related; wood smoke; pouring of kitty litter
- applies PMF to SMPS, APS data from indoors (townhouse) in Reston, VA in winter 1999-2000
- Figs 5-6
- Han, J. S., Moon, K. J., Lee, S. J., Kim, Y. J., Ryu, S. Y., Yi, S. M., Size-resolved source apportionment of ambient particles by positive matrix factorization at Gosan backgrounds site in East Asia, ACP, 6, 211-233, 2006 abstract
- applies PMF to 19 elements from 8 stages (each stage as a separate PMF analysis) of DRUM sampler data in Gosan, Korea in spring 2002
- does not discuss error estimates
- 15 sources (4-8 per stage): continental soil, local soil, sea salt, biomass/biofuel burning, coal combustion, oil heating furnace, residual oil fired boiler, municipal incineration, non-ferrous metal source, ferrous metal source, gasoline vehicle, diesel vehicle, copper smelter, volcanic emission
- Figs. 4-5
- applies PMF to 19 elements from 8 stages (each stage as a separate PMF analysis) of DRUM sampler data in Gosan, Korea in spring 2002
- Liang, J., Kaduwela, A., Jackson, B., Gurer, K., Allen, P., Off-line diagonstic analyses of a three-dimensional PM model using two matrix factorization methods, Atm. Env., 40, 5759-5767, 2006 abstract
- applies APCA and NMFROC to CMAQ model input and output (simultaneously) from a modeled episode from Dec. 2000 to Jan 2011 in CA Central Valley
2007
- Pere-Trepat, E., Kim, E., Paatero,P., Hopke, P. K., Source apportionment of time and size resolved ambient particulate matter measured with a rotating DRUM impactor, Atm. Env., 41, 5921-5933, 2007. abstract
- applied a 2+1D factorization to a 3D dataset of size-resolved chemical data
- factors are time series (1D); chemical composition x size (2D)
- 9 factors: road salt, industrial (Fe+Zn), cloud processed sulfate, two types of metal works, road dust, local sulfate, sulfur with dust, homogeneously formed sulfate.
- Fig. 3
- applied a 2+1D factorization to a 3D dataset of size-resolved chemical data
- Ogulei, D., Hopke, P. K., Chalupa, D. C., Utell, M. J., Modeling Source Contributions to Submicron Particle Number Concentrations Measured in Rochester, New York, AS&T, 41, 179-201, 2007. abstract
- applies PMF to ultafine size distribution, gases, and total PM2.5 in Rochester, NY to each season from Dec. 2004-Nov. 2005
- uncertainty as s_ij = N_ij*(alpha+C3) + alpha*N_j_avg
- 10 factors: two graffic factors, two nucleation factors, industrial emissions, residential/commercial heating, secondary nitrate, secondary sulfate, ozone-rich secondary aerosol, regionally transported aerosol
- Fig. 5
- applies PMF to ultafine size distribution, gases, and total PM2.5 in Rochester, NY to each season from Dec. 2004-Nov. 2005
- Chan, T. W. and Mozurkewich, M.: Simplified representation of atmospheric aerosol size distributions using absolute principal component analysis, Atmos. Chem. Phys., 7, 875-886, 2007. Abstract
- Fig. 1
- Chan, T. W. and Mozurkewich, M.: Application of absolute principal component analysis to size distribution data: identification of particle origins, Atmos. Chem. Phys., 7, 887-897, 2007. Abstract
- Fig. 2
2008
- Yatkin, S., Bayram, A., Source apportionmnet of PM10 and PM2.5 using positive matrix factorization and chemical mass balace in Izmir, Turkey, Sci. Total Env., 390, 109-123, 2008 abstract
- Figs 2, 4
- Yue, W., Stolzel, M., Cyrys, J., Pitz, M., Heinrich, J., Kreyling, W. G., Wichmann, H. E., Peters, A., Wang, S., Hopke, P. K., Source apportionment of ambient fine particle size distribution using positive matrix factorization in Erfurt, Germany, Sci. Total Env., 398, 133-144, 2008. abstract
- Fig. 2
2009
- Srivastava, A., Gupta, S., Jain, V. K., Winter-time size distribution and source apportionment of total suspended particulate matter and associated metals in Delhi, Atm. Res., 92, 88-99, 2009. abstract
- Fig. 6 (both pages)
- Kleeman, M. J., Riddle, S. G., Robert, M. A., Jakober, C. A., Fine, P. M., Hays, M. D., Schauer, J. J., Hannigan, M. P., Source Apportionment of Fine (PM1.8) and Ultrafine (PM0.1) Airborne Particulate Matter during a Severe Winter Pollution Episode, ES&T, 43, 272-279, 2009. abstract
- Figs 1-2
- Thimmaiah, D., Hovorka, J., Hopke, P. K., Source Apportionment of Winter Submicron Prague Aerosols from Combined Particle Number Size Distribution and Gaseous Composition Data, Aerosol and Air Quality Research, 9, 209-236, 2009. Issue Table of Contents
- Fig. 2
- Beddows, D. C., Dall'osto, M., Harrison, R. M., Cluster Analysis of Rural, Urban, and Curbside Atmospheric Particle Size Data, ES&T, 43, 4694-4700, 2009. abstract
- Fig. 1, 2
- Karanasioua, A.A., Siskos,P.A., Eleftheriadis, K., Assessment of source apportionment by Positive Matrix Factorization analysis on fine and coarse urban aerosol size fractions, Atm. Env., 43, 3385-3395, 2009. abstract
- Fig. 4 (both pages)
- Gietl J. K., Klemm, O., Source Identification of Size-Segregated Aerosol in Munster, Germany, by Factor Analysis, AS&T, 43, 828-837, 2009. abstract
- (no figs)
- Amato, F., Pandolfi, M., Escrig, A., Querol, X., Alastuey, A., Pey, J., Perez, N, Hopke, P. K., Quantifying road dust resuspension in urban environment by Multilinear Engine: A comparison with PMF2, Atm. Env., 43, 2770-2780, 2009. abstract
- Fig. 2