- Undo (Command- Z):
-
Disabled in this program.
- Cut (Command- X):
- Disabled in this program.
- Copy (Command- C):
- For available windows (same as for Print..., described above)
this copies the active window to the clipboard; it can then be pasted into
graphics programs like MacDraw and Canvas and editted to produce a publication
quality plot, if desired. Note that several characteristics of the copied plot
can be controlled by settings in the "Extras..." dialog below. Some problems have been noted with copying to some programs.
- Paste (Command- V):
- Disabled in this program.
- Select All (Command- A):
- Selects all of the demag steps of the current sample.
- Select None (Command- D):
- Deselects all of the demag steps of the current
sample.
- Select Points/Identify Points:
- Only active when the Zijderveld or Equal Area
window is active. Allows interactive selection and deselection of steps using
the mouse in the Zijderveld and Equal Area windows when "Select Points" is
chosen (the menu item will become "Identify Points"
and the cursor will be a crosshairs in the Zijderveld and Equal Area windows)
as an alternative to selecting points in the Data List window. Clicking on a solid
(selected) point will deselect it and clicking on a gray (deselected) point
will reselect it. Making another window active, selecting "Least Squares
Fit...", or chosing "Identify Points" will update the selection matrix, refresh
all windows to reflect the newly selected points, and revert to "Identify
Points" mode (menu now says "Select Points").
- Extras... (Command- E):
- Direct editing of various screen parameters and
dimension limits. This is pretty self-explanatory; the upper part of the
window controls the size of symbols and text on the screen, when copied to the
clipboard, and when printed in pixels and points, respectively. The "% of full
page" controls any enlargement or reduction of the screen when copied or
printed; this is non-intuitive but is easily illustrated. If you wanted the
highest resolution when printing to a LaserWriter but wanted the same
proportions as in the displayed window, you'd use the settings illustrated
below. When you printed a screen, you would set the reduction to "25%" in the
appropriate LaserWriter box and your final output would have symbols and text
at the correct size. Similar arithmetic would apply to the Clipboard; you
should note that the clipboard at 100% is the same size as an 8 1/2" by 11"
output (it is not the same size as the window on the screen). You can attach
IDs to each point by checking the appropriate box (as for the Clipboard in the
example). The form of the IDs is the same as that displayed in the upper left
part of the window when identifying points on screen.
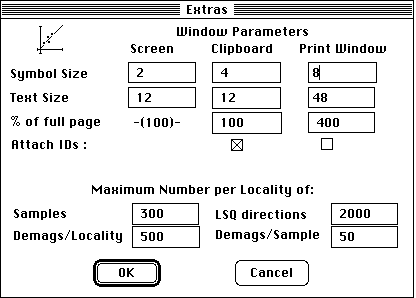
The bottom part of this dialog box controls the maximum number of elements
permitted in the program; these numbers are saved in the programs resource fork
and are used until reset. Any arrays dimensioned before this command is
invoked remain unchanged; quitting and restarting the program will correctly
dimension all arrays. Note that the SIZE resource (the box you can set in the
lower left of the "Get Info..." box for PaleoMag) is unaffected. If you use
large data sets or lots of plots at once, you will probably have to increase
the value of the SIZE resource.
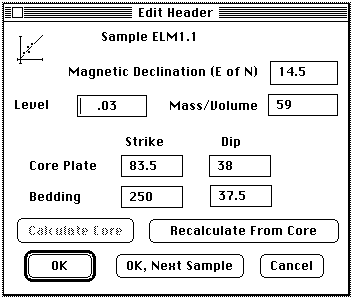
- Headers...:
- Permits editting of header information. This brings up a dialog
box (illustrated below) where the sample stratigraphic level, mass (or volume),
core plate orientation, or bedding orientation can be changed. Once either
"OK", "OK Next Sample", "Recalculate Core" or "Recalculate from Core" is
clicked, the changes are incorporated into the data file and all relevant
directions are updated in both the data file for that sample and any
least-squares fits for that sample in the .LSQ file. (At present, altering
core plate or bedding orientations can produce some slight differences in the
tilt-corrected least squares direction from that that would be obtained by
refitting the same measurements with the Least Squares command. This is
probably reflecting some minor numerical difficulty somewhere--the differences
are about 1°ree; in orientation--but might produce confusion in some cases). If
either "OK" button is pushed, only the data dependant on the orientations
changed will be altered. Pushing "Recalculate from Core" forces all
directional data to be recalculated from the most primitive data available
(core coordinates if present, otherwise geographic coordinates converted back
to core coordinates) using the values displayed. Only enabled when no core
directions are available, the "Recalculate Core" button will calculate core
directions from the geographic directions; these core directions will then be
considered the "raw" data if, say, a recalculation from core is done.
"Recalculate Core" will not recalculate any existing measurements. Note that
this option (and the "OK" options if the core plate orientation is changed)
will create and save core coordinate data if not originally present. Core
directions, once present, will never be altered by use of any of these options
and could only be changed by manually removing them from the sample files.
The magnetic declination option differs a bit from the others because it
applies to all the samples at the locality. Changing this will cause all of
the declinations in all the files to be changed. Note that files not listed in
the .SAM file are inaccessible to PaleoMag and would not be changed, so be sure
that all files are listed in the .SAM file before using this option.
- Equal Area Options...:
- Provides customization of the tic marks and reference
directions used in the equal area plots (see below). Major tick marks are
placed around the circumference of the equal area plot every n degrees (n is
90°ree; in the example). Minor tick marks are placed every m degrees (m =
30°ree; in the example) starting from the last major tick mark. This
will result is strange tick marks if m will not divide n evenly. Inclination
tic marks are placed every p degrees from the horizontal going down to the
nadir of the plot.
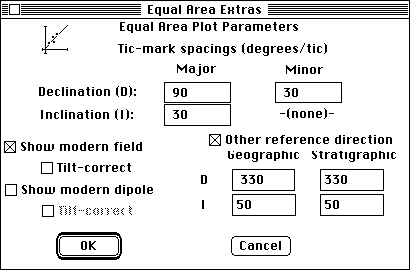
The bottom half of the dialog concerns the reference directions displayed on
all equal area plots (except those using core coordinates). Each selected
direction will be displayed: modern field as a circle, modern dipole (i.e.,
magnetic declination of 0°ree;) as a square, and the other reference field as a
triangle. These directions are 1 1/2 as large as data symbols, are gray on the
lower hemisphere and open on the upper hemisphere. The "Tilt-correct" option
for the two modern fields will use the mean strike and dip of the locality
(stored in the .SAM file and calculated by PaleoMag if not present) to tilt the
modern field into a mean stratigraphic orientation when viewing in tilt-corrected coordinates; if not selected, the
direction will be the same in both geographic and tilt-corrected frames. The
reference direction is entered by the user directly for both geographic and
tilt-corrected coordinates. In this example the direction is 330°ree; declination,
50°ree; inclination in both plots.
- Colors...:
- This dialog permits the user to assign any desired mapping of color
to the features of most of the plot types in PaleoMag. Note that it is a bit
dangerous to use some colors as foreground or background colors on a
black-and-white Mac as some things might vanish. Even on a black and white
machine this option can be useful, as newer drivers for the Laserwriter permit
a mapping of colors to grayscales when printing.
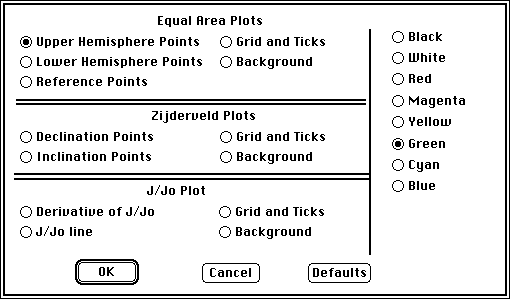
Operation is simple: click on the desired plot element on the left and then
select the desired color on the right. User choices are preserved in the
PaleoMag program (which means this will not work if the disk PaleoMag is on is
locked).
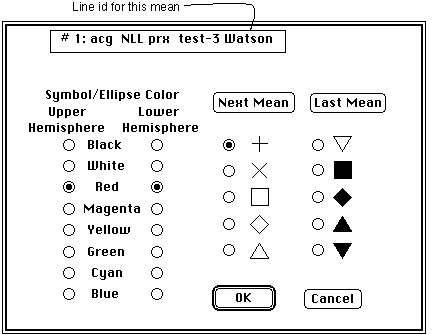
- Means Colors...:
- For selecting colors and symbols used in plotting mean
directions on equal area plots with uncertainties from the current means file.
This option is disabled unless some means have already been selected (see
"Locality Means..." under View menu). The line identification for the mean
direction affected is at the top of the dialog. Three parameters are chosen
for each direction: color if in the upper hemisphere, if in the lower
hemisphere, and the symbol plotted at the locality mean. Note that upper
hemisphere features are, as always, plotted in gray. Changing the colors for
other currently selected mean directions can be accomplished by hitting the
Next Mean or Last Mean buttons.