 |
|
A winning proposal for the Innovative Research Program, 2008: Investigating the Ubiquity of Small-Scale Turbulence in the Atmosphere with Implications for Atmospheric Modeling and PredictionInvestigators: Ben Balsley, Lakshmi Kantha (Aerospace Engineering), and Allen White (NOAA/ESRL) Turbulent diffusion and transport in the atmosphere are vital to the prediction of the state of the atmosphere and are at present poorly parameterized in global climate and weather forecast models. A major reason for this lies with the paucity of turbulence measurements in the troposphere and the lower stratosphere (0-30 km). We propose here a methodology to remedy this shortcoming. Recent work1 by our group has shown that small-scale turbulence in the lowest few kilometers of the nighttime atmosphere is surprisingly ubiquitous, strongly structured, and extremely variable. We have shown further that a robust measure of turbulence generation in this region, the gradient Richardson number (Ri) defined as, Ri(Δz) = N2/(ΔU/Δz) 2 (1) is extremely sensitive to the vertical scale over which the determinations are made. Here ΔU/Δz is the vertical shear in the wind speed, N2 is the Brunt-Väisälä frequency [(g/T)(ΔT/Δz)], and Δz is the height increment over which a calculation is made. Specifically, Ri estimates on vertical scales of length L, show Ri ≤ 0.25 (i.e., the nominal value where the region becomes unstable) occurs only for L ≤ 60-200 m. This is a very significant point, since conventional atmospheric modeling estimates of Ri are made at larger scales. Thus, models typically show the atmosphere to be dynamically stable and hence non-turbulent, while (based on the above) it is, in fact, unstable and turbulent. We have begun to extrapolate this lower-atmospheric technique to include the entire troposphere and stratosphere. Unfortunately, the best available untethered balloon data have relatively poor vertical resolution. While useful, these data are incapable of resolving the smaller scales where Ri could be ≤ 0.25. This limitation is illustrated in Figure 1, which shows profiles of wind speed and temperature, along with a profile showing the largest vertical scale having Ri values ≤ 0.25 between 0.1 km and 20 km. This third profile is based on the above technique using concurrent wind speed, temperature, pressure, and humidity profiles from twenty-three contiguous 800-m vertical slabs of atmosphere. Briefly, Ri values were determined over vertical scales between ~ 28 m and 500 m for each slab using the above definition of the gradient Richardson number. 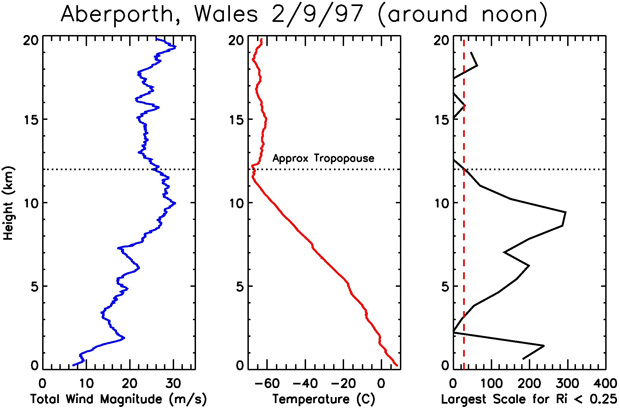
Figure 1 Profiles of wind speed and temperature used to examine the gradient Richardson number Vs vertical scale size using (1). The largest unstable scale for each height interval is illustrated in the right-hand panel. All scales less than this value in each slab are unstable. The dashed red line shows the smallest scale that can be resolved using the existing data set. Examination of Figure 1 shows that almost the entire troposphere below 12 km is unstable at scales between roughly 28 m and 300 m. For example, in the 9000-9800 m height interval, the region is unstable on all vertical scales smaller than 300 m, while the remaining heights are unstable below somewhat smaller scales. The only height interval showing an irresolvable critical scale size is the 1800-2600 m region, which is plotted here as a zero-valued critical scale size. While virtually the entire troposphere in Figure 1 appears to be unstable on some scale, this statement does not hold for the stratosphere, at least when using the current data set. The stratospheric portion of this profile above about 12 km indicates that the majority of the height ranges appear to be stable down to the smallest resolvable scale. Note, however, that the dashed vertical red line in the third panel near 28 m on the abscissa delineates the smallest resolvable scale size using the current data set. Thus, it is impossible to say whether the six values lying to the left of the dashed red line are truly stable on all scales or are merely unstable on scales < 28 m. To determine this requires a higher-resolution data set. The results in Figure 1 are roughly representative of the few upper-level data sets analyzed to date. Individual profiles show significant variability with frequent occurrences of zero-valued critical scale size. In any case, these results challenge the conventional wisdom that the atmosphere is, by and large, in laminar flow, with only occasional regions of turbulence. The significance of this statement lies primarily within the modeling community. Informal discussions with members of this community agree that: (1) turbulence transport and diffusion are poorly parameterized in GCMs and weather models, and (2) the inclusion of an average value of an enhanced turbulence diffusivity/viscosity term in these models would be important and could significantly improve predictability. Just how that would be best done at this point remains an open question. Based on the above discussions and the modest success of the initial study illustrated in Figure 1, we propose to produce a small series of similar profiles using significantly better resolution. To better connect with the community involved in small-scale processes, we are cooperating with Professor Lakshmi Kantha (Aerospace Engineering) in this effort. Professor Kantha, who has an extensive background in small-scale dynamics in both the ocean and atmosphere, has been in contact with the Väisälä Corporation near Boulder, who provided balloons and sensors for the original measurements. Discussions with Väisälä representatives suggest that we can improve the earlier measurements by a factor of three or four by reducing the current ascent rate of about 5 m/s and sampling faster than the current rate of 0.5 Hz. Unfortunately, the telemetry receiver required for data acquisition costs ~$65k. However, Dr. Allen White of NOAAs Earth Systems Research Lab, who has the requisite receiver, has agreed to join in this effort. Dr. White is a meteorologist and a leader in the innovative use of new technology and has experience in the use of Väisälä systems. He points out that, due to other commitments, the receiver and technician will be available in Boulder only from late April until the end of May, 2008. We plan to launch 20 radiosondes over a period of a week or two to a height of roughly 25 km, with the intention of sampling the atmospheric column at a vertical resolution of about 2.5 m. The sonde is expected to take nearly 3 hours to sample the atmospheric column. Measurements would be made during this spring at a site near Boulder. The resulting profiles will be analyzed to demonstrate the ubiquity of dynamical instability at small scales and hopefully change the paradigm when it comes to modeling turbulence in the atmospheric column. Incidentally, Professor Kantha has come up with a technique2 to deduce turbulent dissipation rate and mixing coefficient from high-resolution temperature and humidity measurements from radiosondes and this data set will also be used to improve our understanding of turbulent mixing in the free atmosphere. The analysis would be completed and a journal paper submitted within a year after the data is collected. A future NSF proposal based on successful results is anticipated. References: |