Post Seismic Sea
level measurements, Haiti
5-28 March
2010
Installation
and initial data
Roger Bilham
University of Colorado,
Boulder CO 80302
Summary Five pressure-sensing sea
level monitoring devices were installed in Haiti in two visits 5-9 th and 24-28th
March 2010. Fifteen-minute sampled
graphic and numerical data with a resolution of 1 mm are publically available
at http://www.datagarrison.com, name
"geo" password "hobo" within 2 hours of real time. The data provide a time history of
post-seismic vertical adjustments following the 12 January Haiti earthquake,
and provide an absolute datum from which to measure the elevation of coral
microatolls. Preliminary results show the epicentral area t be rising still. The data also provide a precise template
for examining the elevation of uplifted sea-level notches raised in this, and
in former earthquakes.
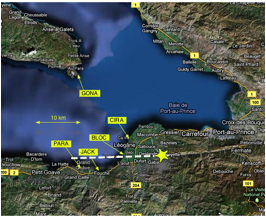
Fig.1 Tide Gauges, epicenter (star) and the
approximate location of the subsurface fault , Haiti
'Table 1 Location of tide gauges , Haiti
|
Site |
Location |
North |
West |
Transmitter |
data
logger |
Stevens
# |
sample
sec |
|
GONA |
Petite
Gonave |
18.70420 |
72.80496 |
Iridium |
energy
pro |
193888 |
44s
direct |
|
CIRA |
Ca
Ira |
18.52499 |
72.65077 |
Iridium |
microstation |
196728 |
180s
piezo |
|
BLOC |
Beloc |
18.47886 |
72.66727 |
none |
microstation |
196730 |
180s
piezo |
|
JACK |
Gros
Jacques |
18.43027 |
72.74943 |
Iridium |
energy
pro |
193887 |
44
s piezo |
|
PARA
|
Jeanty
les Baines |
18.43168 |
72.76044 |
Iridium |
microstation |
196728 |
60
s direct |
Scientific Motivation
The 12 January earthquake produced no surface
rupture, consistent with Insar imagery and teleseismic inversion that suggest that rupture terminated
2-4 km below the surface. Three
interpretations are possible: that
slip in this 2 km shallow subsurface region occurred prior to the earthquake as
aseismic creep, that slip is currently occuring in this region as afterslip,
and that slip will be released in a future earthquake. The tide gauge measurements are designed
to address the second two of these possibilities. The magnitude of this future
earthquake would be Mw=6.5 if it consists of a 4x35 km patch of the Enriquillo
fault that slips ≈2 m, or the apparent deficit could be released as part of a
larger earthquake.
Tide Gauge Operation
The
sensor in each tide gauge is a Stevens Pressure transducer moulded to a 10-13 m
length of electrical/pressure-equalization cable vented to the atmosphere. The capillary vent permits sea floor water
column pressure to be monitored independent of atmospheric pressure. A
dessicant trap ensures that the capillary tube is not blocked by condensation.
The resolution is 1 mm and the range 3 m.
Power to the sensor is applied from a 18 volt lithium battery via a
current loop for 30 ms every 1-3 minutes. The resulting samples are digitally
averaged and recorded every 15 minutes by either a 12 bit Onset Energy Pro data
logger or by an 12 bit Onset Microstation equipped with an A-D current
converter. The data logger is
interrogated every two hours by a Solar Stream transmitter that uploads the
accumulated data to the Iridium satellite system which forwards the data to a
publically accessible web site where the data are available in calibrated
engineering units (cm of sea level rise) and local time (GMT-5 hours).
Data Access
https://datagarrison.com/ user--geo password--hobo Click on site name.
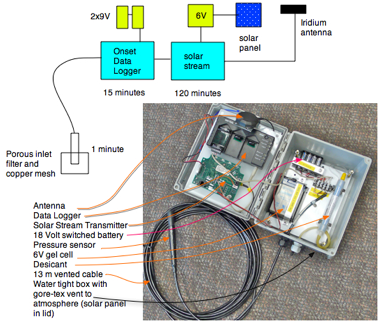
Fig
2 Schematic electronics for
logging and transmission, and interior
view of transmitter box connected to 10 m of transducer cable.
The
system is designed to operate for a year unattended at temperatures up to 50°C.
Description of Tide Gauge
Installations
See Table 1 for coordinates and general
specifications. Each tide gauge is designed to operate for a year unattended
with maximum 2 hour latency telemetry, with the exception of BLOC whose data
must be retrieved manually. GONA
and PARA measure sea level directly with minimal hydraulic filtering, and the
central three are installed in beach sand close to the shore, and measure
piezometric pressures that closely follow sea level with a filtering time
constant of approximately two hours.
GONA, Petite
Gonave, SE of the island of
Gonave. 18.70420, 72.80496
The instrument is located 200 m north of the island
village of Petite Gonave at the SE end of Gonave Island. The island lies outside the zone of
deformation affected by the 12 January earthquake. The sensor is supported by a galvanized steel ell-girder
bolted to a vertical face of in-situ bedrock in a small cleft in the coastal
limestone. The gauge is sheltered
from direct wave impacts, and faces the mainland from the small island on which
Petite Gonave has been constructed.
It has no hydraulic filter but samples sea level every 44 seconds,
storing a digital average every 15 minutes which is transmitted every 120
minutes via the Iridium satellite.
The limestone above sea level proved sufficiently hard to blunt
tungsten-carbide drills and it was necessary to secure the cable without the
benefit of clamping bolts through karst holes and cracks to protect it from the
disturbance.
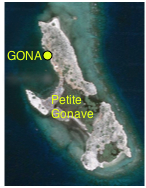
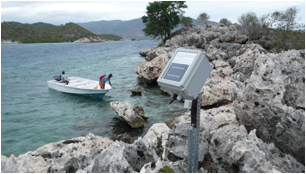
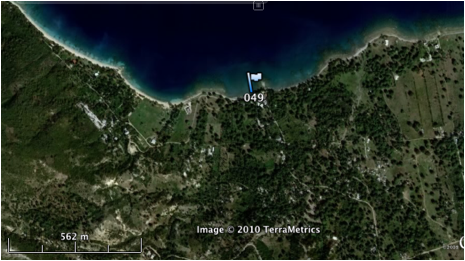
Fig. 3. The island and village of Petite Gonave lies
at the SW tip of Gonave Island. At the latitude of the tide gage station Petite
Gonave Island is approximately 100 km east west. The rocks of the island are a
silicious limestone exhibiting at sea level a prominent, deep solution notch
with no evidence for recent changes in sea level.
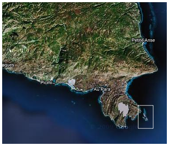
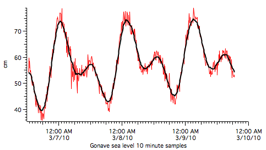
Fig. 4 Location of Petite Gonave Island and first
three days of data from GONA
The transmitter is located 3 m above sea level on
the exposed (knife-edged) eroded coral limestone. It uses a single box for data logger, transmitter and
antenna, as illustrated in Figure 2, inclined at 45° to the south, and uses the
12 Volt internal supply of an Onset Energy Pro datalogger, and a bank of 4 AA
lithium cells to generate the 18 V that powers the current loop. These batteries will last about 15
months, but should be replaced after a year (March 2011). The 6V solar panel
powers only the iridium transmitter.
Two channels of data are transmitted - the internal power of the data
logger in volts and sea level converted at the tide gauge to sea level in cm of
water density 1.03. The downloaded binary data are in GMT and the calibration
constants can be examined when opened in Onset's Hoboware software. The transmitted voltage must exceed 12
V for correct operation. In
principle the entire ystem could be arranged to run indefinitely from solar
panels, however, its clock drift may reach 1 minute per month, and it is
considered desirable that it be reset at yearly intervals. The instrument was
started at 12:30 local 6 Mar 2010 with an accidental header of GMT-6 hours, and
restarted with a GMT-5 hour header on 9 March.
CIRA near the village of Ca Ira, 18.52499°N, 72.65077W
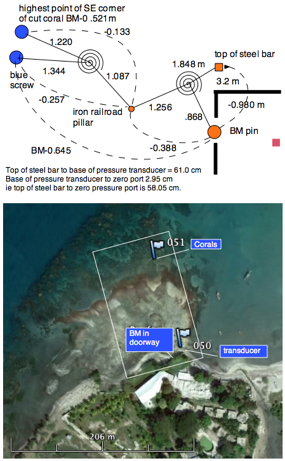
The instrument is installed in the north corner of
Ca Ira Orphanage west of Leogane.
The microatolls 100 m offshore to the NW here were raised 20-30 cm in
the earthquake. The sensor is
bolted to a stainless steel bar that is clamped to a 60 cm long steel helical
screw which reached a depth of 97 cm below the beach level in muddy sands
without encountering resistance. A
copper mesh was wrapped around the pressure port and this in turn was inserted
into a porous foam inlet filter enclosed within a 4 cm diameter PVC jacket
bolted to the base of the
stainless bar. The height of the
top of the stainless bar was referenced to a galvanized bolt hammered into the
lintel of the doorway through the NW wall to the orphanage, and also to two
offshore corals that had been sampled by the USGS (Rich Briggs).
The transmitter is located inside the protective
fence of the orphanage and is mounted on awoodend plank at a height of about
2m. The current loop does not use the 6V power of the Onset microstation but
instead uses the power from a pair of 9V lithium fire alarm batteries. These will power the system for two
years but should be replaced annually along with the microstation batteries.
The first few days of
data show that mean sea level is 83.6 cm above the zero pressure datum, i.e.
72.5 cm below the nearby bench mark, and 8.0 cm below the blue screw marker on
the southern of the two microatolls, and 20.4 cm below the highest remaining
point on the sampled northern microatoll. Given a tidal range of more than 36 cm and
assuming that the highest coral was immersed at low tide suggests that the
microatoll here has been raised by 18-20 cm.
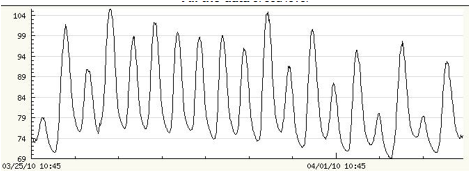
Fig 4
First week of data from CIRA peizometric gauge, at Ca Ira, Haiti
BLOC , near
the village of Beloc south of Leogane.
The tide gauge is installed near the village of
Beloc 5 km to the south of Leogane, to the east of a colony of microatolls that
have been raised more than 50 cm above sea level by the 12 january earthquake.
The sensor was bolted to a stainless steel bar A copper mesh was wrapped around
the pressure port and this in turn was inserted into a porous foam inlet filter
enclosed within a 4 cm diameter PVC jacket bolted to the base of the stainless bar. The height of the top of the stainless bar
was referenced to two 100 m offshore corals that had been sampled by the USGS
(Rich Briggs) using a level and alluminium leveling staff.
The data logger is enclosed in a
4" PVC pipe sealed with a rubber gasket, and fastened using hose clamps vertically to a 1 m long angle
iron driven into the berm above the pre-earthquake tidal level near a small
village hut and thorn bushes. The
atmospheric pressure equalisation tube faces downward, and the pipe is
potentially vulnerable to vandalism.
No transmitter was available for this unit. The batteries should be
replaced in March 2011.
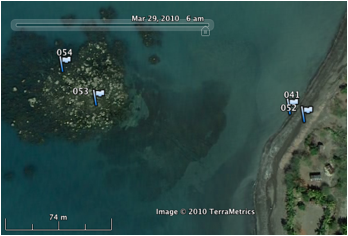
Fig 5.
Corals 53 (18.4789N 72.66859 W) and 54 (18.47913,72.66882) are numbered 8 and 17
Leveling at Beloc: The pressure port was
referenced to the offshore corals using a precise level with a 10 m back sight
and a 120 m foresight. The
asymmetry means that the data are probably not accurate to better than 5 mm.
Height of top of steel bar 1.00 m, pressure port
zero is 57.9 cm below top of bar.
Height of B17 coral 1.05 m ie 5 cm below steel bar
reference, and 52.9 cm about transducer zero
Height of B8 coral 0.449 m ie 55.1 cm above steel
bar reference, 113.0 cm above transducer zero
JACK , South
of Gros Jacques Island 18.43027N,
72.74943 W
The
sensor was bolted to a galvanized steel angle girder bolted to the base of the
east-facing end of a poorly constructed and partly damaged sea wall. The transducer port has no protective
filter and behaved erratically in the first week of its installation. The blockage cured itself on 13 March,
after which time it was possible to examine differnces in sea level relative to
GONA. The smoothed difference
curve indicates subsidence of 0.6 mm/day.
A bench mark was installed on the western
end of the top step of three steps leading to the north entrance of the house
immediately to the west of the transmitter. The top of the steel bar is 67.0 cm below the step.
The transmitter is fastened to the top of
a steel pole cemented into the ground within a wire fence belonging to a
private citizen on the mainland south of the Island of Gros Jacques. The house is 100 m to the west of that
belonging to Richard Boyer.
Although the site is part of an
extended delta that with swamplike conditions 100 m to the south, the
subsurface is close to a layer of corals similar to those that have established
the island of Grand Jacques offsore. Thus the headland is probably quite
stable. However, it is backed by
distributaries that presumably fill with fresh water during the monsoon, hence
it is likely that mean sea level here is contaminated to some degree by heavy
rain and by the transient development of a freshwater lens.
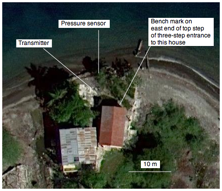
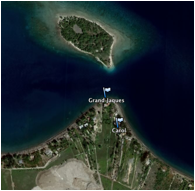
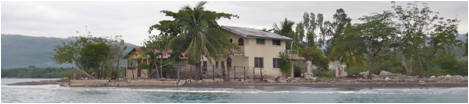
Fig 6 Top:Map views of the Peninsula and island.
Below: South looking view of JACK from the sea . The transducer is fastened to
the low sea wall to the left.
The
transducer was installed in an
excavated water-filled hole 56 cm below sea level. The support system was then buried by coarse beach sand and
large rocks. The first cycle of
sea level recorded a water level
range of about 40 cm as the tide receded and returned, but for the next week
the pressure port was blocked.
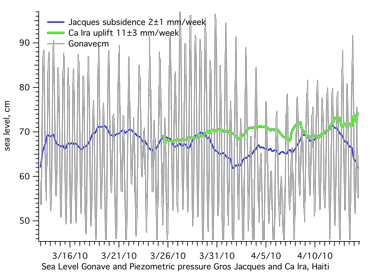
Fig 7 Differences in level between GONA and JACK,
and between GONA and CIRA.
PARA, at
Jeanty les Bains, Grande Guave, 18.43168, 72.76044
The instrument is located at the Paradis Beach Club
at Jeanty les Baines (near Grande Guave).
The transmitter is fastened to the roof of the restaurant and the sensor
is bolted to the north-facing dock below it. It is possible to stay in the
undamaged hotel of the Beach Club for $30/night. The proprieter is Confident
Jean Herold, Phone 506 9977
The sensor was bolted to a
stainless-steel bar fastened to a plastic-coated, concrete-filled barrel. A
copper mesh was wrapped around the pressure port and this in turn was inserted
into a porous foam inlet filter enclosed within a 4 cm diameter PVC jacket
bolted to the base of the
stainless bar. The PVC jacket lies approximately 10 cm below the level of
cobbles and gravel that here form the sea floor. A coral wave-cut platform is exposed on the beach to the west,
and lies at no great depth beneath the shingle deposit adjoining the dock.
The cable is bolted up to the roof and protected where it crosses the
dock walkway by a galvanized angle
iron strip iron hammered into the concrete with non-remavable bolts.

Fig
8 Pressure sensor bolted to concrete foundation support column at PARA. The cable is bolted to the wall at 6
points on its way to the data logger and transmitter on on the roof
Fig
9 Location of the PARA tide gauge at the Parasis Beach Club, Jeanty les Bains.
Calibration
The
precision of the gauges (least count) is 1.2 mm (1.165 mm sea water). The range is 3m.
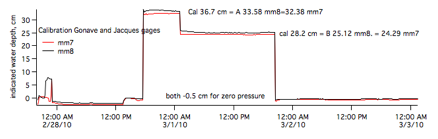
Figure
10 Laboratory intercalibration of
two tide gauges to determine zero datum.
Table
2 Calibration test 28 Feb-2 March.
|
|
actual cm |
cm 193888 |
cm193887 |
|
zero |
2.9 |
-0.5 |
-0.5 |
|
cal2 |
28.2 |
25.12 |
24.29 |
|
cal 1 |
36.7 |
33.58 |
32.38 |
|
zero above base |
2.95 |
2.95 |
2.55 |
|
calibration fresh water |
- |
0.9953 |
0.9518 |
|
calibration 1.03 gm/cc |
- |
1.025 |
0.9804 |
The
gauges were fastened together in the lab on a steel rod and left in air for 12
hours recording an apparent water depth of -0.5 cm. They were then plunged into water at 20°C 36.7 cm deep for a day, which was reduced to 28.2 cm
for half a day before removing them and exposing them to air pressure once
more. The experiment reveals a
datum offset of 2.95-2.55 cm caused by the elevated position of the port (zero
datum) above the base of the transducer (measured as 2.95 cm), and a calibration error of 4% in 193887. The calibration error and an adjustment for sea-level
density of 1.03 gm/cm3 is removed in the data displayed on the
DataGarrison web page. The last two rows of Table 2 and the last two columns of
Table 3 indicate the calibration
applied to the pressure sensors.
Table3
Calibrations off three Stevens gauges
sampled by ONSET A-D 4-20 mA current loop converters. The last two
columns are the calibrations needed to correct the 4-20 mA range to 0-10 feet
scaling for fresh water. They
should be increased by 1.03 for sea water.
|
|
a mA |
a± mA |
b mA/cm |
b ± mA/cm |
zero |
cm/mA |
|
600 196728 |
3.8943 |
0.041 |
.05075 |
0.0007 |
-76.735 |
19.7044 |
|
729 196780 |
3.9683 |
0.017 |
.05023 |
0.00031 |
-79.002 |
19.9084 |
|
196730 |
3.9872 |
0.063 |
.04972 |
0-.0011 |
-80.193 |
20.1126 |
Long
term stability is anticipated to be 1mm/year but it is planned to test this
experimentally by annual in-situ exposure to atmospheric pressure and
recalibration of the gages.
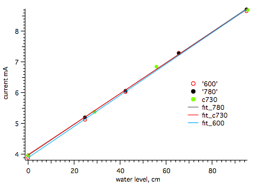
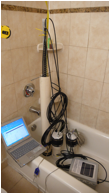
Fig.
11 Calibration of three tansducers simultaneously in 1 m long vertical PVC
tube. The transducers are fastened
to a vertical bar which is lowered to various depths in the tube, which is
maintained full of water. The plot
of electrical output vs water depth yields both the calibration of the sensor
and the null datum (the intersect on the graph). This permits absolute measurements of water depth referred
to the input orifice of the transducer.