Geological, Tectonic and
Seismological Aspects
of the 17 August 1999 Izmit
Earthquake
Summary
1. Tectonic setting of Turkey,
2. Historic Slip on the Anatolian fault,
3. Surface Rupture during the 17 Aug 1999 earthquake
4. Secondary Effects (tsunami, slumping, and earthquake lights)
5. Seismological aspects of the mainshock
6. Various estimates for the magnitude of the earthquake.
7. Foreshocks and aftershocks
8. Strong motion records
1. Tectonic Setting of Turkey
Convergence between the African and Eurasian plates in the eastern Mediterranean results in the westward motion of the Turkey plate on which most of the land area of Turkey lies. The plate is bounded to the north by the 1200-km-long North Anatolian Fault, and to the south by the Southern Anatolian fault which slip respectively in a right-lateral and left-lateral sense in periodic earthquake sequences with strike-slip mechanisms (Ambraseys, 1970). The Black Sea margin of Turkey lies on the EuroAsian Plate and hosts largely srike-slip earthquakes with little or no vertical slip. In contrast, the western margin of Turkey is a region of convergence with the Aegean Sea floor resulting largely in thrust-type earthquakes with a substantial vertical slip component. The Izmit earthquake of August 1999 is a strike-slip earthquake at the western end of the northern Anatolian Fault system (Figure 1).
The slip rate on the northern Anatolian fault determines the rate of seismic productivity on the fault. This is currently estimated to be 22±7 mm/yr using direct GPS observations from a network of fixed and mobile geodetic receivers whose relative positions have been monitored over the past half decade (Reilinger et al., 1997, Straub et al., 1977). This value is consistent with geological estimates of plate motion. The approximately arcuate form of the northern Anatolian fault is caused by its rotation relative to the Eurasian Plate about a Euler Pole near Egypt.
 Figure 1
Map showing tectonic setting of Turkey. The Arabian plate approaches from the SE at 22±6 mm/year
resulting in slip on the N. Anatolian fault at 22-24 mm/year. The sense of slip on the fault systems
surrounding Turkey is shown by arrows and the curved arrow indicates the
approximate rotation vector of the Turkey Plate. The location of the Izmit earthquake is shown by the yellow
circle. (TurkeyPlate.GIF)
Figure 1
Map showing tectonic setting of Turkey. The Arabian plate approaches from the SE at 22±6 mm/year
resulting in slip on the N. Anatolian fault at 22-24 mm/year. The sense of slip on the fault systems
surrounding Turkey is shown by arrows and the curved arrow indicates the
approximate rotation vector of the Turkey Plate. The location of the Izmit earthquake is shown by the yellow
circle. (TurkeyPlate.GIF)
2. Historic earthquakes and stress on the northern
Anatolian fault
Earthquakes on the Anatolian fault are recorded with various degrees of detail in historical accounts throughout the past 2000 years (Ambraseys, 1970, 1971; Ambraseys and Finkel, 1988, 1991, 1995), and the recurrence of earlier earthquakes in pre-history can be observed in excavations across the fault (Okumura et al. 1990, 1993). As might be expected, the slip distributions and locations of most 20th century earthquakes are substantially better known (Barka, 1992; Barka and Eyidogan, 1993) than the slip on earthquakes prior to the 20th century, although some recent events are incompletely documented because they occurred during the time of European wars in 1912-1918, and 1939 to 1945.
Figure 2 The most recent sequence of earthquakes
started in 1939 and has propagated westward with occasional exceptions (figure
after Stein et al. 1997). The central 640 km of the fault ruptured westward in
the five years following 1939. Since 1944 there has been an approximately
linear westwards propagation of the western tip of the rupture front of 200 km
in 25 years (8 km/yr) which would suggest that the remaining segment of the
fault near Istanbul (yellow circle at km-1200) will be ready for rupture no
later than 2025. Ruptures to the
west are documented by Nalbant et al., 1998 and Hebert-Ferrari et al, 1999.
(SpaceTimeEQTurkey.GIF)
From a study of data collected during the past millennium it is possible to develop a view of the northern Anatolian fault as a system of contiguous segments that occasionally experience sequences of earthquakes (Ketin, 1969). Each sequence is hypothesized to permit the entire fault to slip. Thus the 22-24 m of plate motion that was imposed on the northern Anatolian fault in the past 1000 years is believed to have been released in three sequences of earthquakes that propagate along the entire fault with a mean slip interval of 450 years (Figure 3). If this simplification is pursued it is necessary to invoke unequal slip in successive sequences. For example, the mean slip for earthquakes with a 450 year return period is 9.9 m (22 mm/year x 450), yet the most recent sequence of earthquakes is evidently associated with slip that tapers westwards from 6 m to 2.5 m, consistent with a previous sequence of earthquakes occurring 100-250 years ago but requiring four or more sequences to have occurred since 967 if the slip in each sequence is similar. Earthquakes that occurred in 1954 and in 1784 at each end of the Anatolian fault appear to support a 200-350 year interval between earthquake sequences, however, no data are currently available suggesting that the central part of the fault slipped at this time suggesting that earthquakes may be missing from the historic record. The problem of incompleteness of the historic record does not occur if slip is unequal in each sequence. For example, a great earthquake occurred in the central part of the fault in 1668 with a rupture that was longer than that associated with the 1939 M=7.8 earthquake. The slip in this event may have been 7-9 m which would partly or completely eliminate the apparent slip deficit in the past millennium. The observed tendency for the fault to rupture different combinations of contiguous fault segments suggests that local co-seismic slip release may be somewhat irregular over many centuries.
Figure 3 Historic ruptures (projection after Stein et al. 1977)
with areas of boxes scaled to rupture length, The lower box is the 967-1043
sequence, the middle box is a 1668-1784 sequence. .Twenty-two meters of slip on
the fault should have occurred since 937AD yet only 12-15 m is recorded if slip
in pre- XXth century events is assumed similar to the 1939 sequence. Simple
scaling laws applied to the August 17 1668 event suggest it may have slipped
7-9 m, thereby accounting for the apparent slip deficit on the fault (AnatolianSequences.GIF)
The wealth of fault rupture data available from the past 60 years has permitted the stress distribution along the N. Anatolian fault to be analyzed as a dislocation that propagates westward, each sequential earthquake resulting in a stress field conducive to forcing slip on adjoining ruptures. The methods used in these studies is to take the observed slip distribution in each rupture and to estimate the resulting stress near the ends of the rupture. These stresses consist of two parts – a shear stress tending to make the fault slip and a dilatational stress that tends to clamp or release a fault depending on its sign (King et al., 1994). The sum of these two stresses is known as the Coulumb failure stress, and it has been shown that most fault segments were triggered by previous ruptures that increased Coulumb failure stress on future ruptures (Stein et al., 1997; Nalbant et al., 1998). These two studies identify the Izmit/Istanbul region as one that had a high probability for rupture. Subsequent to the 1999 earthquake newly revised increased probabilities for rupture closer to Istanbul have been calculated (Hebert-Ferrari et al, 1999). We note that the western tip of the westerly propagating rupture front (1944-1999) has migrated 200 km west in 25 years (8 km/yr) which would suggest that the remaining segment of the fault near Istanbul (at km 1200) will be ready for rupture no later than 2025. This is within the window of forecast for rupture indicated by Hebert-Ferrari et al, 1999.
3. Surface
slip during the 17 August 1999 Izmit (Kocaeli) earthquake.
Figure 4 shows surface fractures mapped by a USGS team in the several days following the earthquake. Although the EEFIT mission arrived too late (20 days after the rupture) to measure the offsets of roads because these had been repaired and resurfaced, in several cases offsets could be measured precisely from the relative displacements of long walls, fences, river banks or rows of trees crossing the fault (Table 1 & Figure 5). Time did not permit the entire fault to be visited eastward by the EEFIT members. The rupture consisted of a series of en-echelon fractures mostly in unconsolidated materials.
The eastern end of the rupture was not visit by us and is shown as a dashed line for that reason. This NE trending rupture overlaps the westernmost extension of the Mudurnu Valley rupture of 1967 (Ambraseys and Zatopec, 1969), which ruptured south of the fracture that developed in 1999. A damaging earthquake was previously recorded in the Adipazari region in 1943 (Pamir et al., 1943).
Fig 4. 80-km-long ERS1/2 composite SAR image in which gaps caused by steep slopes or heavy vegetation (resulting in incoherence) have been filled with ETOPO30 DTED (by Eric Fielding). Red crosses indicate EEFIT-measured fault offsets located using GPS and taped to 0.1 m accuracy (see Figure 5) and yellow crosses indicate measurements across the western margin of a slump scarp that drowned the coast at the SE corner of Izmit Bay near Gölcük (Figure 6) The length of the fault inspected by the EEFIT team is 41 km. The total length of the rupture is more than 100 km extending from near Düzce an unknown distance offshore to the west.
The mean slip in the earthquake has been estimated using GPS data to be 2.9 m although a more complex distribution of slip is likely to be proposed as more data become available (Reilinger and Burgmann, personal communication 1999). The approximate mean slip is 3 m with a maximum slip of 4.4 m. In Figure 5 we show details in the variation in observed slip as a function of distance in the 12 km east of Izmit. Overlapping en echelon fractures show variable slip along strike causing all the observations to various degrees to be underestimates. Intervening segments of the fault are rotated in ways that cannot be estimated without precise geodetic control.
In several
locations high voltage power lines cross the fault and these are sufficiently
large in scale to permit fault offsets to be measured without errors arising
from local deformation near the fault zone. The success of these measurements depends partly on the
availability of accurate engineering maps of the original pylon locations, the
existence of which we were unable to ascertain at the time. At 40°43' 07"N, 29°58'14"E a pylon had been buckled and pulled toward the fault, and the adjacent pylon at 40°43'10"N and 29°58' 02"
had been pulled and bent in the other direction by a measured 3.3 m offset of the fault. The approximate obliquity of this 290 m span is 20° to the
fault suggesting that the lengthening of the line amounted to at least 3.1
m. The line was apparently still
functioning despite the normally vertical insulator suspension being pulled
close to horizontal toward the fault, and the presence of very high stress in
the cables evident from their abnormally low cautionary sag, both in the
fault-crossing span and in contiguous spans.
Figure 5 . Map and slip distribution of rupture offsets for 4 km of the fault near Izmit (File:Map of Izmit break).
The fault continues an unknown distance beneath Izmit Bay having been recorded to cross the Naval Base piers, west of points measured by us. We undertook a careful inspection of the triangular-shaped peninsula north of Altinova but found no evidence for slip (we were, however, not allowed to enter the extreme 1 km northern end of the Peninsula where a Navy Base is located). A 0.6 m concrete water pipe heads north along the entire peninsula consisting of segmented concrete culvert sections. Two leaks in the pipe are not associated with any nearby evidence for offset. The leaks are presumably caused by shaking of the low lying ground in the peninsula. We found numerous examples of liquefaction, lateral spreading and mud volcanoes near the west coast of the Peninsula and reports for a tsunami at the northern tip (a local account indicates a 200-250 m recession of the sea followed by a 2 m high surge 20 m onto land which we found evidence for in a preserved sea-weed strand line crossing the road to the pier). A ductile steel submarine LPG pipe crosses the Bay and required a repair near a gate valve at the end of the Peninsula (location 4043'26.4" N 29°29'49.8"E) but we received no reports of fracture to the pipe suggesting that if slip continues east it has a low level of slip (<1 m). It is possible that future measurement of this pipe using a pipeline inspection "pig" equipped with a gyrocompass could quantify this weak constraint on fault slip.
Preliminary SAR imagery provide a tantalizing view that may ultimately lead to an improved knowledge of the westernmost limit of rupture. These images show a rapidly decaying strainfield to 20 km west of Izmit and then a fairly long wavelength decay in the strain field further west. This suggests that the fault does not extend very much west of 29.6°E
4.
Secondary effects -Tsunami, slumping, compaction and liquefaction.
In this section we describe a few direct measurements made by the EEFIT team and place them in the context of observations by other groups.
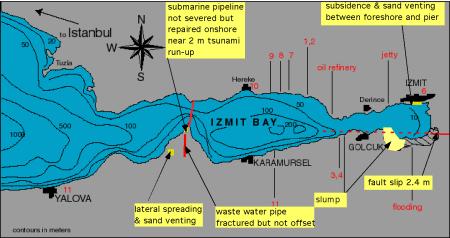
Figure 6 Sites around Izmit Bay visited by the USB
Tsunami team 4 days after the earthquake (red numbering) and by the EEFIT
geology team (yellow boxes). (tsunamiUSB.GIF)
Tsunami: There are numerous accounts of a tsunami having been generated during the main shock. There are also several anecdotal accounts that the sea was unusually turbulent before the mainshock with waves exceeding a meter preventing local fishermen from seeing the shore the previous afternoon. These accounts cannot be verified because there are apparently no tide gauges anywhere in the region, but we did find some evidence for a sea wave having swept about 20 m onshore at 29.5E (location 40°43'26.4" N 29°29'49.8"E). The run-up height here was about 2 m judging from the strand-line left by seaweed on the path leading to the jetty. Several accounts related a ship's captain indicating that the sea retreated 200-250 m before rushing inland, but these may have been the same account repeated from newspapers since we assume that most of the population was asleep at the time. A ship was driven ashore by the force of the wave near Golcuk, near to where one of the recession stories is known to have originated. We were unable to gather direct information on the height of the tsunami elsewhere. (The USC Tsunami web page reports a tsunami maximum runup of 2.5 m along the northern coast of the bay and 1 to 2 m on the southern coast)
Slumping: The eastward 3 m motion of the NE shore and floor of Izmit Bay could have generated the tsunami but it is almost certain that the slump of the SE shore contributed also to its generation. Figure 6 is from the USC tsunami web page which shows the approximate area of slumping. We measured the western 3.5 km of the slump to have sunk 2 m with subsidence reducing eastward short of the area indicated by the USC map (Table 2). In the extreme SE corner of Izmit Bay the USC map is misleading for we observed no slumping of the ground this far east. We were unable to follow the slump scarp further east from minor cracking and inflection present at 40.7088°N, 29.8650°E although the shoreline may have subsided beyond the region we explored. The surface of the slump surface is extensive and shows no fissuring where we could see it exposed. Trees and buildings sank uniformly over most of its surface. This suggests that the slump slip plane is vertical for some distance. We were unable to measure any back tilting of the surface so that we cannot estimate its subsurface geometry.
There is abundant evidence to suggest that Gulcuk slump was a reactivated feature. Not only were there several indications along its length for a gentle topographic step in the former ground surface, but we observed it to represent the junction between several cultural features. In one location, for example, it represented a boundary between apple/pear orchard and timber forest. In another it represented the boundary between pasture and orchard. Several houses and a mosque had been constructed on the head of the scarp resulting in their complete destruction. Another house that had been constructed across a secondary scarp north of the mosque tilted during the mainshock only to collapse in a strong aftershock one week later.
Sand venting and liquefaction
was observed in two locations around
Izmit Bay but no doubt there are many others. Water continued to issue out of saturated ground roughly 1 m
above sea level at 40°42'31.9N, 29°28 26.7 E for a day after the earthquake
bringing with it sand and silt (0.2-2 mm grain size). Three weeks after the earthquake the soil surface near these
vents was still significantly wetter than the surrounding soils. The ground was fissured heavily
parallel to a west facing inlet of the sea with lateral spreading fissures of
12-20 cm width and 20-40 m length abundant. Water and sand had vented through some of these fissures
widening them and channeling flow toward the sea in places. A 10 m wide, 8 m deep heavily
reinforced cylinder (1m wall thickness at surface) under construction for waste
water processing but currently empty had apparently been extruded about 20 cm
at this location with evidence for sand venting around its edges.
Sand venting to a lesser degree
had occurred in the NE corner of Izmit Bay between the old shoreline and a
concrete pile pier. Lateral
spreading was evident at the eastern approach in this presumed fill zone
(40°45'35" N, 29°55'57" E) associated with maximum subsidence of about 1.5 m. Subsidence of
less than 30 cm with sand
venting was present
on 10-20 m long fissures some 200 m to the west (at 40°45'37" N,
29°55'18"E). The subsidence
had affected the shoreline road support soils in this region with sand vented
through pavement cracks. A large
concrete structure crossing beneath the road had not suffered this subsidence
presumably indicating that its effects are not deeply seated. The result was that the road, though
not itself ruptured had a ramp and vertical step of 20-30 cm on each side of the concrete
substructure, necessitating the traffic to slow considerably in its vicinity.
Lateral spreading was observed
to be associated with the surface fissures evident in many places in
Adipazari. According to a local
observer in one location a 4 storey concrete dwelling tilted into a fissure in the several minutes following
the mainshock. The cracks at this
location consisted of two north-south open fissures separated by approximately 10 m with two parallel
compression features in the road surface approximately 20 m on each side of
these tension gashes. Water had
evidently been ejected from the fissure though not in any great quantity and
without silt or sand. The water
table was less than 1 m below the surface when we visited. It is hypothesized that the fractures
acted as strain concentration features with opening and closing displacements
pounding their edges to cause the observed compression fractures (Figure 7).
 Figure 7.
Inferred cross-section through fissure approximately 1 km north of Adipazari
Railway Stn. The fissure shows
compression fractures near the edges of the tension fissures suggestive of
pounding by opening and closing of the tension gashes during strong ground
shaking. The water table is within 1 m of the surface.
Figure 7.
Inferred cross-section through fissure approximately 1 km north of Adipazari
Railway Stn. The fissure shows
compression fractures near the edges of the tension fissures suggestive of
pounding by opening and closing of the tension gashes during strong ground
shaking. The water table is within 1 m of the surface.
Fracture spacing to the west of
the fracture was irregular but averaged 70-100 m for a distance of 500 m, Beyond this distance and to the other
side of this lateral spreading feature we found no evidence for fractures, and
although they are repeated in other parts of the city, we were unable to map
their distribution in the time available to the EEFIT mission. A similar large fissure was found in a cooking oil
factory to the NE of the previously described fissure. At this location the water table was
again within 1 m of the surface although it had sunk by ≈50 cm in the week
preceding our visit. There was
clear evidence for sand
venting through
parts of this fissure. Factory
buildings were severely tilted indicating a loss of shear strength in the soils
underlying the structures and slabs in the compound.
Earthquake lights: Several accounts of a luminous red glow in the sky were
reported in the newspapers. The
association of a luminous glow in the night-time sky at the time of an earthquake
is not a new phenomenon and though common is rarely recorded instrumentally
(Derr, Bull Seism. Soc. Am. c. 1970).
There is considerable dispute about the origin of these lights. Some
attribute the phenomenon to piezoelectric discharge caused by coseismic
stressing, while others link it to the emission of charged ions by gas venting
from the earth's surface. In the 1999 Izmit earthquake the phenomenon was
apparently recorded by surveillance cameras at the BP oil refinery and shown
several times on television.
Although we have not seen it we were told that this footage is available
from local TV channels (ATV and
Kanal D). The lights apparently
glow for a 1-2 seconds before shaking commences at the camera suggesting that
they may record coseismic phenomena near the remote rupture that precedes the
arrival of seismic waves.
_________________________________________________________________________
Table
1 Offsets measured 10-12 Sept during EEFIT mission (W. subareal exposure of fault only).
_________________________________________________________________________
slip,m ± m lat.
N long.
E Feature
at GPS position ±30 m.
2.7 0.2 40.7211 29.9372 edge of Bay. Oblique concrete path offset
2.7 0.3 40.7208 29.9386 road repair on Izmit road fixed c. 2 sept. No afterslp 12 Sept
2.5 0.5 40.7233 29.9406 workshop cut by fault
2.5 0.3 40.7211 29.9411 road repair on road going east. No afterslp 12 Sept
2.0 0.1 40.7214 29.9425 average of both edges of offset wall
1.5 0.3 40.7219 29.945 masonry shed cut by fault and rotated
1.9 0.1 40.7211 29.9464 N. offset culvert (river edge) with step up downstream of 50 cm
0.6 0.1 40.7203 29.9464 S offset culvert (river edge) with water fall into sag graben
1.9 0.1 40.7206 29.9481 two E. perimeter walls of destroyed school
1.7 0.2 40.7211 29.95 3 tree alignments office by fault
2.0 0.4 40.7208 29.9539 trace lost near culvert by road repairs.
2.0 0.2 40.7211 29.9572 offset fence
1.5 0.5 40.7217 29.9575 ditch with pipes offset
1.7 0.2 40.7211 29.9592 fence posts offset and fault bearing 279-270
2.3 0.3 40.7206 29.9597 moletrack fence offset
2.0 0.5 40.7206 29.9631 offsets stream and large trees.
Poor estimate.
3.3 0.1 40.7208 29.9664 offset barbed wire fence with cows
2.6 0.1 40.7214 29.9717 offset masonry wall next to house with nice man and his children
3.0 0.1 40.7208 29.9725 offset cast concrete wall in front of row of collapsed 5 storey
buildings.
2.5 1 40.7211 29.9756 offset in curved barbed wire fence
1.5 0.2 40.7214 29.9786 offset grassy wheel track in mud
0.4 0.8 40.7219 29.9806 Two small offsets and waterfall in stream fronting forested hill
1.8 0.2 40.7231 29.9972 offset in trees lineaments shown to us by villagers. (near bridge)
1.2 0.2 40.7236 30.0008 road near woodyard
2.0 0.2 40.7236 30.0308 offset in steep bank of stream covered with brambles
2.9 0.1 40.7211 30.0547 average of 6 tree offsets (encountered Potsdam group)
1.8 0.1 40.7206 30.0806 house slab offset near drain
2.0 0.5 40.7164 30.1186 timber mill wall
2.0 0.5 40.7081 30.3742 bridge parapet offset on motorway
2.0 0.5 40.7081 30.4239 Toyota plant entrance
_________________________________________________________________________
Table 2 Locations of head of slump in SE corner of Izmit Bay
_________________________________________________________________________
# North
lat East
long offset
m km m
1 40.72369 29.8375 2 0.40635 1
2 40.72136 29.8377 2 0.50976 1
3 40.72106 29.8383 1.5 0.57444 1.5
4 40.72147 29.84 1 0.69781 2
5 40.71986 29.8403 2 0.7835 2
6 40.71942 29.8419 2 0.9298 2
7 40.71917 29.8433 2 1.05957 2
8 40.71864 29.8437 2 1.1094 2
9 40.71206 29.8546 2 2.26336 2
10 40.71111 29.8551 1.7 2.34267 1.7
11 40.71033 29.8574 2 2.56399 2
12 40.70894 29.8582 1 2.68309 1
13 40.70722 29.8583 1.5 2.75906 1.5
14 40.70878 29.8585 1.5 2.71711 1.5
15 40.70736 29.8595 1.5 2.85346 1.5
16 40.70861 29.8611 0.5 2.93875 0.5
17 40.70694 29.8622 0.7 3.09372 0.7
18 40.70883 29.865 0.5 3.2524 0.5
_________________________________________________________________________
References
Ambraseys, Some characteristics of the North Anatolian Fault Zone, Tectonophysics, 9, 143-165 (1970)
Ambraseys, N. N., Value of Historical Records of Earthquakes, Nature, 232, 375, 1971.
Ambraseys, N. N. and C. Finkel, The Anatolian earthquake of 17 August 1668, In . W. H. K. Lee, H. Meyers, and K. Shimisaki, (ds), Historical Seismograms and earthquakes of the world (173-180) New York, Academic Press, 1988.
Ambraseys, N. N. and C. Finkel, Long-term seismicity of Istanbul and of the Marmara Sea region, Terrra Nova, 3, 527-539, 1991.
Ambraseys, N. N. and C. Finkel, The seismicity of Turkey and Adjsacent Areas: a historical review, 1500-1800. Istanbul: Muhittin Salih EREN, 1995.
Ambraseys, N. N. and A. Zatopek, The Mudurnu Valley, west Anatolia earthquake of 22 July 1967, Bull. Seism. Soc. Am, 59, 521-589, 1969.
Ambraseys, A. A. and J. A. Jackson, Earthquake Hazard and Vulnerability in the northeastern Mediterranean: the Corinth earthquake sequence of February-March 1981, Disasters, 5(4), 355-368, 1981.
Barka, A. A., Slip distribution along the north Anatolian Fault associated with the large earthquakes of the period 1939-1967, Bull. Seismol. Soc. Am., 86, 1238-1254, 1996.
Barka, A. A., The North Anatolian Fault Zone, Ann. Tectonicae. Suppl. VI, 164-195, 1992.
Barka, A. A. and Eyidogan, The Erzincam earthquake of 13 march 1992 in eastern Turkey, Terra Nova, 5, 190-194, 1993.
Hubert-Ferari, A., A. Barka, S. S. Nalbant, E. Jacques, B. Meyer, R. Armijo, P. Tapponier, and G. C. P. King, Seismic Hazard in the Sea of Marmara following the 17 August 1999 earthquake, submitted to Nature Aug 1999.
Ketin, I, On the strike-slip movement of North Anatolia (in German), Bull. Miner. Res. Explor. Inst. Turkey, 72, 1-28, 1969.
King, G.C. P., R. S. Stein, and J. Lin., Static strress changes and the triggering of earthquakes, Bull. Seism. Soc. Am., 84, 935-953, 1944 .
Nalbant, S. S. A. Hubert, and G. C. P. King,
Stress Coupling between earthquakes in Northwest Turkey and the north Aegean
Sea, J. Geophys Res., 103, 24469-24486, 1998.
Okumura, K., T Yoshioka, I. Kuscu, H. Kayanne, and Y. Suzuki [1990]
Activity of the North Anatolian Fault during these two Millennia on the Surface
Faults of 1944 Earthquake Based on Trenching and Microtopographic Studies. EOS,
vol. 71, no. 43 supplement, p.1560.
Okumura, K., T. Yoshoka and I. Kuscu [1993] Surface Faulting on the North
Anatolian Fault in these two Millennia. U.S. Geological Survey Open-file
Report, 94-568, 143-144.
Okumura, K., T. Yoshioka, I. Kuscu, T.
Nakamura, and Y. Suzuki [1993] Recent Surface Faulting Along the North
Anatolian Fault East of Erzincan Basin, Turkey--a Trenching Survey. EOS, vol.
74, no. 43 supplement, p.545.
Pamir, H., F. Baykal, and I. Ketin, A
Geological report on the Adapazari Hendek earthquake (20.06.1943) Repport
Earthquake Research Institute, Ankara, Turkey (in Turkish). 1943.
Reilinger, R. E., S. C. McClusky,
M. B. Oral, R. W.
King, M. N. Toksoz, A. A. Barka, I, Kinik, O. Lenk., and I. Sanli, Global
Positioning System measurements of the present day crustal movements in the
Arabia-Africa-Eurasia plate collision zone, J. Geophys. Res., 102, 9983-9999, 1997.
Stein, R. S. A. A. Barka, and J. H.
Dieterich, Progressive failure on the North Anatolian fault since 1939 by earthquake
stress triggering, Geophys. J.
Int, 128, 594-604, 1997.
Straub, C., H. G. Khale, and C. Schindler,
GPS and geological estimates of tectonic activity in the Marmara Sea area. J.
Geophys. Res., 102, 28587-27601, 19
Dina
D'Ayala - Bath Univ.
Paul
Greening - Bristol Univ.
Berrak
Teymur - Cambridge Univ. but
currently in Turkey
Russ
Evans - British Geological Society
Roger
Bilham - Univ. Colorado - currently in Oxford
Abbas
Al-Hussaini - Univ. of Westminster
Alan
Stewart - Babtie
Paul
Doyle - Allot & Lomax
Matthew
Free - Ove Arup Hong Kong [mailto:matthew.free@arup.com]
Richard
Thompson. - Reporter of New Civil Engineer97.