
| Shelton tilt data access page |
||
   |
Data processing |
|
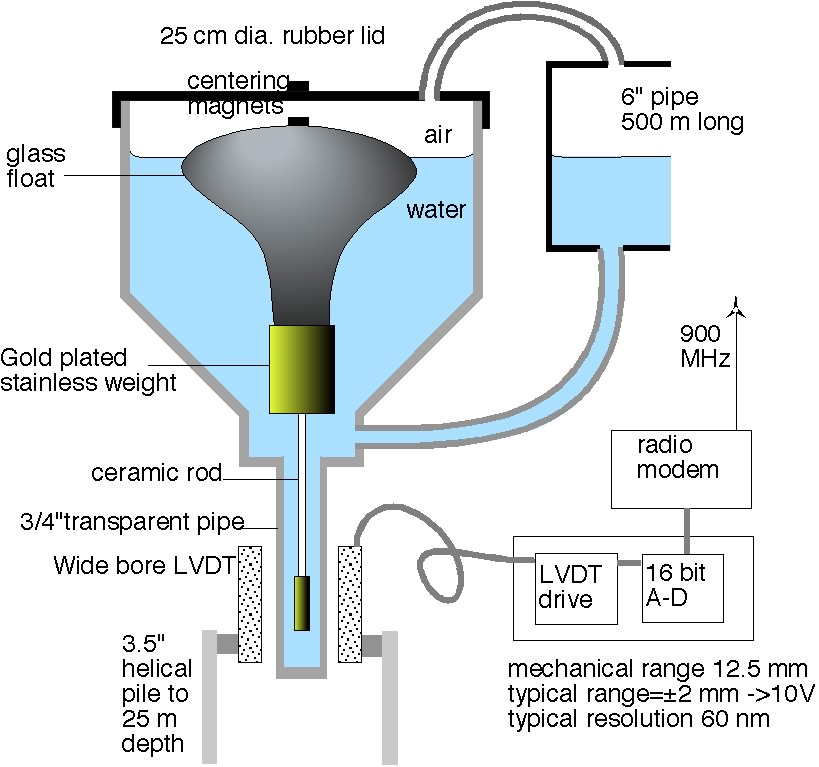
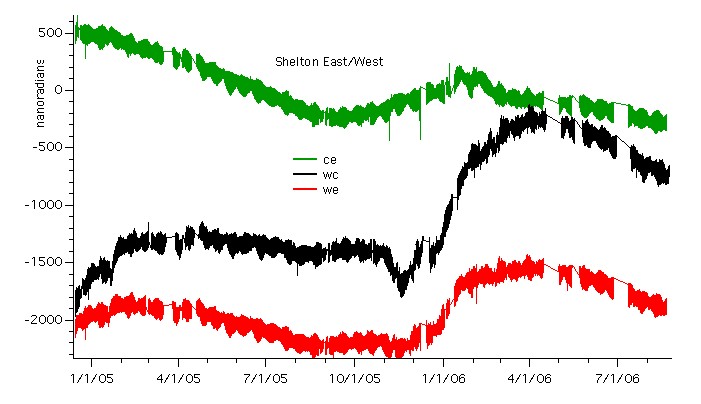
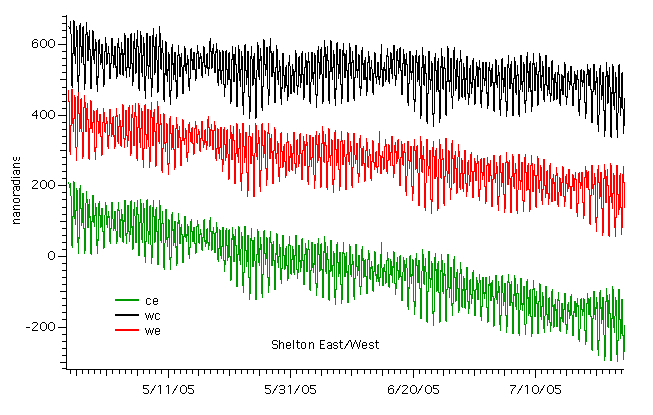
The Shelton tiltmeter yields 6 data streams, each with 4 channels from 5 vaults: the data streams are North, North-Central (NC), South, East, West-Central (WC) and West, and the recorded signals are water depth, temperature, heater-voltage and supply voltage. The raw data can be accessed on request. From each 500 m long pipe three combinations of tilt can be formed from the the three water level channels. e.g. (East-West )/500, (WC-west)/250, and (East-WC)/250 all in nanoradians where water heights are in µm. These combinations, in the absence of local noise sources, should all give identical tilt signals. These processed data may be accessed either as graphs or downloadable ascii files. Example Shelton East-West 2004-2006. Close up 3 months of E-W Shelton data. Close up 2 days of data. Water depth: The raw data are obtained as 16 bit words 5 times each second that are averaged for 64 s and recorded once per minute. The calibration of each sensor is linear to 1 % and is stored in µm. In each case increasing mm indicates increasing water depth, i.e sensor down. Thus a positive increasing East-West signal means a tilt of the Earth's surface down to the east. Temperature : unscaled deg C. Heater voltage: The lid of the tilt sensor is heated to prevent moisture condensing and dripping onto the float. The voltage is a measure of the stabilised 15V from the inverter. In the absence of system faults this recorded voltage should never change. Supply voltage: This indicates the health of the batteries, solar panels or AC supply.
|
||