Script
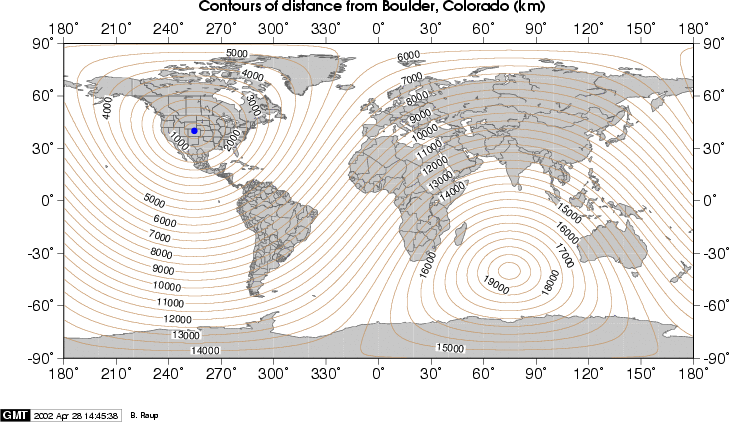
Web interface to make your own map
Script
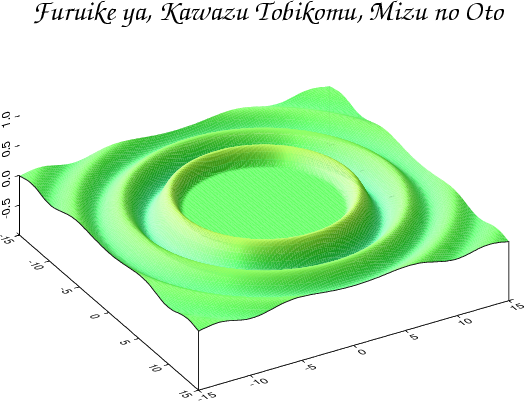
An ancient pond, A frog jumps in, The sound of water.
Script
Click on map for animated sequence showing solar illumination at 17:00 UTC through the year. (This is a 5 MB file.)
Click on thumbnail image for animated sequence showing solar illumination and other sun data for Boulder, Colorado. (This is a 9 MB file.)
Click on thumbnail image for animated sequence showing the flooding of Colorado. (This is a 5.8 MB file.)

Soccer ball combined with world map. Script
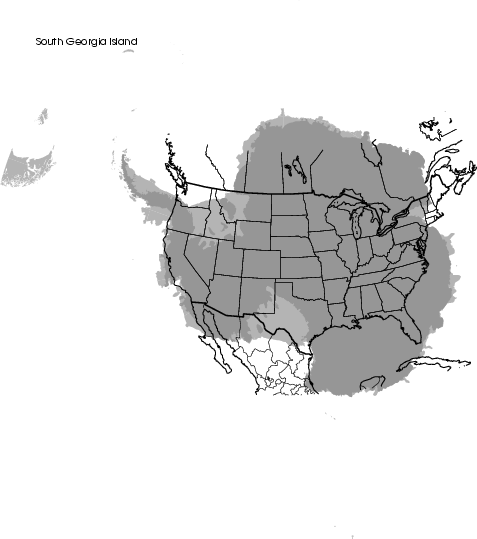
Map showing the relative sizes of the USA (9.6 million km2) and Antarctica (14 million km2). Script
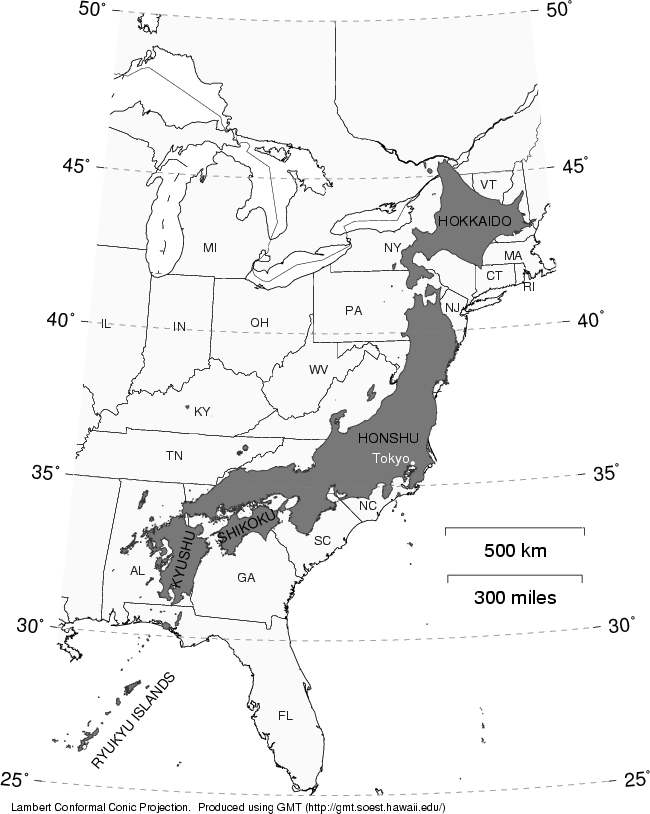
Map showing the relative sizes of the USA and Japan. Perl script
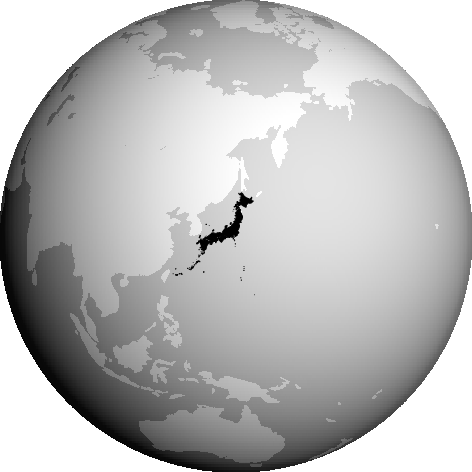
Placing Japan on the Globe Script