MODICE using NSIDC's copy of MODSCAG
|
MODICE using NSIDC's copy of MODSCAG
8/6/2008: Tom helped me find a bug in my IDL software that was causing the results with the weird histograms. This is the correction to those results.
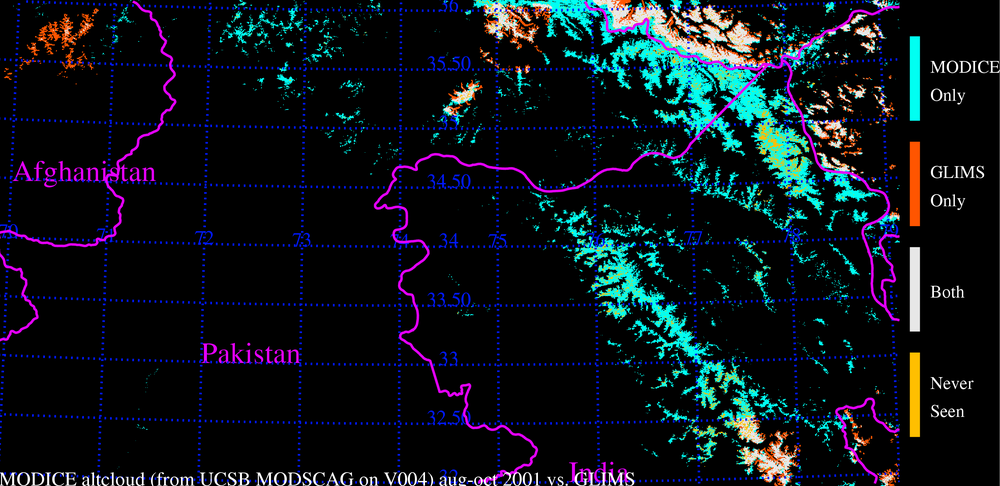
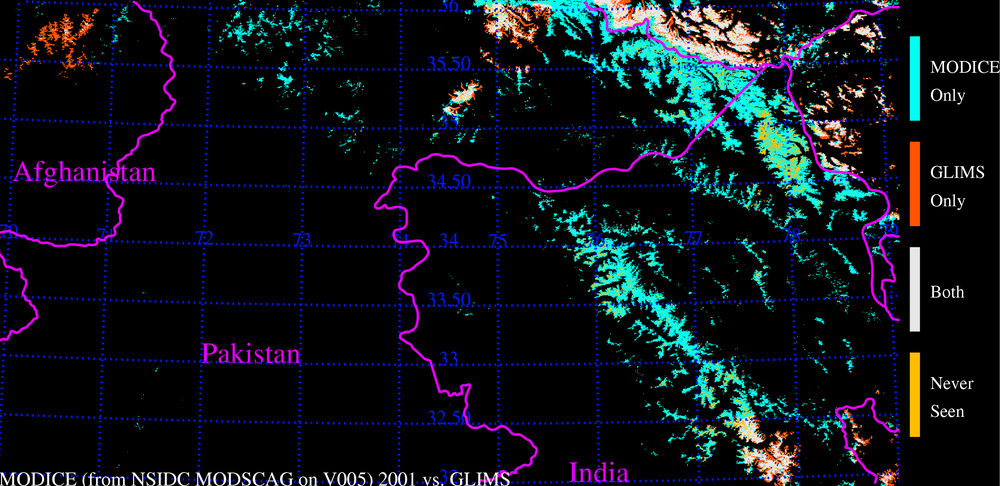
These images compare
- MODICE output from the UCSB data that Peter processed with
- MODICE from NSIDC's copy of MODSCAG, run on the two
native MODIS tiles, and then reprojected to the Karakoram scene.
The MODSCAG SCA threshold in both cases is 15%. Data in both cases is
2001 days 213 through 304 (all of 2001). There are differences, but
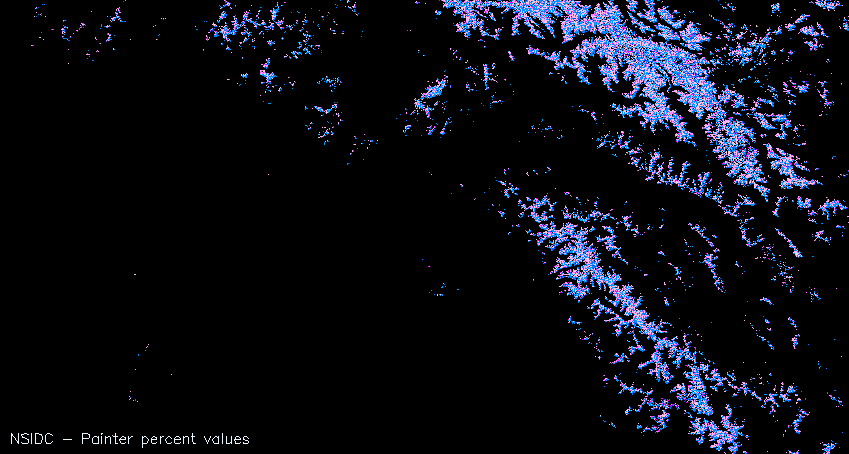
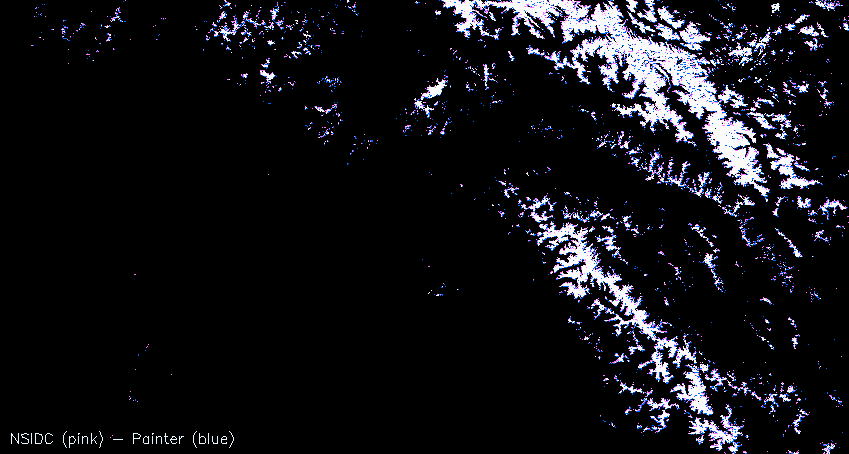
notice how that bias of the NSIDC data (lotsa pink before) has been
reduced, and is now a lot more pink/blue distributed randomly.
Judging by our comparison of MODSCAG output for the single scene we
looked at for 2005, these are probably due to the different versions
of reflectance data (v004 vs. v005) using in the input streams.
When Tom does a flicker image between the two, it looks like we may
have a mapping problem off by about a pixel--this is entirely
possible, given the way I derived the gpd from the UCSB geotiff file.
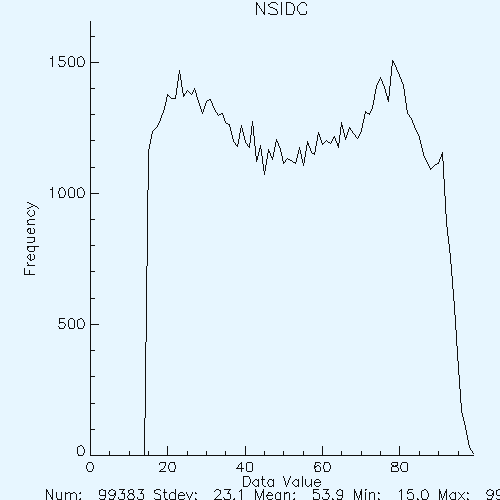
N.B. the histograms have much closer shapes, now.
Any comments or questions?
(Click on any panel to see full resolution version.)
| MODICE, Aug-Oct 2001, from UCSB data |
 |
| MODICE, Aug-Oct 2001, from NSIDC's copy of MODSCAG, from MOD09GA tiles |
 |
| Difference: NSIDC - UCSB (pinks are NSIDC > UCSB, blues are reverse) |
 |
| Difference: NSIDC - UCSB binary, white=agree, pink=NSIDC only, blue=UCSB only |
 |
| Histogram of UCSB SCA data |
 |
| Histogram of NSIDC SCA data |
 |
M. J. Brodzik <brodzik@nsidc.org>
Last modified: Thu Mar 29 12:13:26 2001