MODICE for Nepal region, comparison statistics
|
MODICE for Nepal region, comparison statistics
I can now generate image comparison statistics for MODICE output vs. GLIMS outlines, using the image classification definitions in Painter et al. RSE 2009. These are:
- TP: true positive (ice in both)
- TN: true negative (ice in neither)
- FP: false positive (ice in MODICE, but not in GLIMS)
- FN: false negative (ice in GLIMS, but not in MODICE)
Taking the GLIMS glaciers as "truth", image classification categories are then:
- Precision = TP / (TP + FP) = both / (MODICE ice) = percentage of all MODICE ice pixels that correctly identify ice
- Recall = TP / (TP + FN) = both / (GLIMS ice) = fraction of all true ice that MODICE gets correct
- Accuracy = (TP + TN) / (TP + TN + FP + FN) = percent agreement (as both or neither)
I generated image classifications for the Nepal scene and each of
2001 alone, 2002 alone, and 2001+2002 (cumulative); For each year, I
compared aug-oct (days 213-304) to sep-nov (days 244-334). The real
question we're tackling in the different months is to reduce the area
that we never see, due to clouds. Here are the comparisons:
Filename                                         Precision  Recall    Accuracy  Area Never Seen
MODICE.2001.213-304.annual.Nepal.diff.img          49.613 %  67.699 %  96.342 %     3.5 x 10^3 km^2
MODICE.2001.244-334.annual.Nepal.diff.img          61.955 %  67.401 %  97.370 %     0.9 x 10^3 km^2
MODICE.2002.213-304.annual.Nepal.diff.img          38.721 %  77.447 %  94.945 %     3.5 x 10^3 km^2
MODICE.2002.244-334.annual.Nepal.diff.img          45.133 %  78.469 %  95.975 %     1.4 x 10^3 km^2
MODICE.2002.213-304.Nepal.diff.img                 56.619 %  62.208 %  96.868 %     0.9 x 10^3 km^2
MODICE.2002.244-334.Nepal.diff.img                 64.912 %  64.544 %  97.438 %     0.2 x 10^3 km^2
From these stats, I draw the following conclusions:
- We should definitely proceed with the sep-nov time period, at
least for this region. Using sep-nov increases precision by 15-25% in
each case. Recall decreases by 0.2% for 2001, increases by 1.0% for
2002, and increases by 2.3% for the cumulative processing. So it
improves precision a lot, and doesn't really affect (or slightly
improves) recall. (Compare the images for 2002 for aug-oct
vs. sep-nov--notice how much of those "MODICE only" (blue) areas go
away by just shifting the months.) For the Nepal scene, using sep-nov
reduces the "never seen" area by a significant 60-75%. It will be
critically important to know which months near the end of the seasonal
minimum are cloud-free, in order to get the best results from MODICE.
- The metrics in 2001 vs 2002 mean that the choice of year is also
important. Recall is better in 2002, but precision is worse.
- Doing processing for cumulative years (2001+2002) doesn't
necessarily improve results. Compared to either 2001 or 2002 alone,
precision improves, but recall decreases when doing a cumulative
MODICE run. Doing both years doubles our required MODSCAG processing
time. Is the doubled processing time worth the ambiguous difference
we see in metrics?
- Just looking at the precision numbers for sep-nov, (61/45/65%)
means that how well MODICE correctly identifies ice depends on the
year, a cumulative run is best, with MODICE-classified ice being
correct for about 2/3 of the pixels. I'm stumped for an explanation
on this, although given the improvement in precision from aug-oct to
sep-nov for 2002, maybe it's that MODICE is still picking up cloudy
regions as snow, despite our best cloud-filtering efforts.
- Just looking at the recall numbers for sep-nov, (67/78/64%) means
that MODICE sees about 2/3 to 3/4 of the ice we know to be there. I
think part of the reason for this is the higher native resolution of
the GLIMS data (10 times the resolution of MODIS, so there are a lot
of small, detailed (sub-MODIS resolution) features that MODIS doesn't
see, but GLIMS does. Painter speculated that a lot of the ice
features that MODICE is missing could be debris-covered glaciers that
MODSCAG just doesn't see.
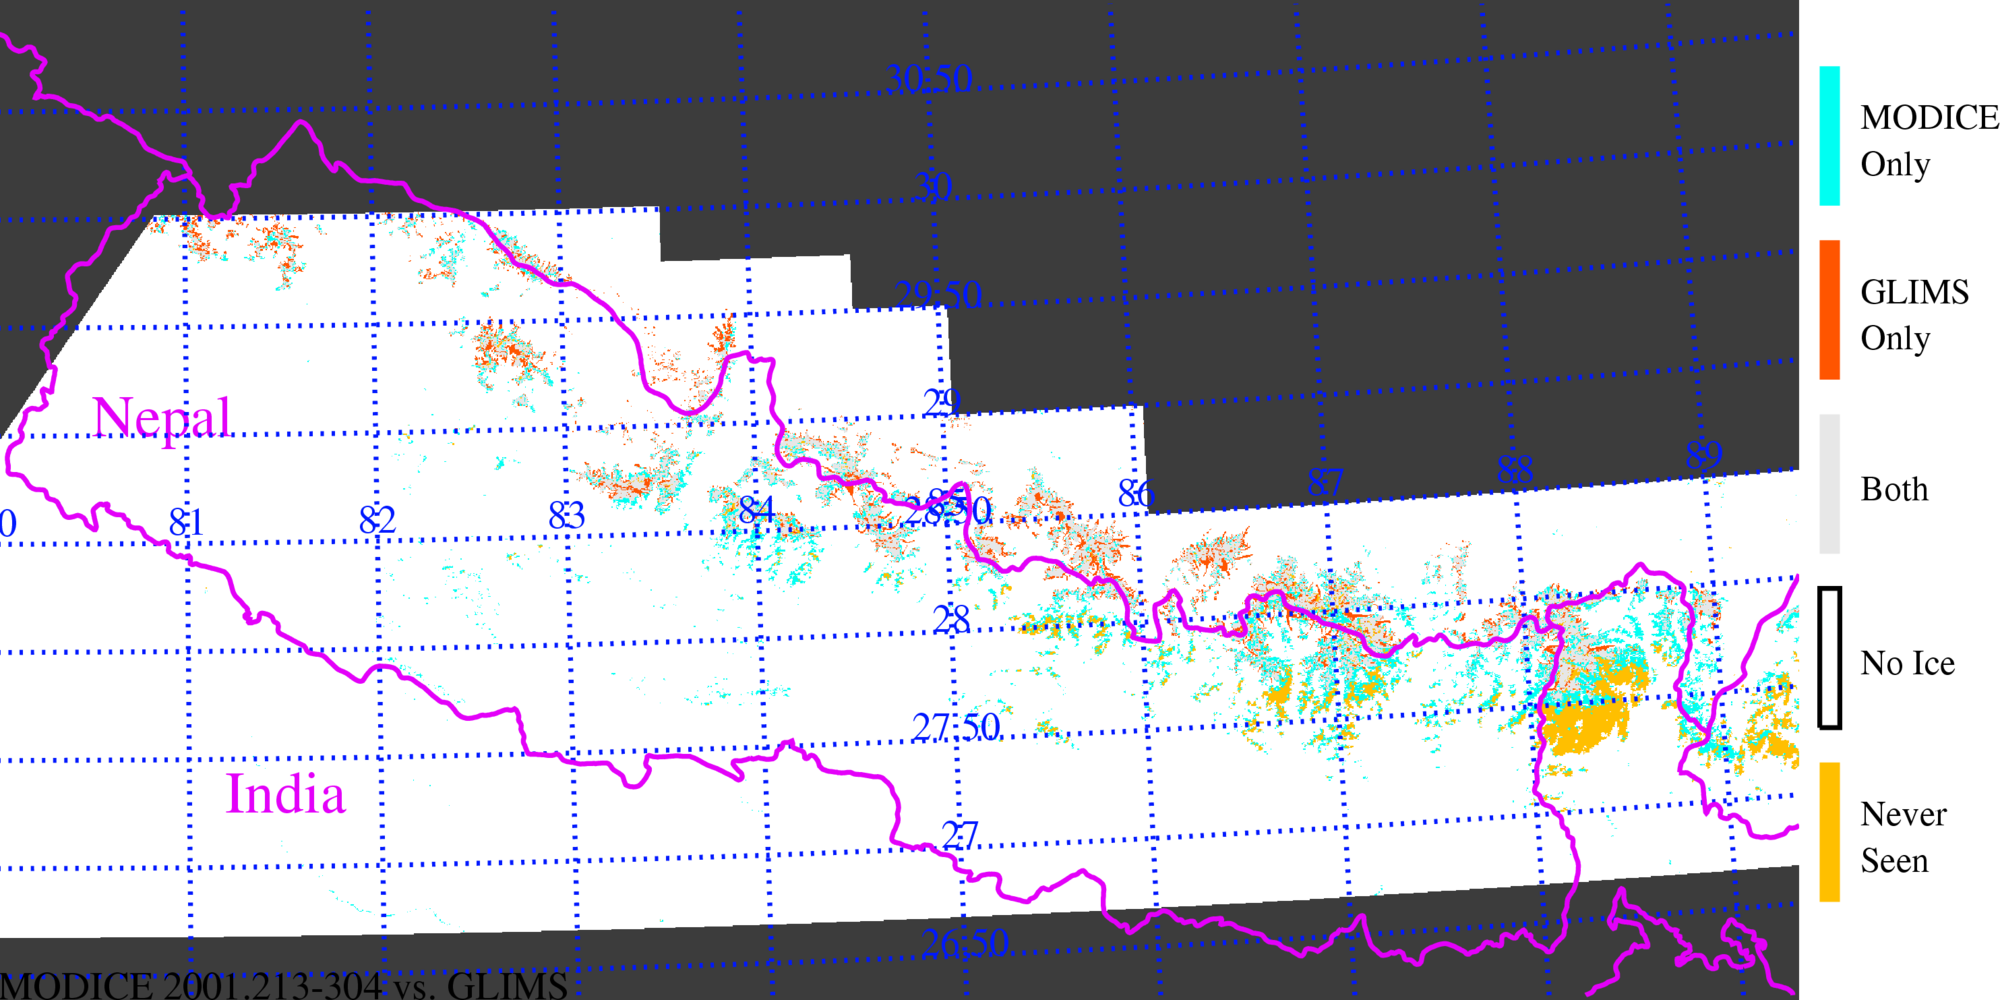
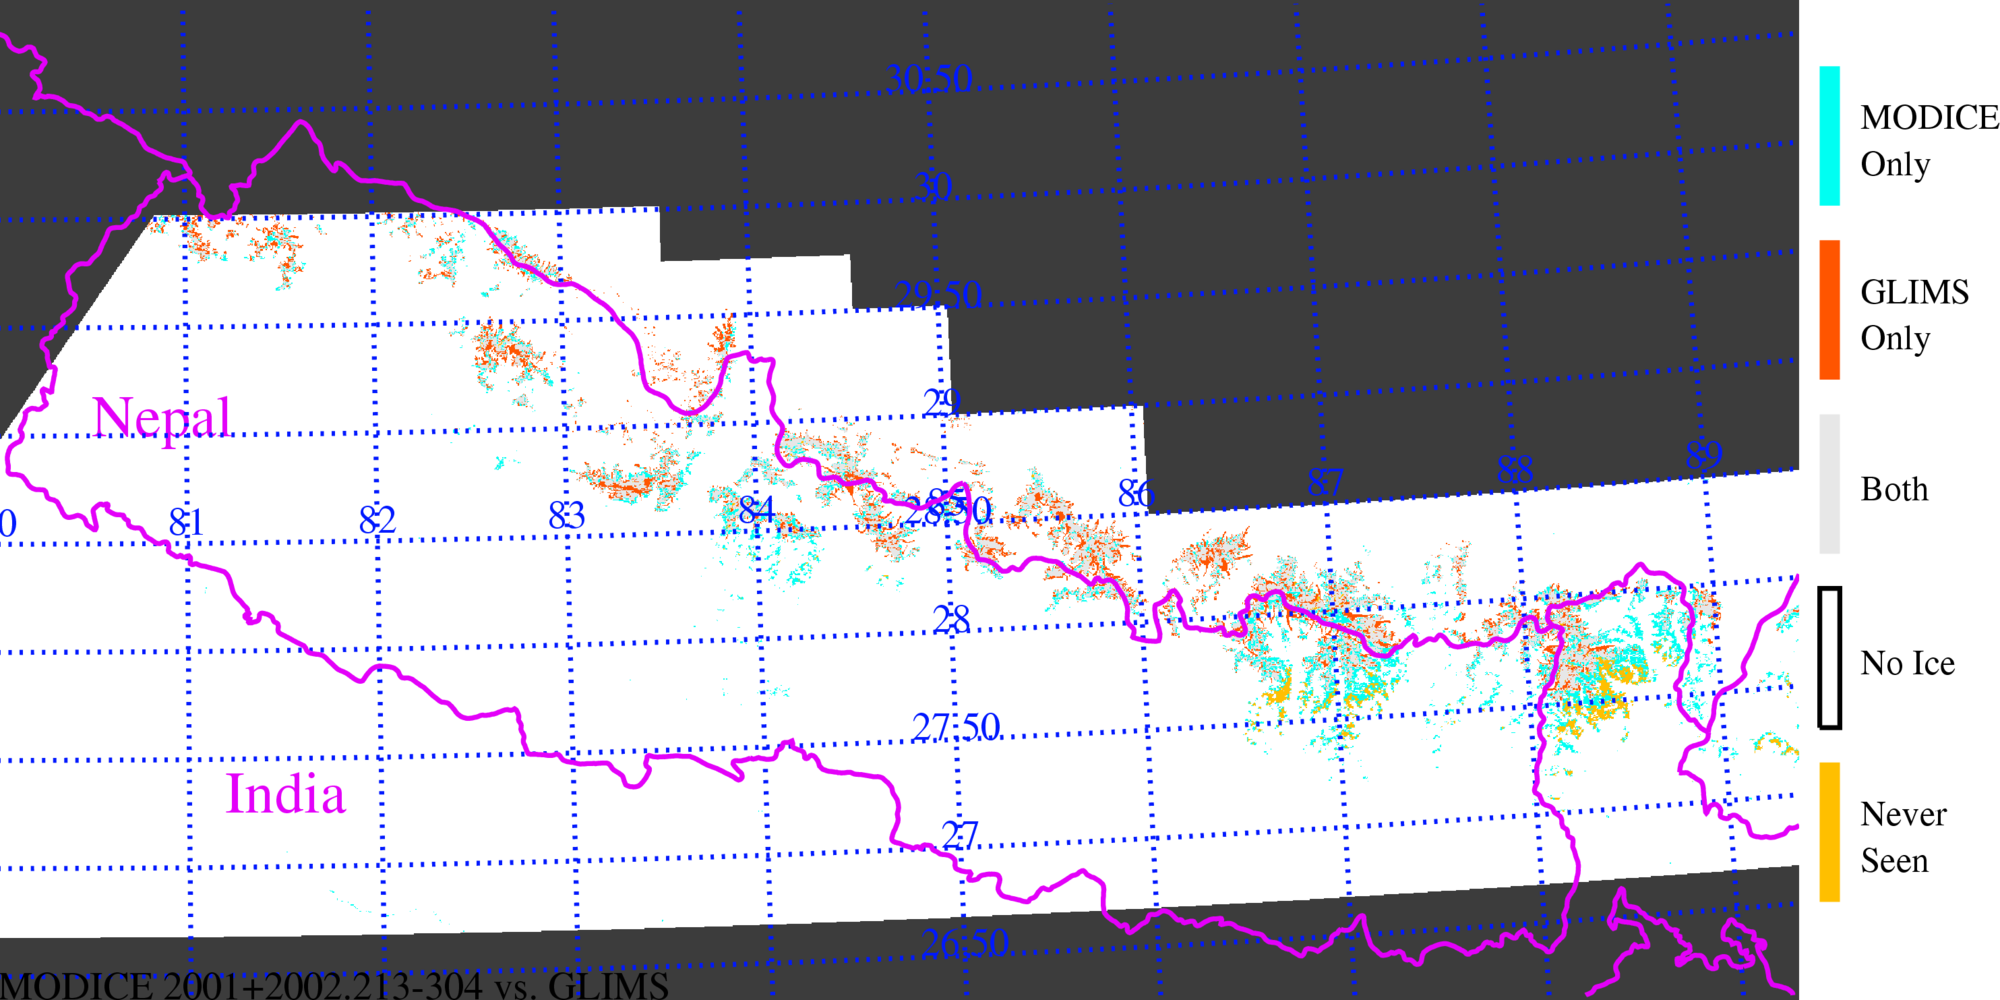
The images below are difference images of MODICE vs. GLIMS
outlines, for each of the 6 results listed above. I masked out 1)
areas outside the Nepal MODICE tile, and 2) areas too far north of
the Nepal/China border. I wasn't sure how accurate we think the
GLIMS outlines are there, and I didn't want to contaminate the
images with place where GLIMS might be incomplete.
(Click on any panel to see full resolution version. Depending on your browser, clicking on that image may give you even more zoom.)
| 2001, aug-oct: MODICE vs. GLIMS outlines for Nepal |
 |
| 2001, sep-nov: MODICE vs. GLIMS outlines for Nepal |
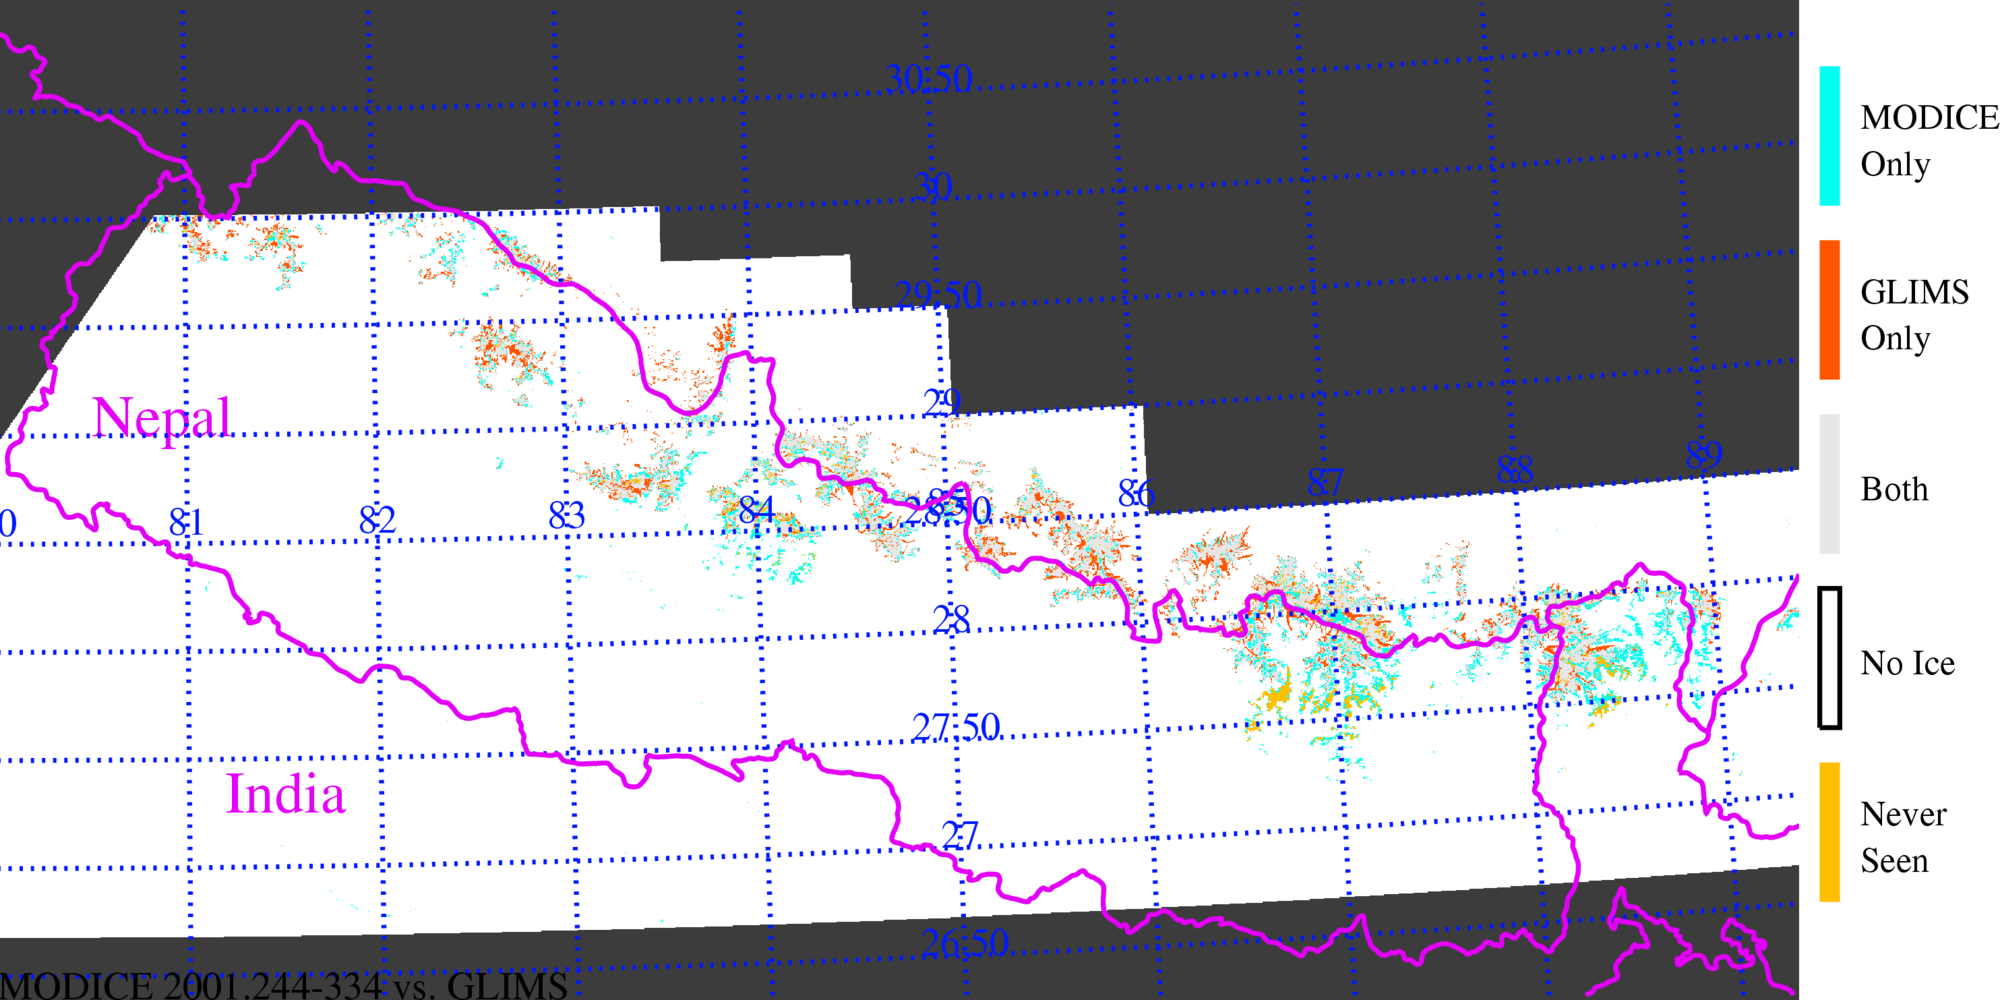 |
| 2002, aug-oct: MODICE vs. GLIMS outlines for Nepal |
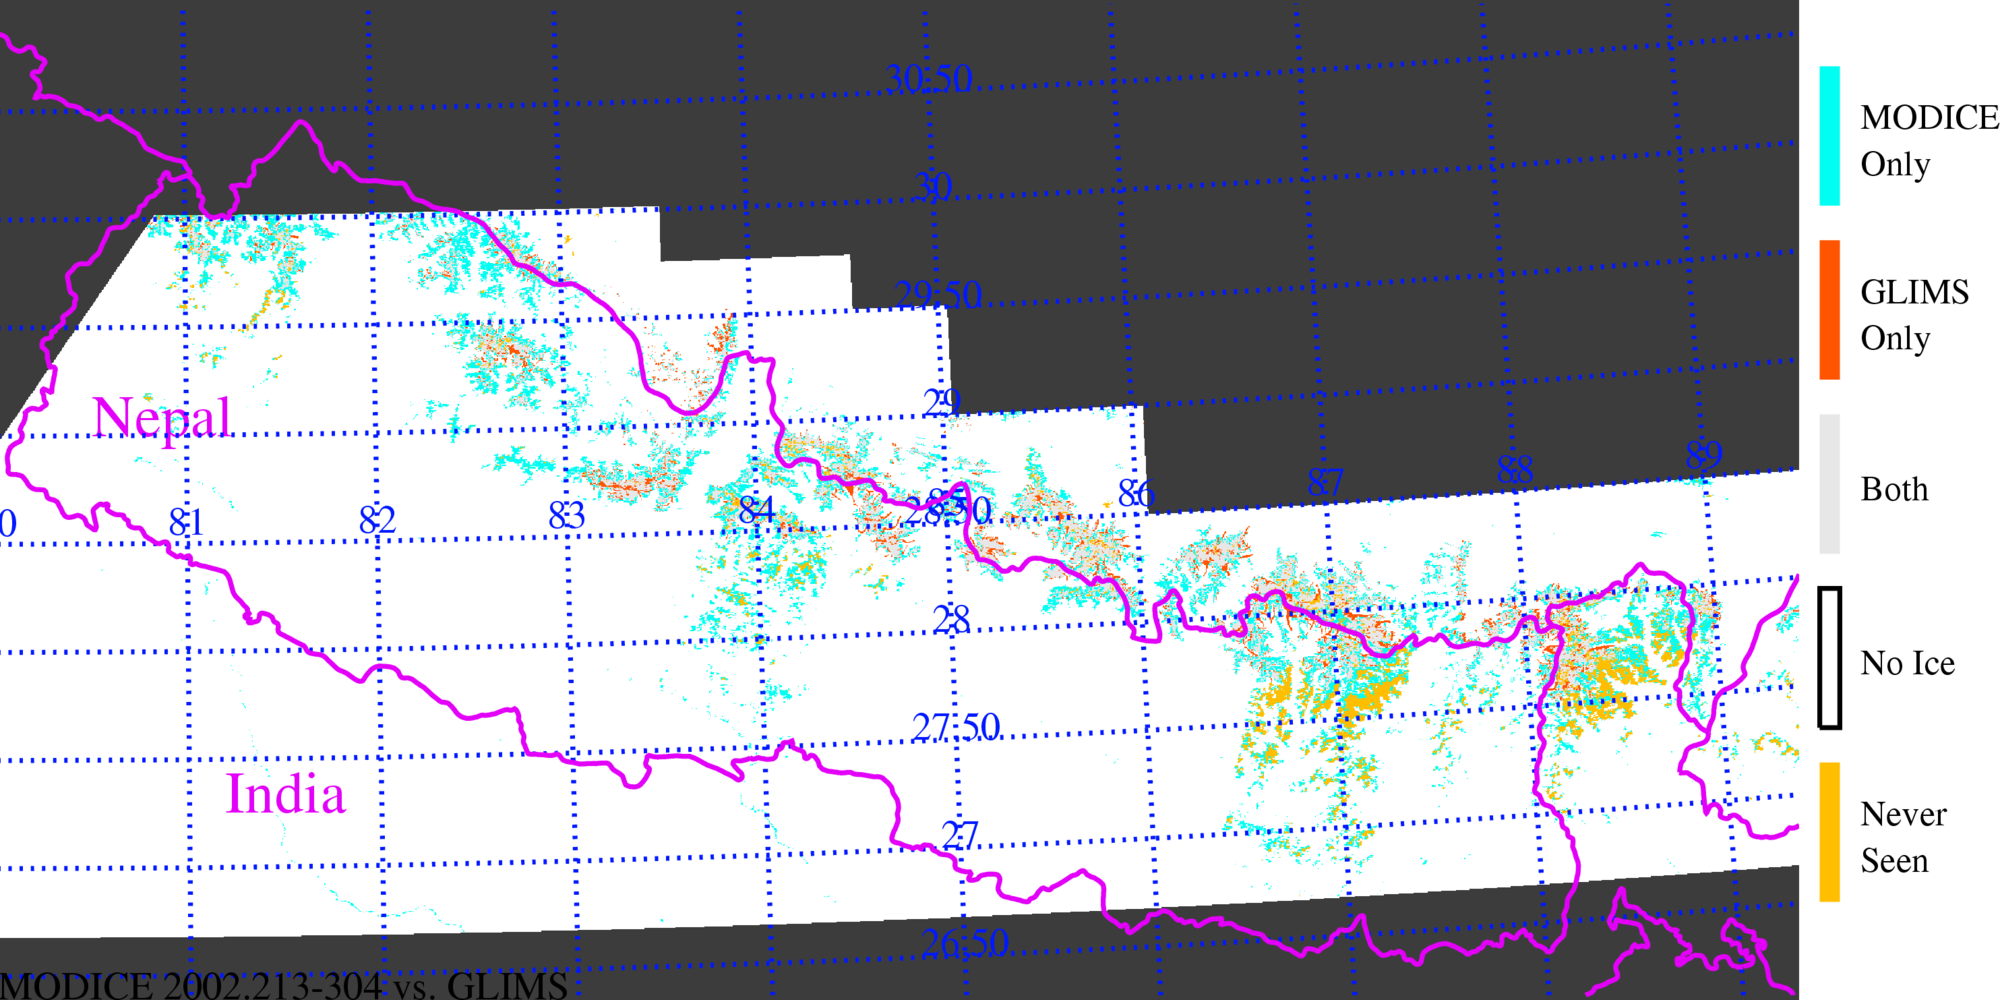 |
| 2002, sep-nov: MODICE vs. GLIMS outlines for Nepal |
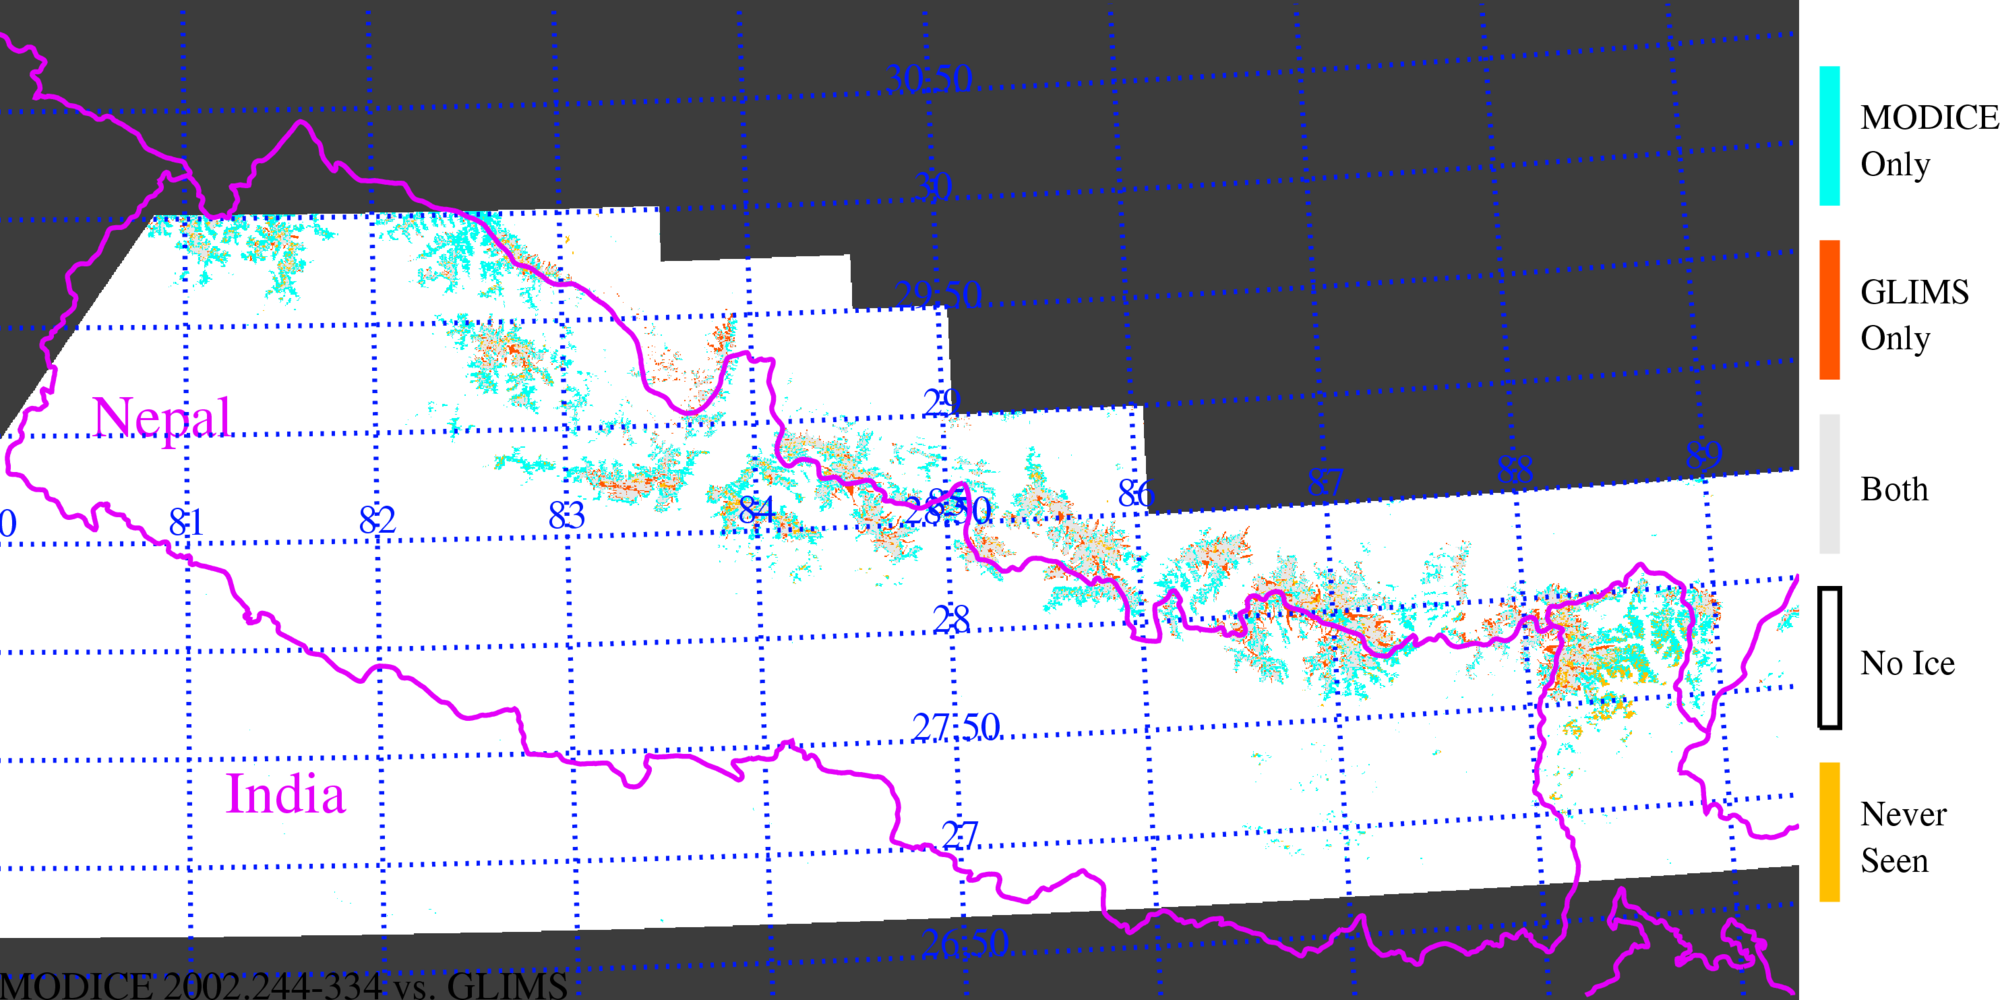 |
| 2001 + 2002, aug-oct: MODICE vs. GLIMS outlines for Nepal (cumulative processing for 2 years) |
 |
| 2001 + 2002, sep-nov: MODICE vs. GLIMS outlines for Nepal (cumulative processing for 2 years) |
 |
M. J. Brodzik <brodzik@nsidc.org>
Last modified: 4 Sep 2009