MODICEv02 Change in Upper Indus, 2001-2012

MODICEv02 Change in Upper Indus, 2001-2012

(Click on any panel to see full resolution version. In the new window, if your browser displays a plus sign in a circle, click again for even more detail)

MODICEv02 for Upper Indus tiles, change from minimum MODICE for 3 years from 2001-2003 to minimum MODICE for 3 years from 2010-2012. This is MODICEv02, so annual images are produced from 365 days. There were no "never_seen" pixels. Note the internal ice areas that are dark (meaning the minimum MODICE dropped below 15%, and so turned off. Is this showing up "one strike and you're out"?

tifs with data for top 2 images are on sidads ftp. Values are 0-100 (minimum modscag for respective period, and 255 for locations outside Indus basin.

minimum MODICE for 3 years, 2001-2003
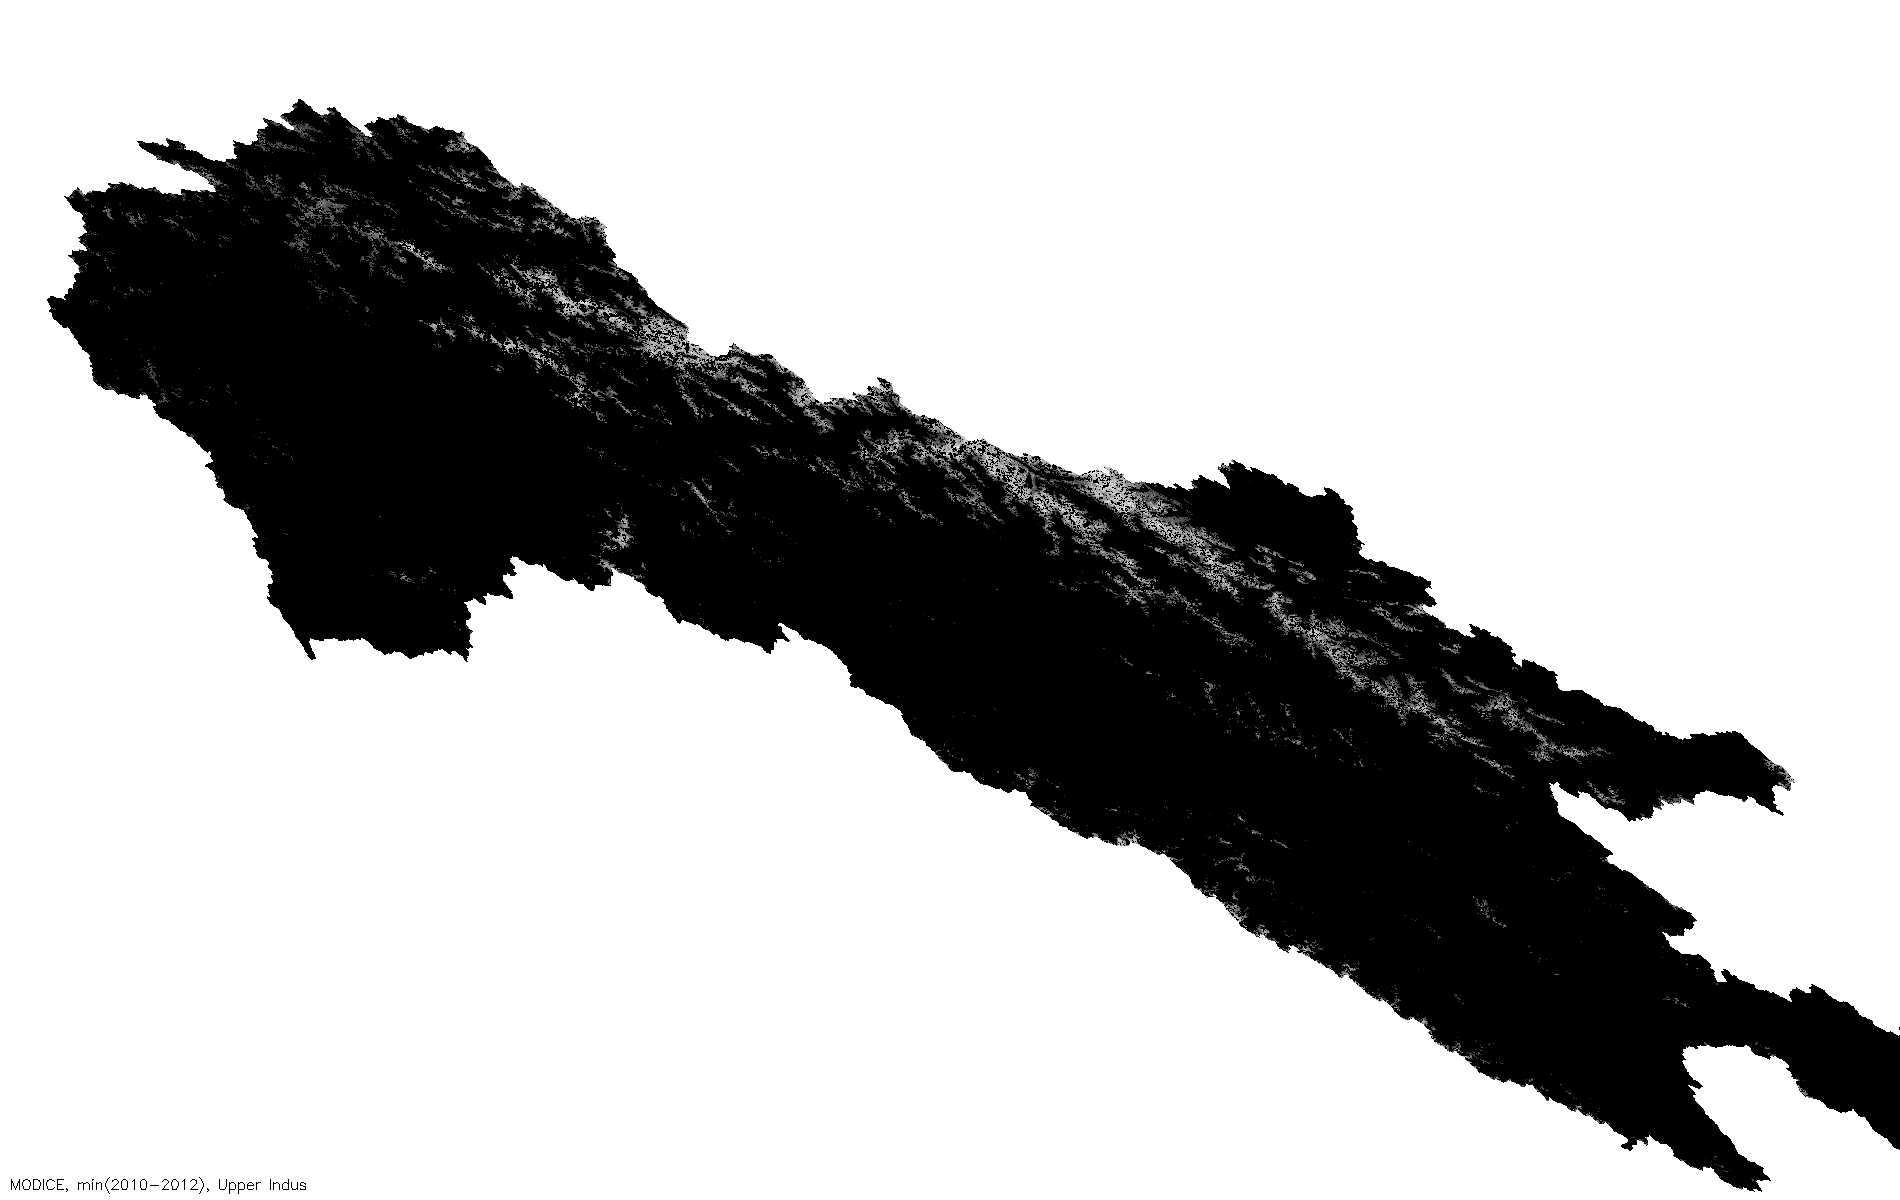
minimum MODICE for 3 years, 2010-2012
percent difference in MODICE, 2001-2012
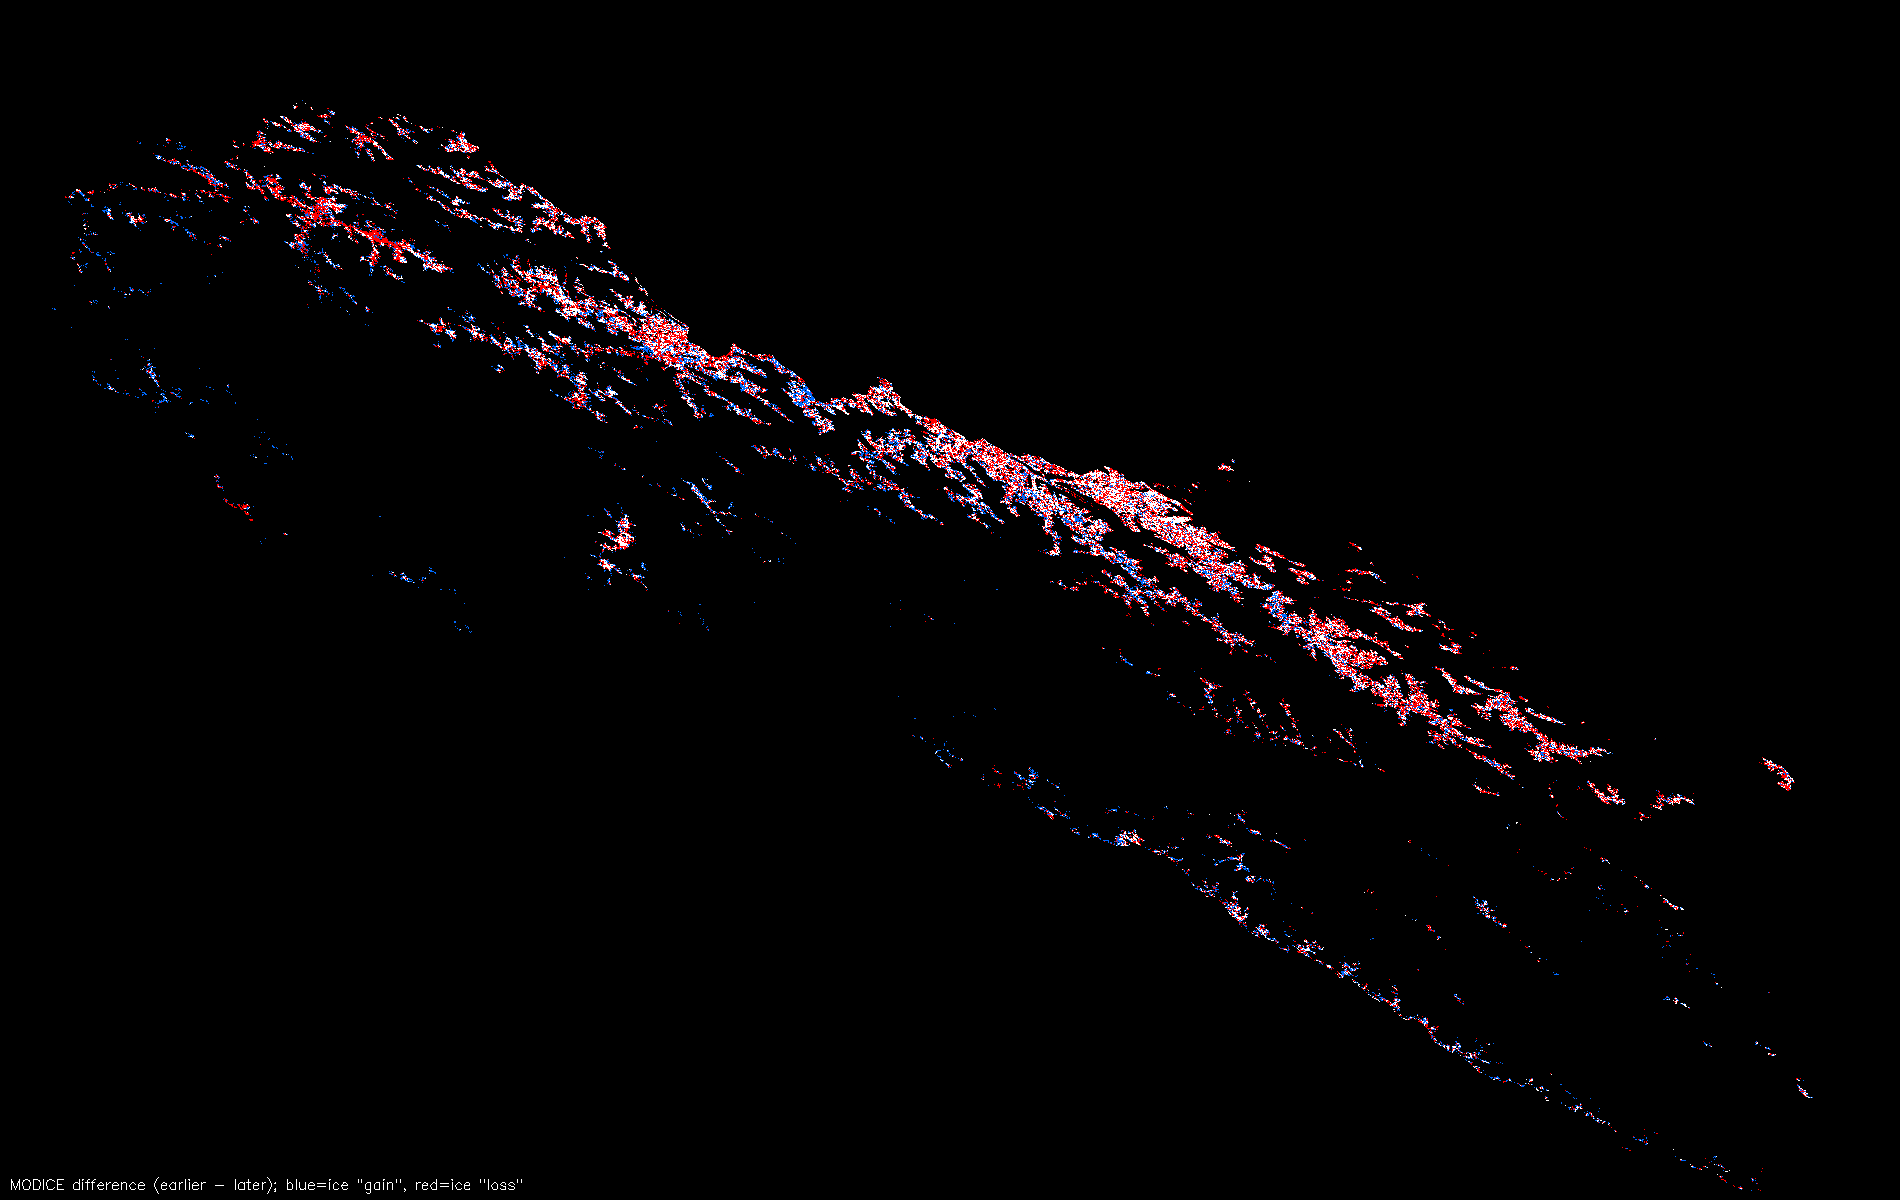
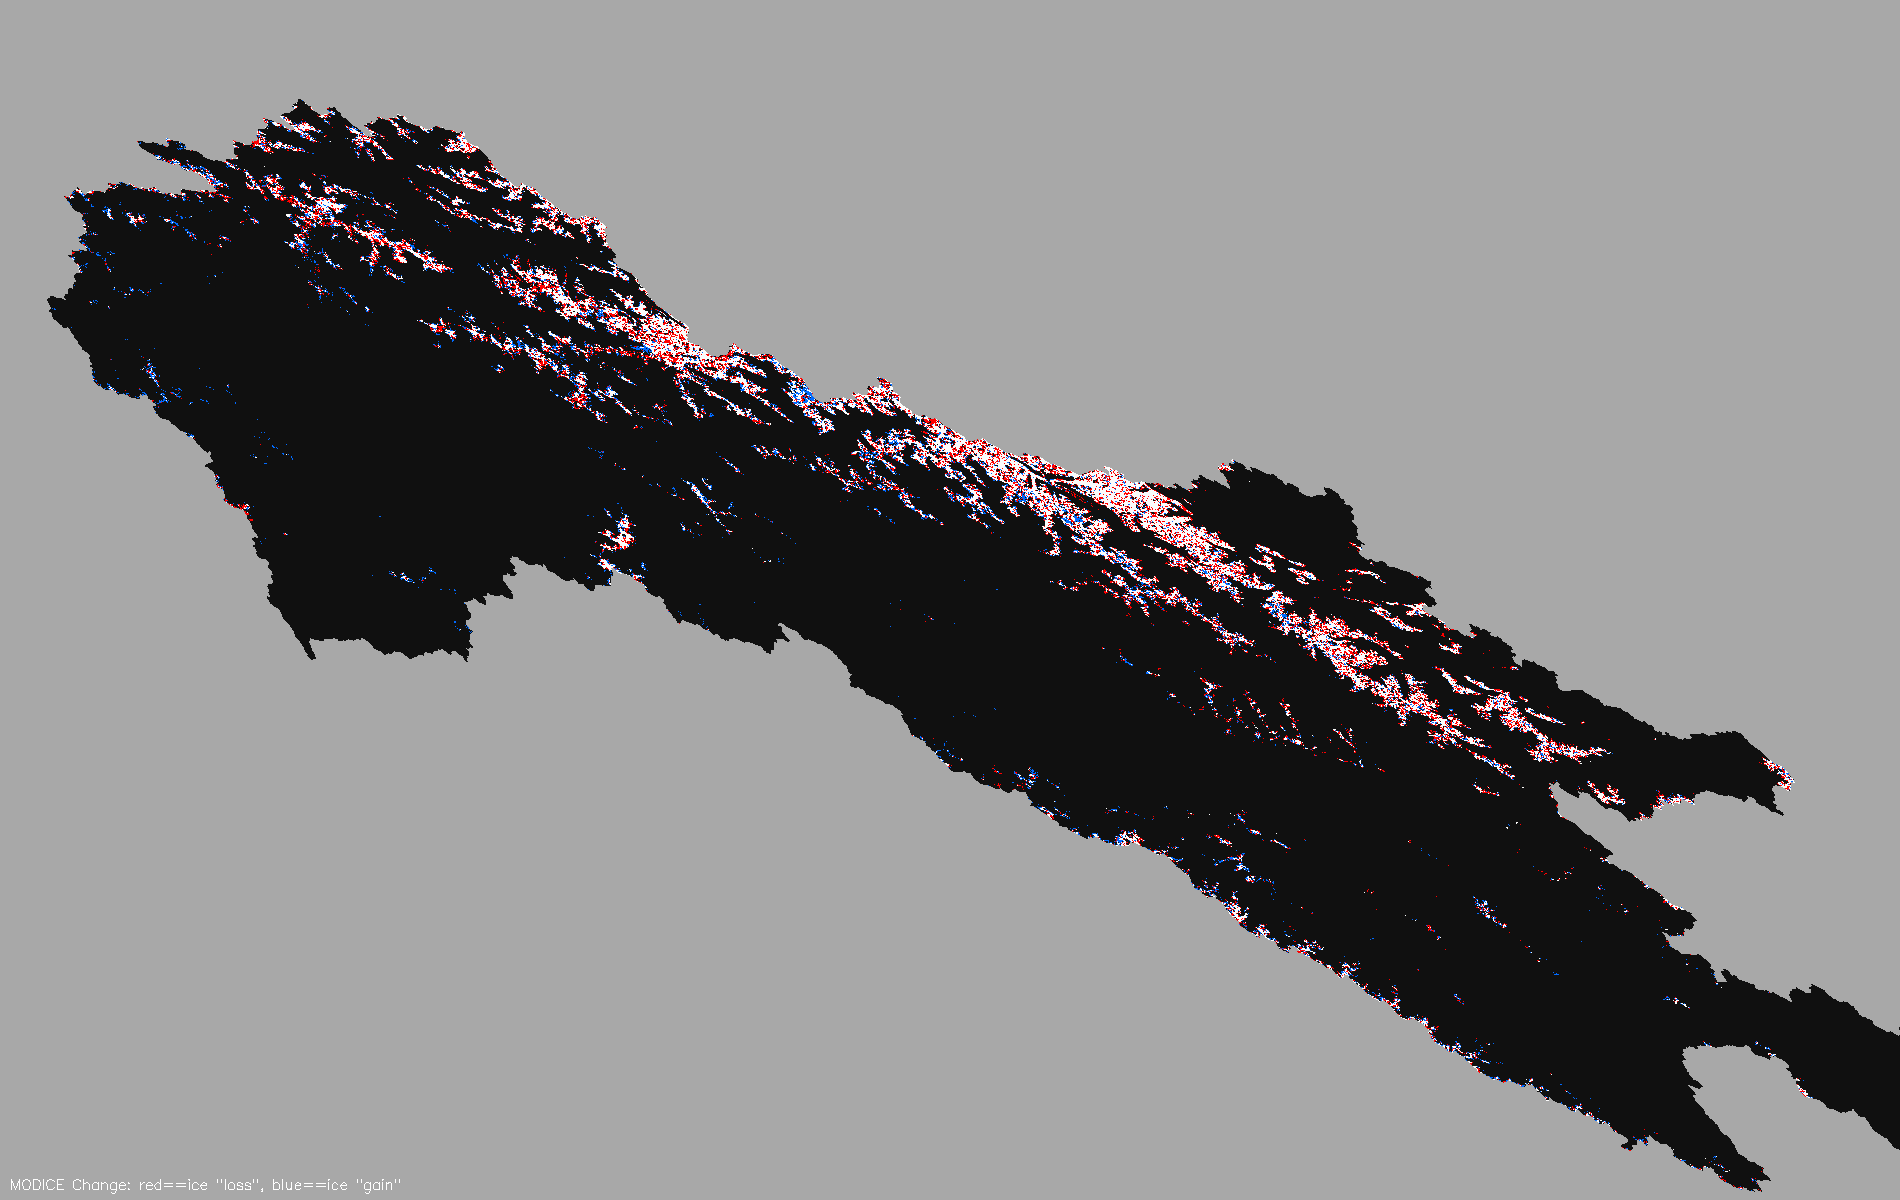
binary difference in MODICE, 2001-2012
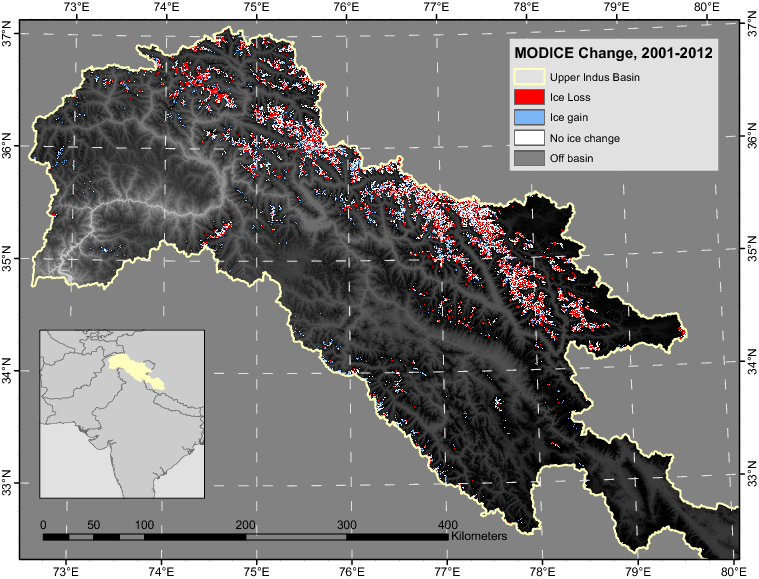
Reprojected version of percent difference in MODICE, 2001-2012, showing +/- 10% as "no change"
Time series, MODICE v1 (from our paper)
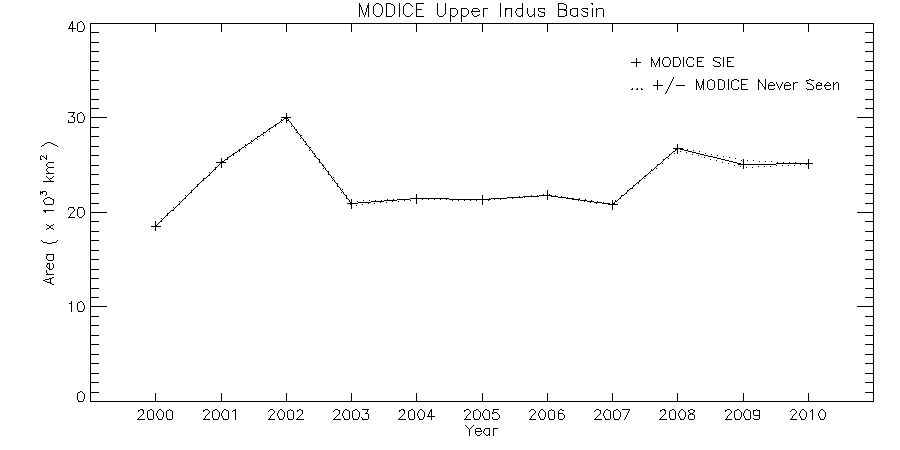
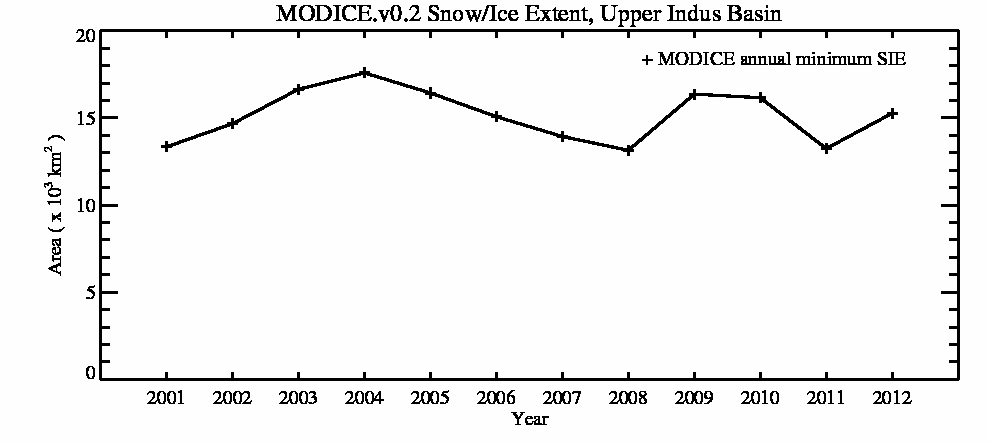
Time series, new MODICE v2 (using full annual data) (N.B. note average over time decreased from about 23,000 km^2 to around 15,000, and interannual variability is lower, both of which we should expect from the changes in the data. Never seen area in new data is < 2 km^2 for the Upper Indus. )


M. J. Brodzik <brodzik@nsidc.org>