Comparison of NOHRSC scag vs. MODSCAG output at NSIDC
|
Comparison of NOHRSC scag vs. MODSCAG output at NSIDC
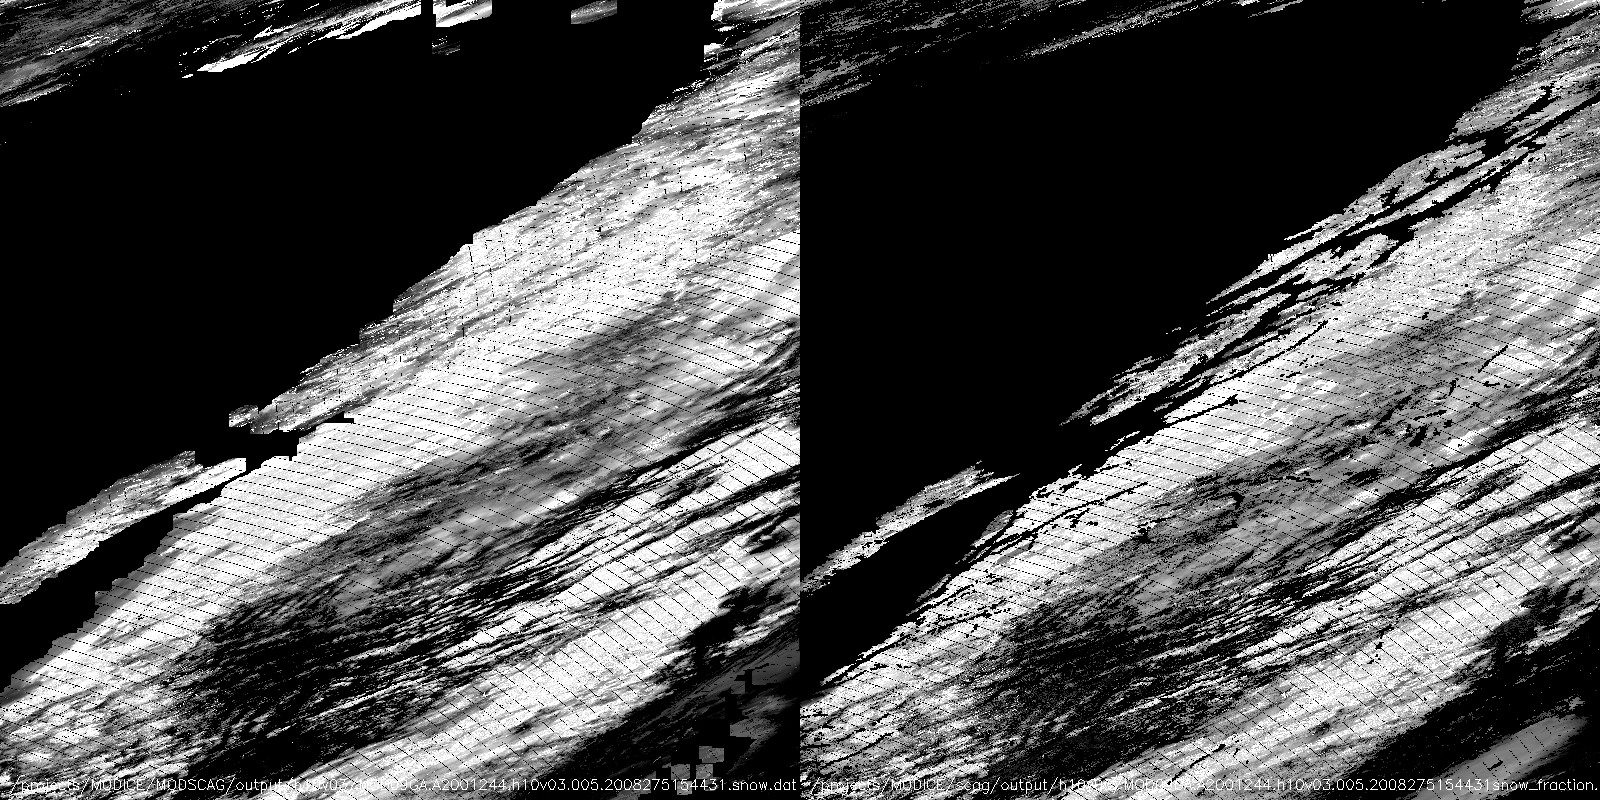
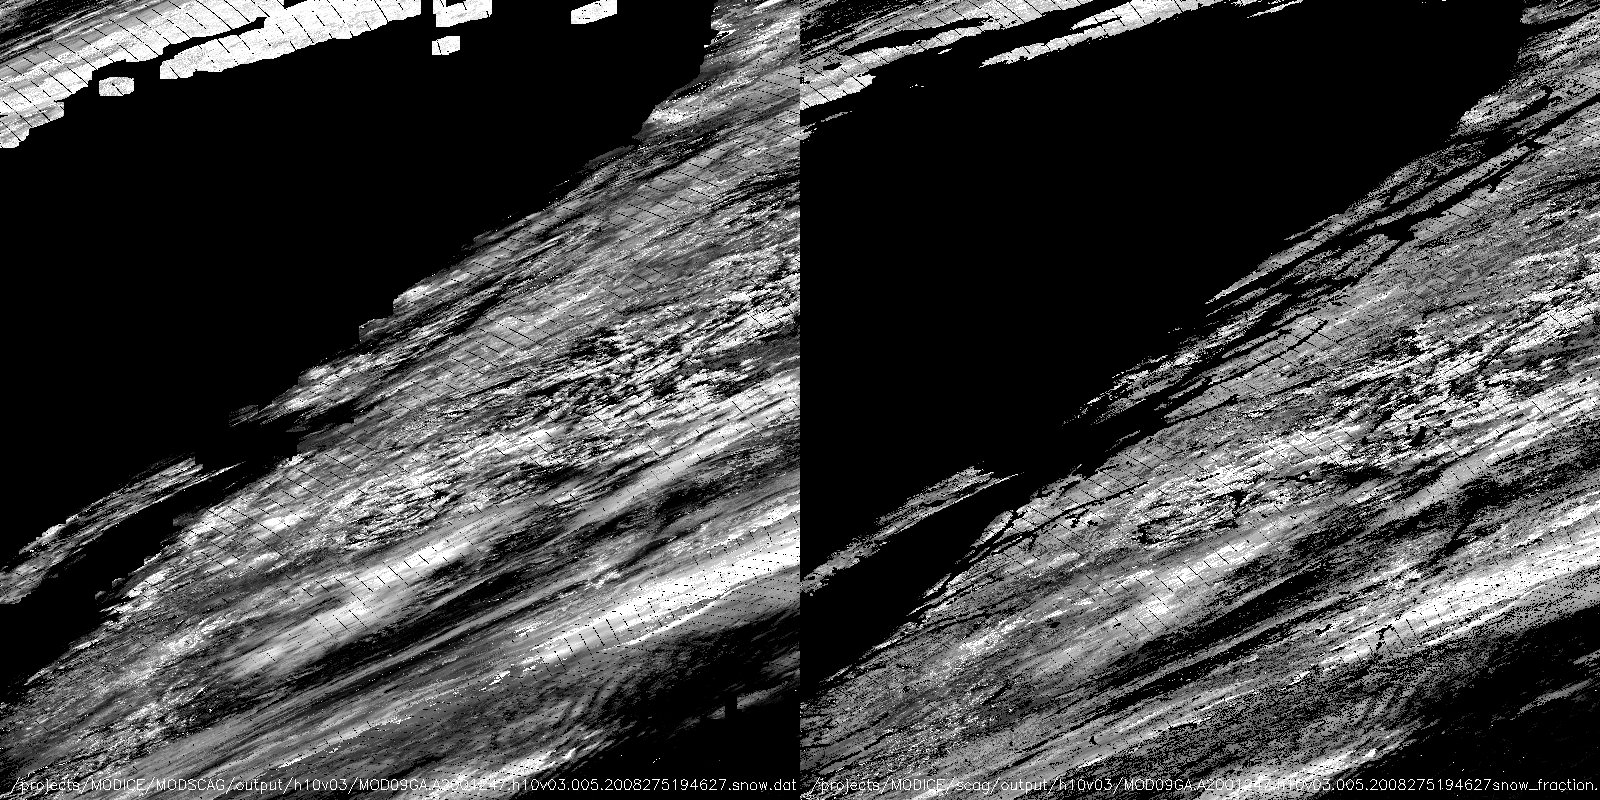
I compared original, NSIDC MODSCAG processing to NOHRSC scag output for h10v03 (SE Alaska tile). Each row contains
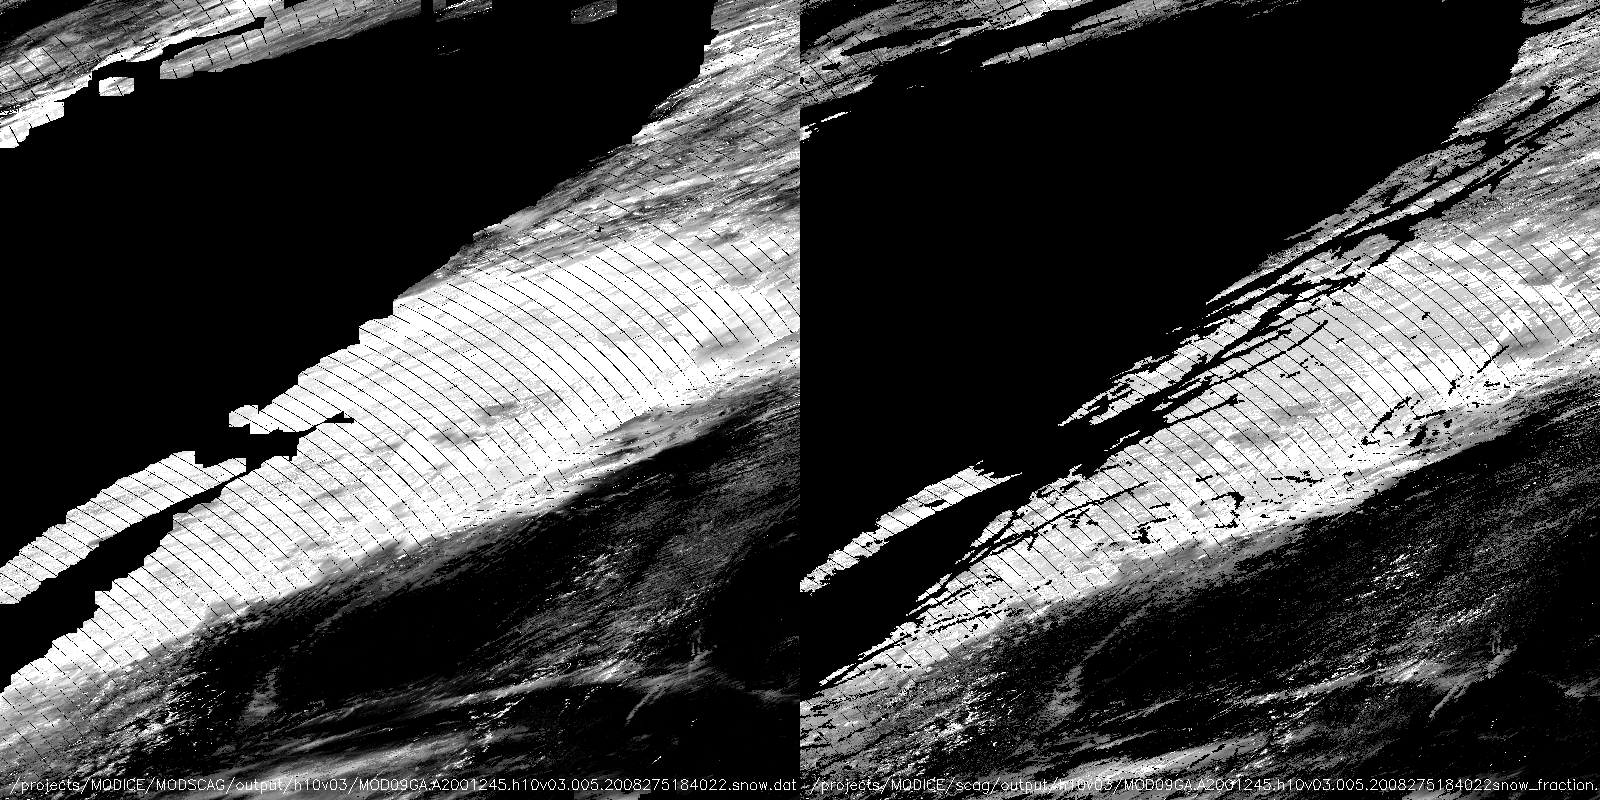
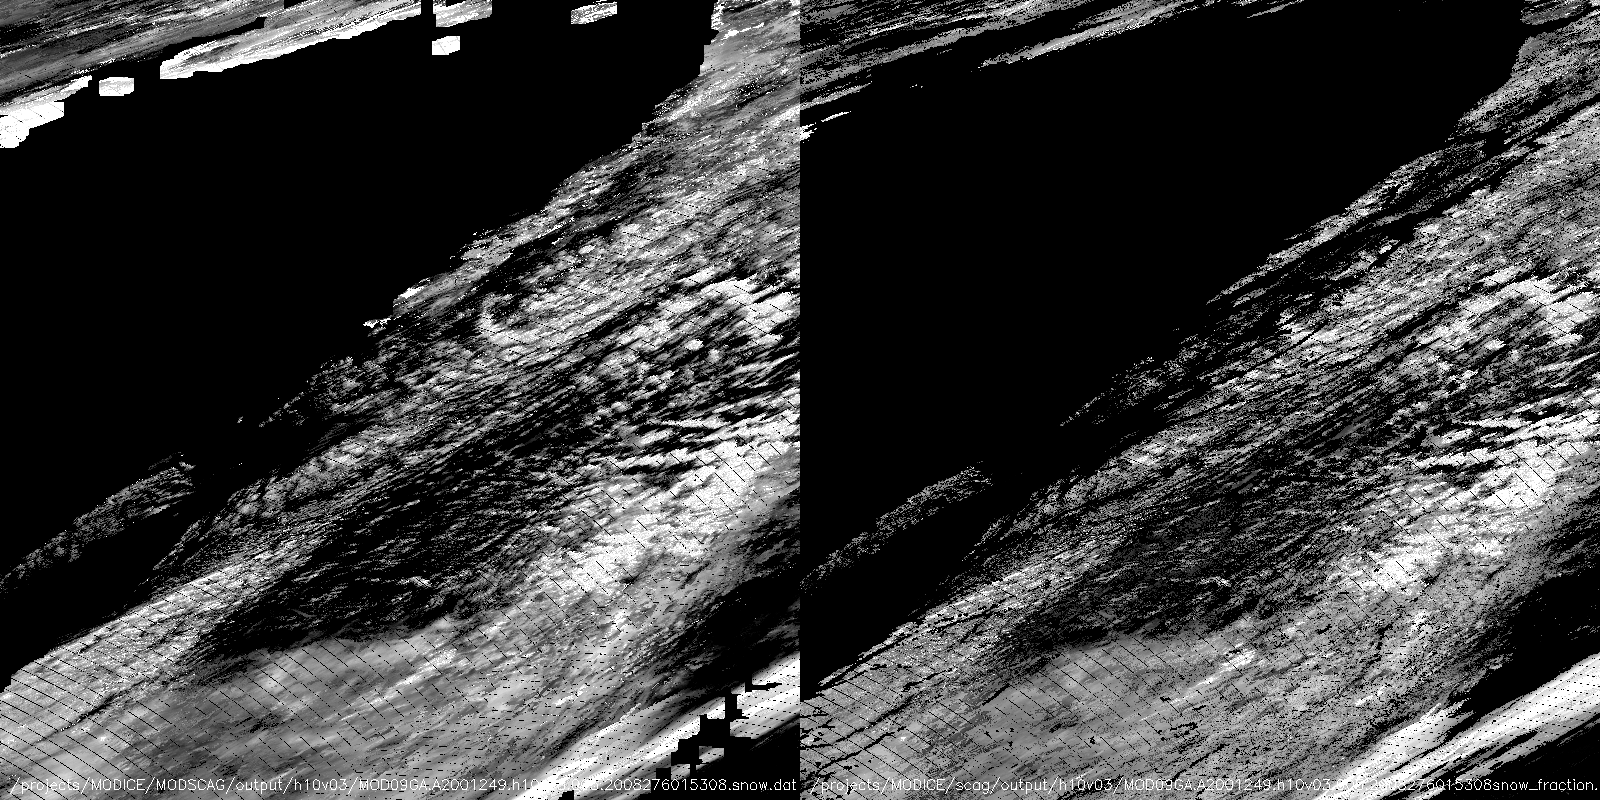
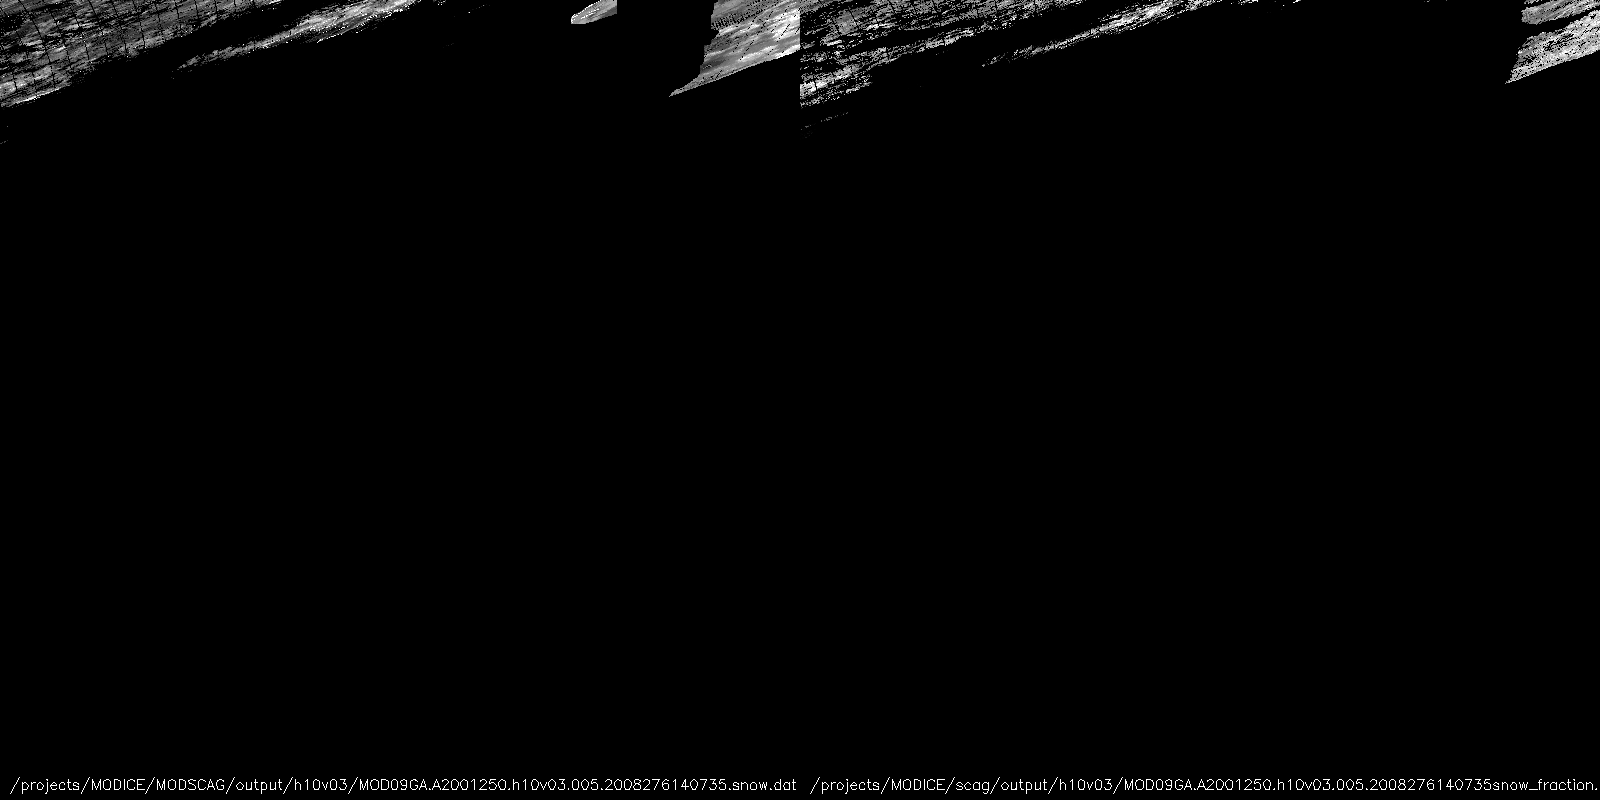
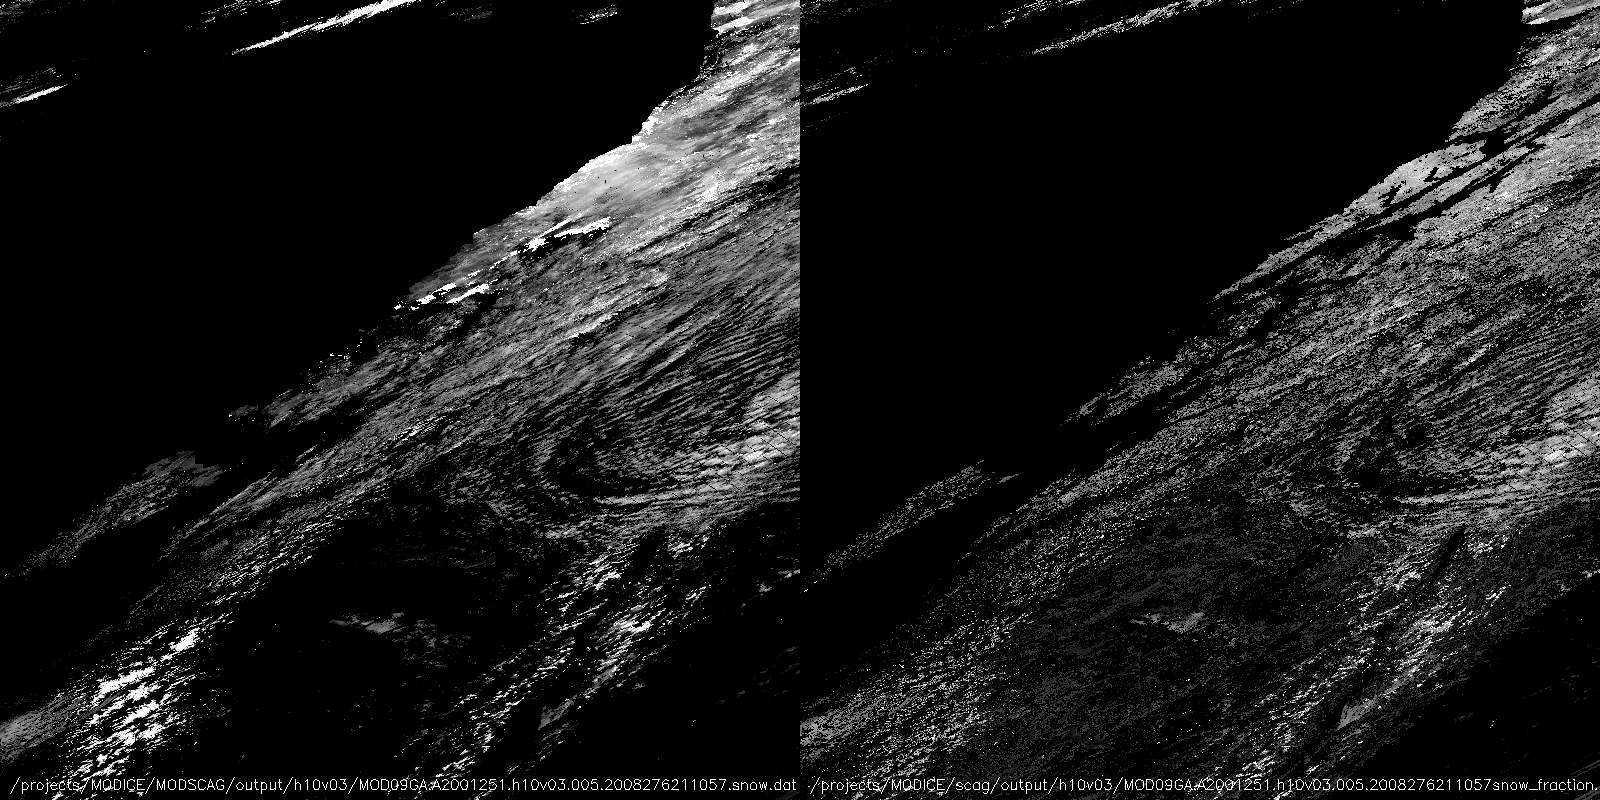
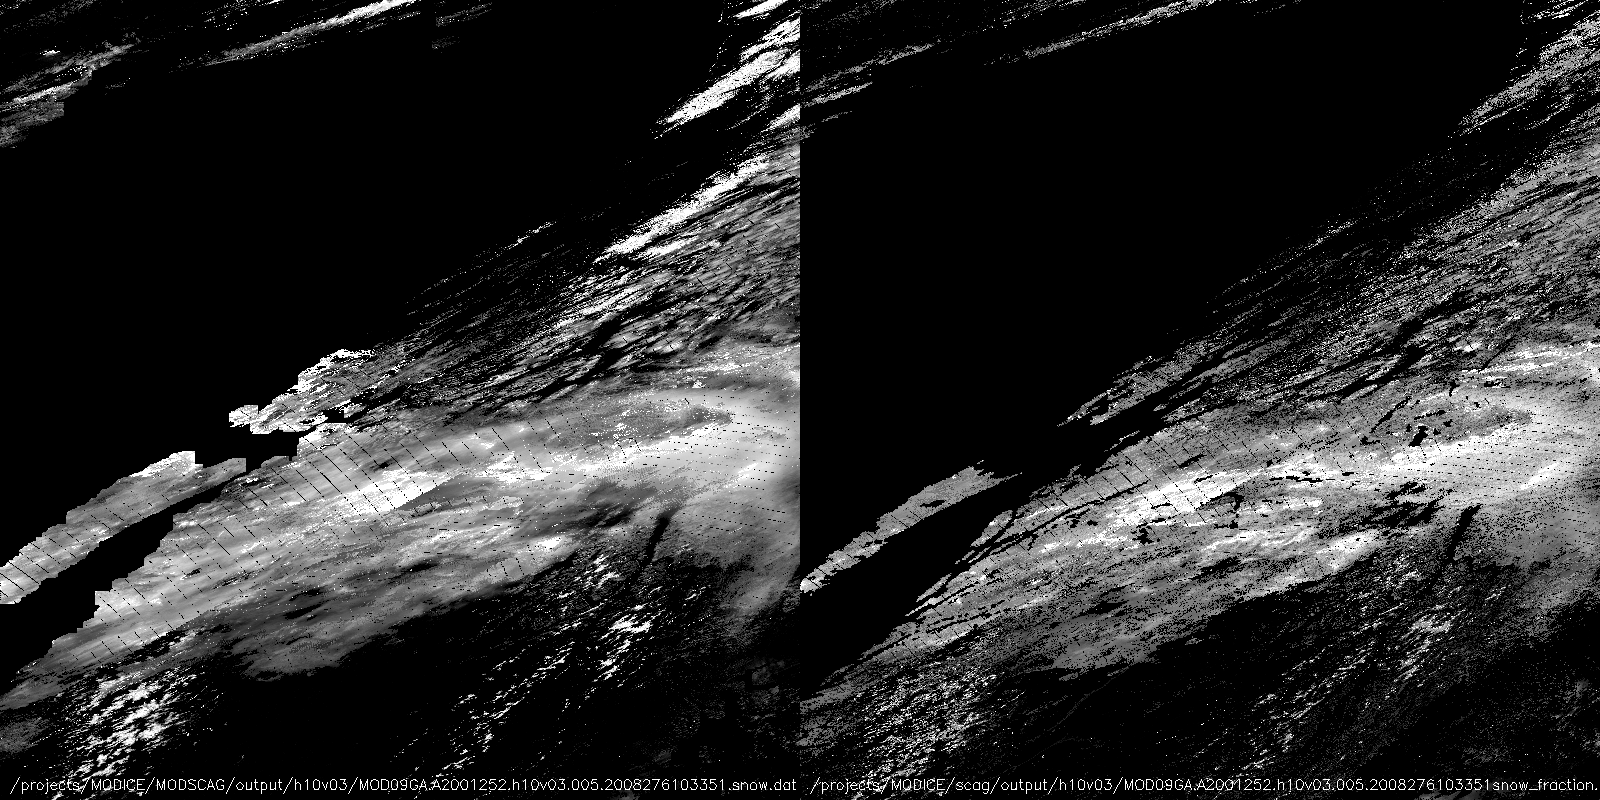
Original MODSCAG output (note blocky cutouts, due to my "likely ice" mask processing
NOHRSC scag output (note advantages of using land mask extracted from MOD09GA data)
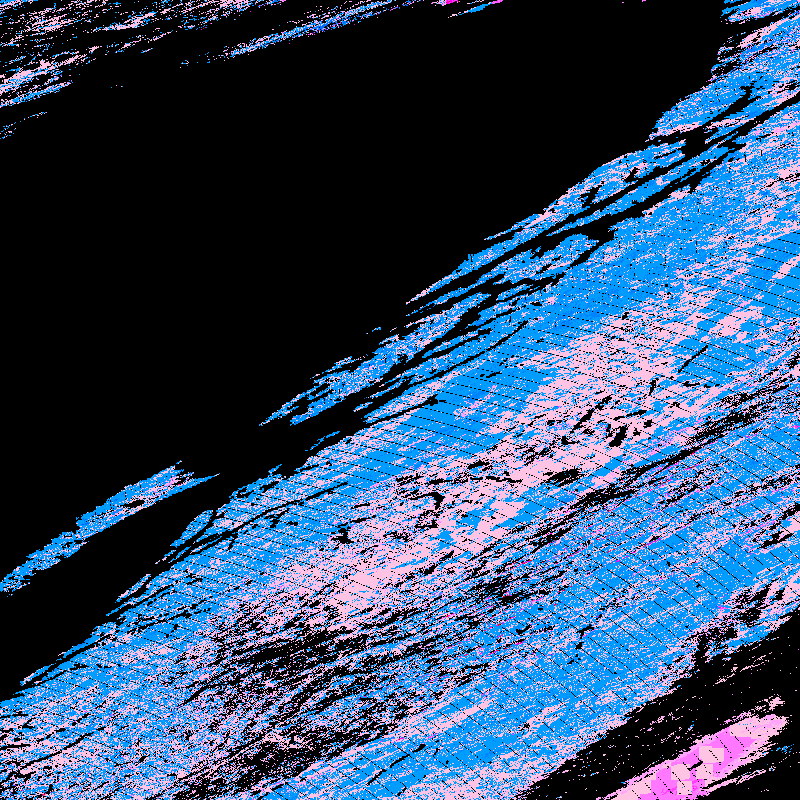
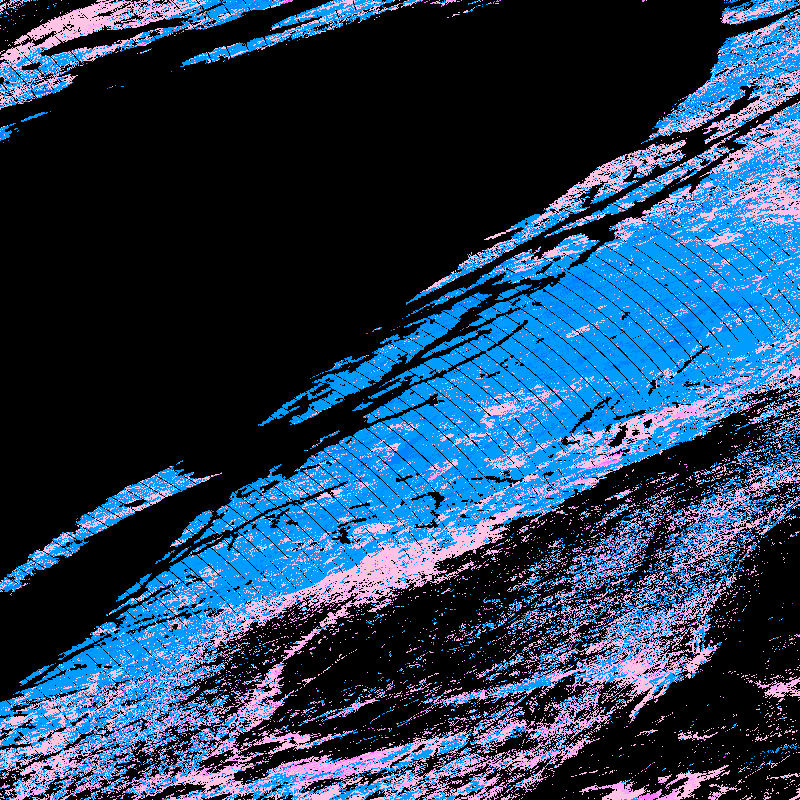
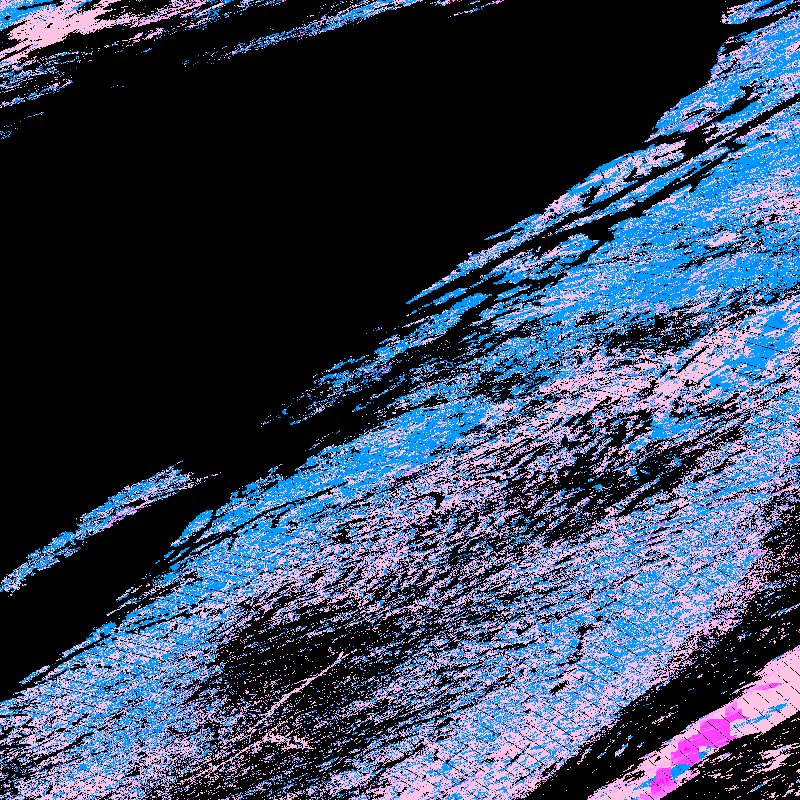
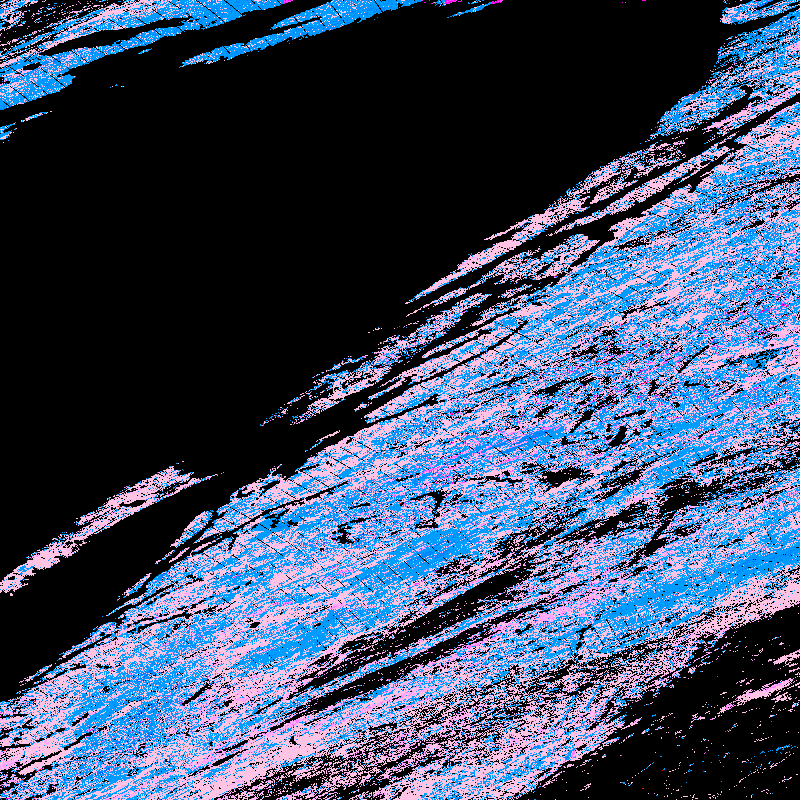
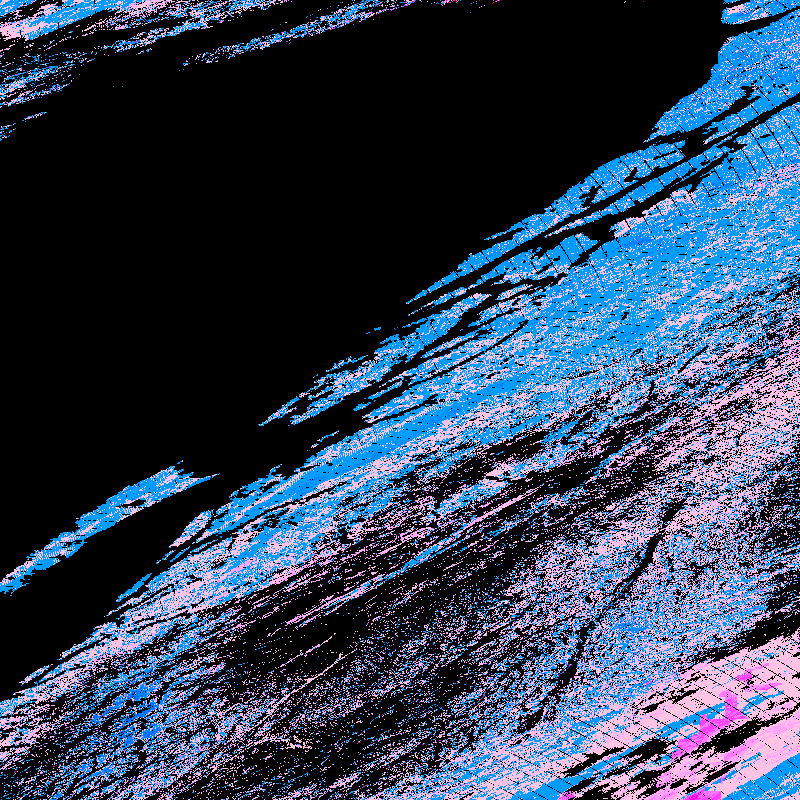
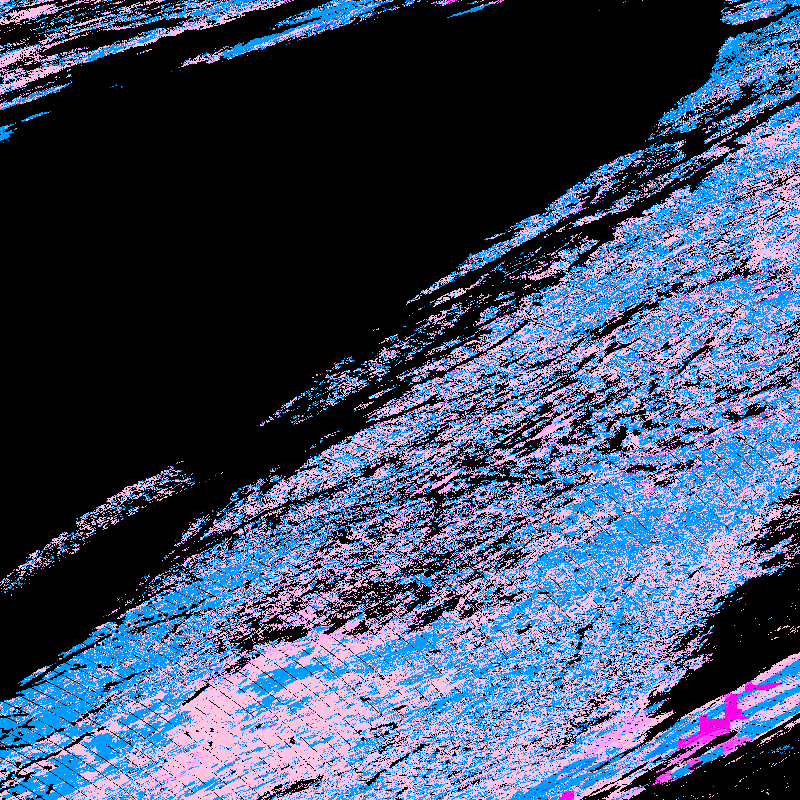
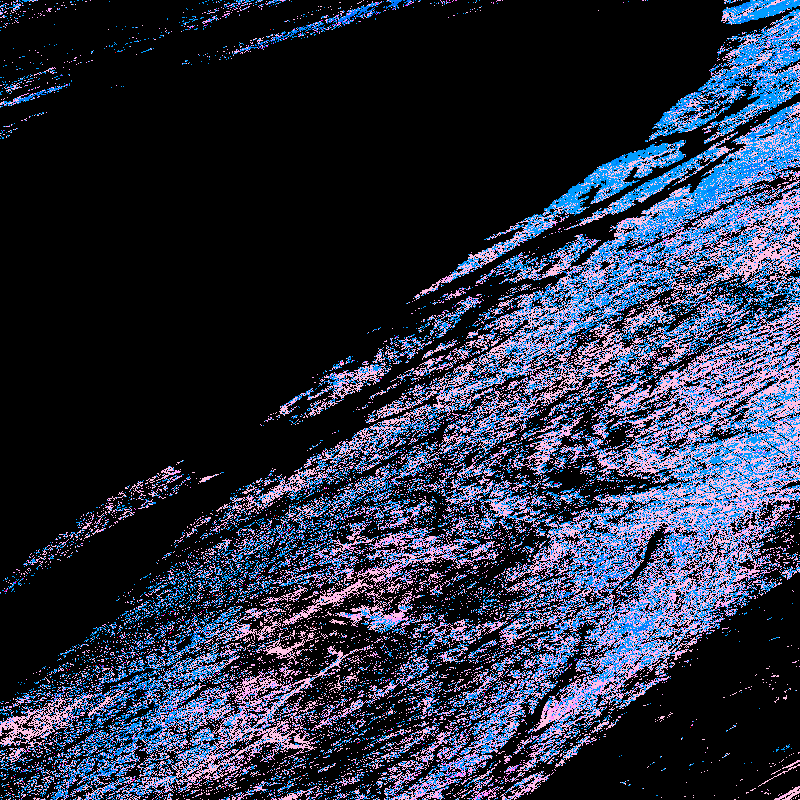
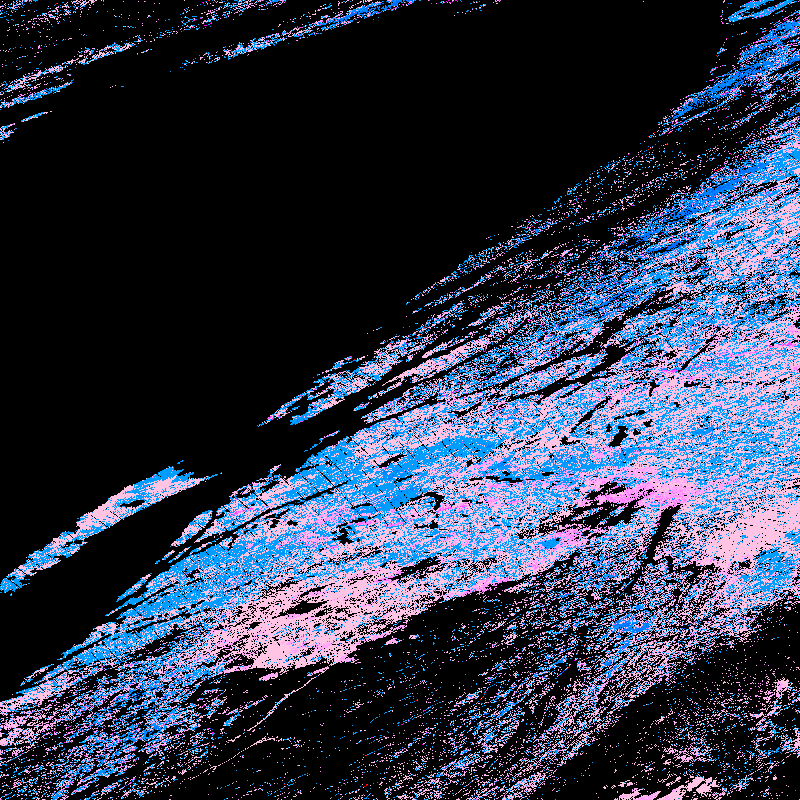
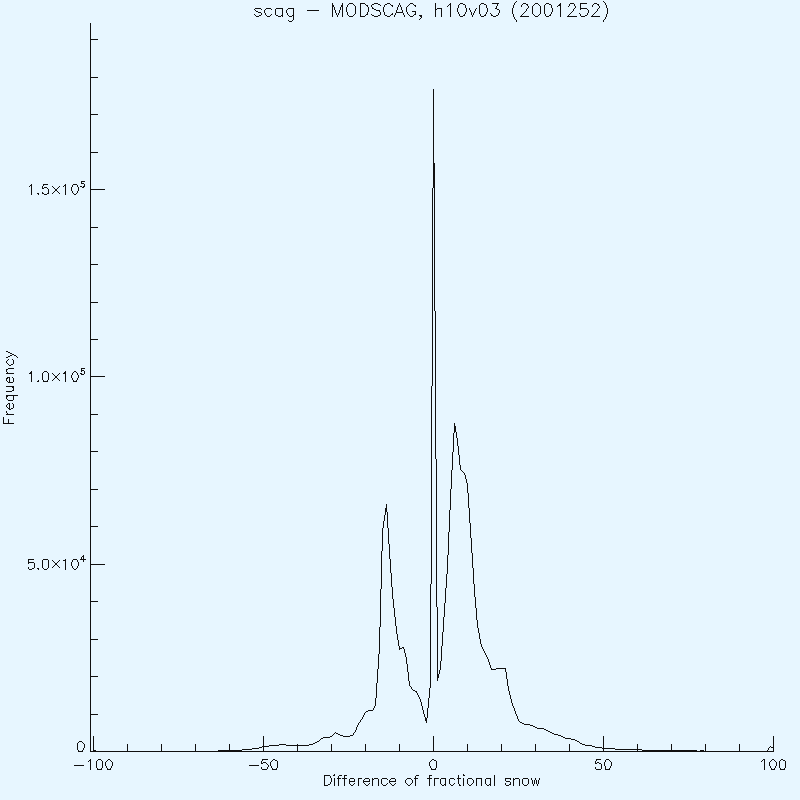
Difference image (anyplace where scag returned -0.01 I mapped to black); difference is scag - MODSCAG, blues are negative, pinks are positive
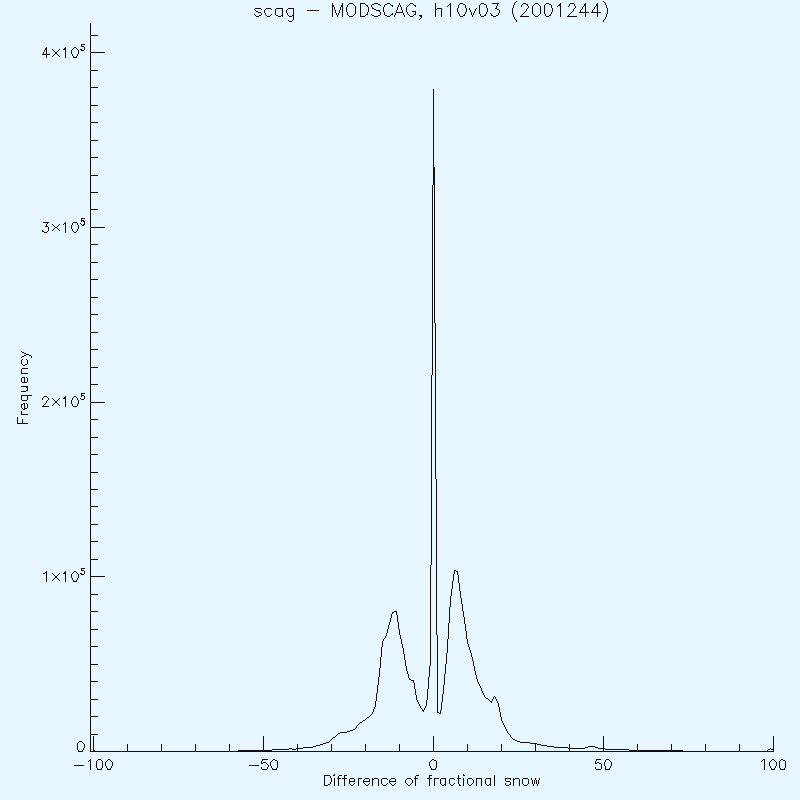
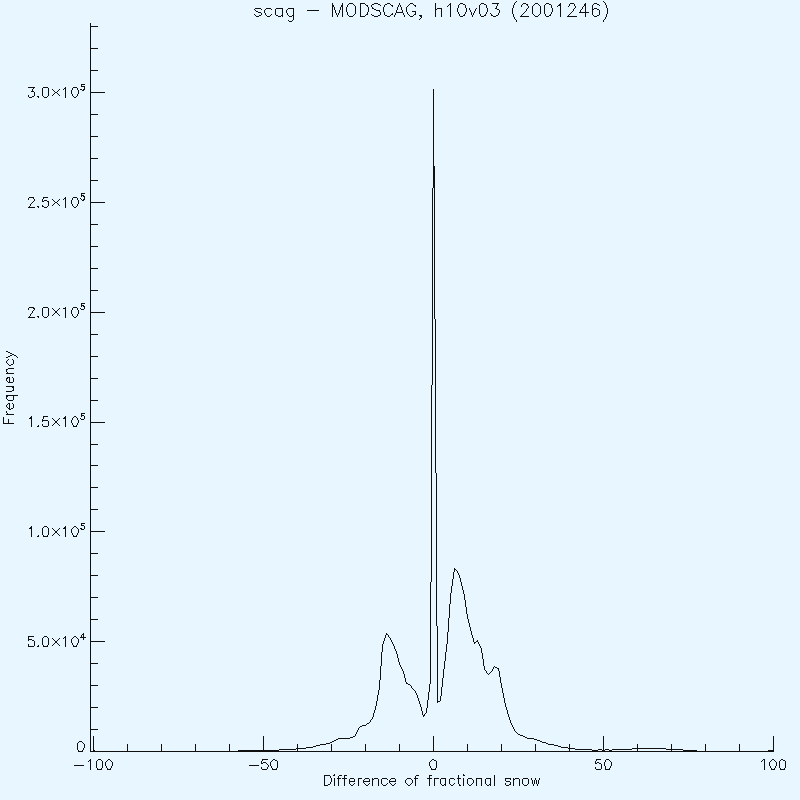
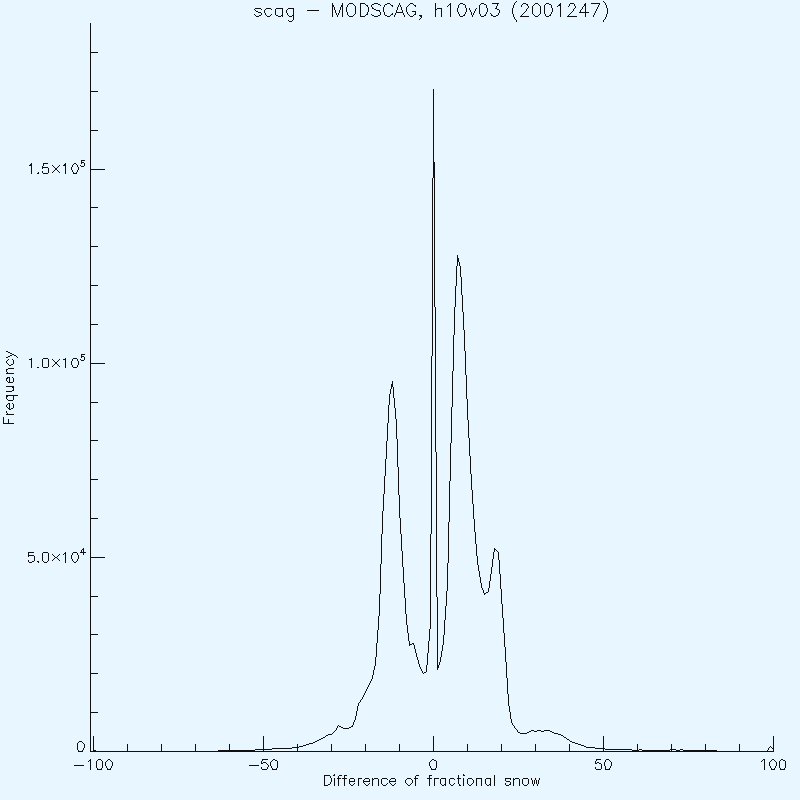
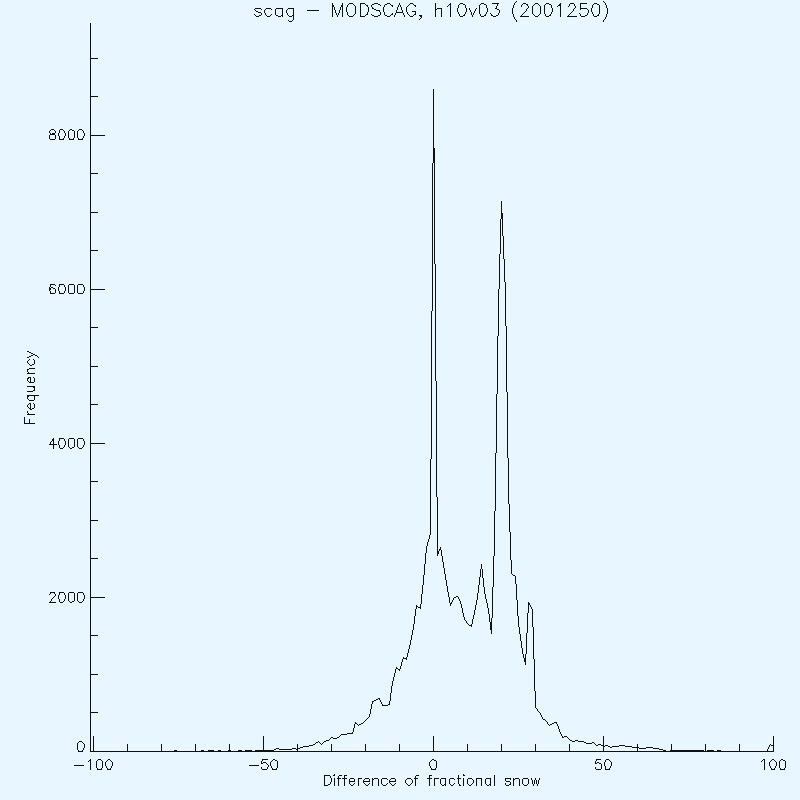
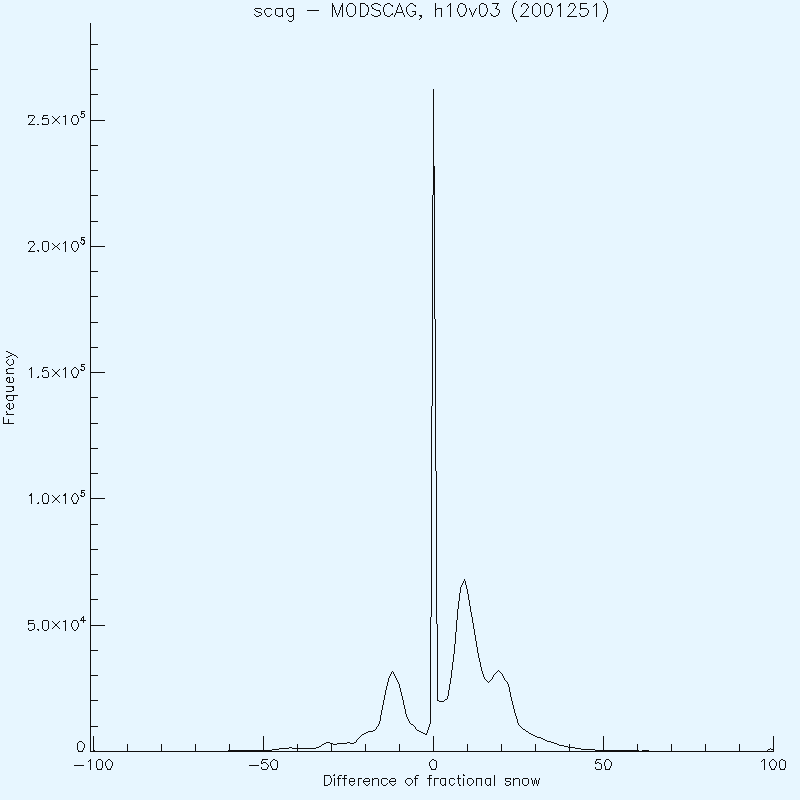
Difference histogram (ignores pixels where scag=-0.01)
NOHRSC scag processing is multi-threaded. I ran it on snow, using 4 of 8 processors. The average time to process a complete tile with MODSCAG used to be 11 hours; scag is taking about 30 minutes.
(Click on any panel to see full resolution version. In the new window, if your browser displays a plus sign in a circle, click again for even more detail)
| Date |
Original MODSCAG output and NOHRSC scag output |
scag - MODSCAG image |
scag - MODSCAG histogram |
| 2001244 (Sept 1) |
 |
 |
 |
| 2001245 (Sept 2) |
 |
 |
 |
| 2001246 (Sept 3) |
 |
 |
 |
| 2001247 (Sept 4) |
 |
 |
 |
| 2001248 (Sept 5) |
 |
 |
 |
| 2001249 (Sept 6) |
 |
 |
 |
| 2001250 (Sept 7) |
 |
 |
 |
| 2001251 (Sept 8) |
 |
 |
 |
| 2001252 (Sept 9) |
 |
 |
 |
M. J. Brodzik <brodzik@nsidc.org>