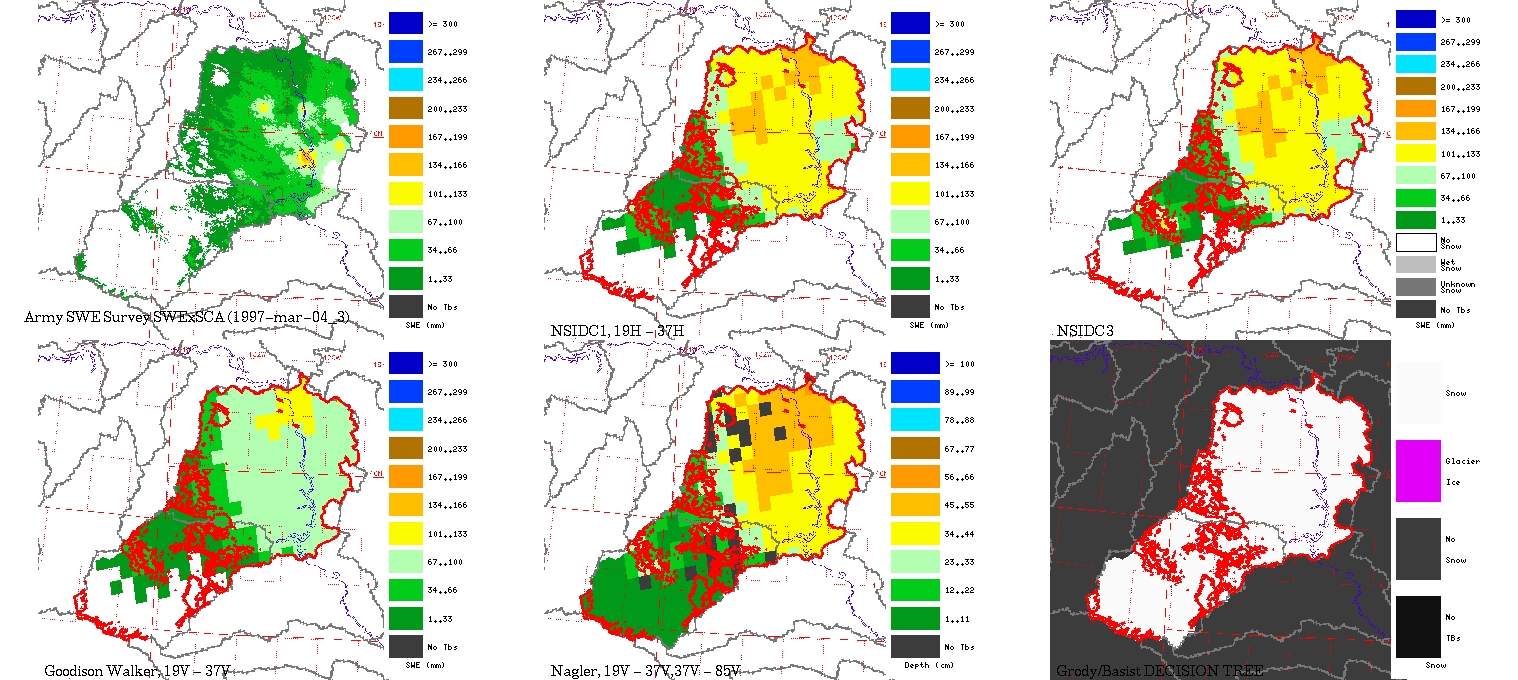
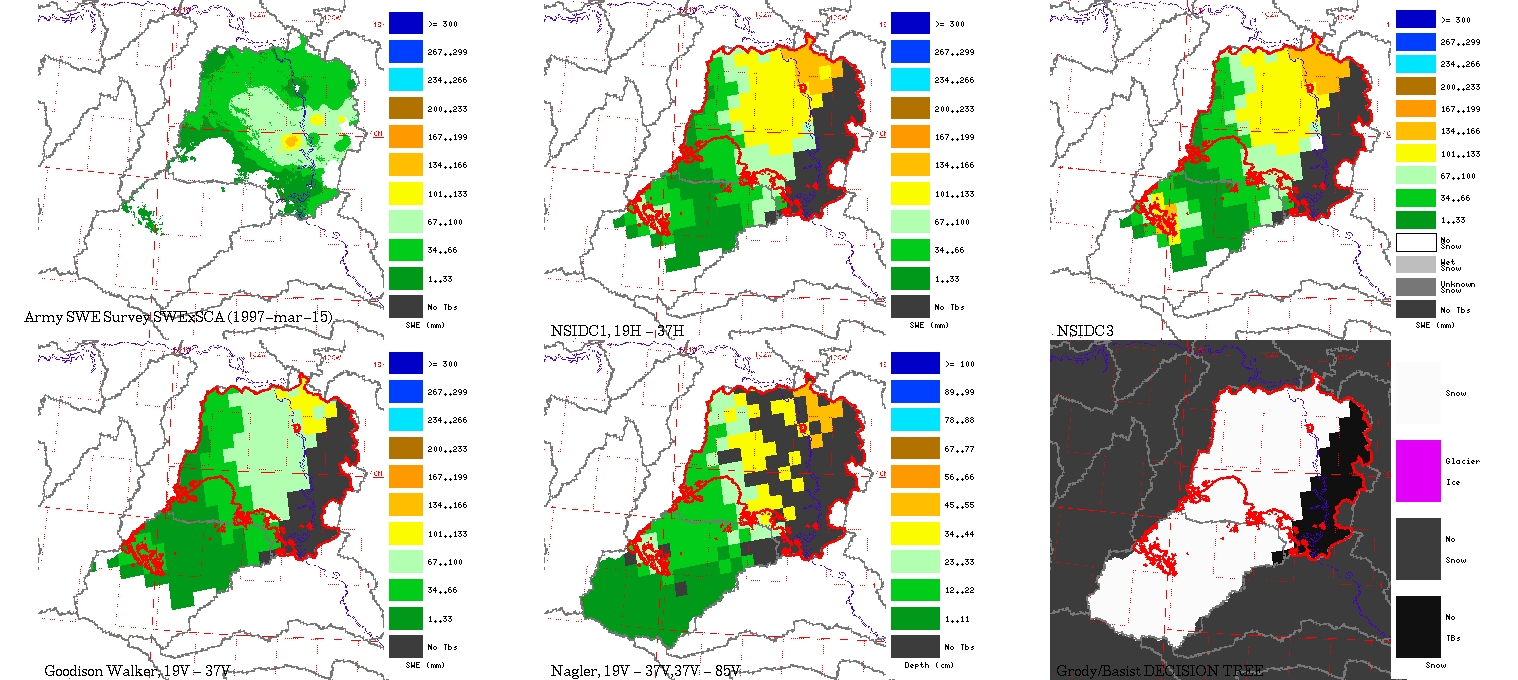
Oahe Basin SWE Comparison: Survey SWExSCA vs. SSM/I
The following sets of images and plots are comparisons for the dates
when the Corps of Engineers performed snow surveys. For each date,
the upper left subimage contains surveyed Army SWE data (converted
from inches to mm) for the Oahe basin, multiplied by the fraction of
snow covered area derived from AVHRR. Each subsequent subimage is one
of the passive microwave algorithm outputs for the same date, masked
for the basin area only. The red outline in the PM images is the
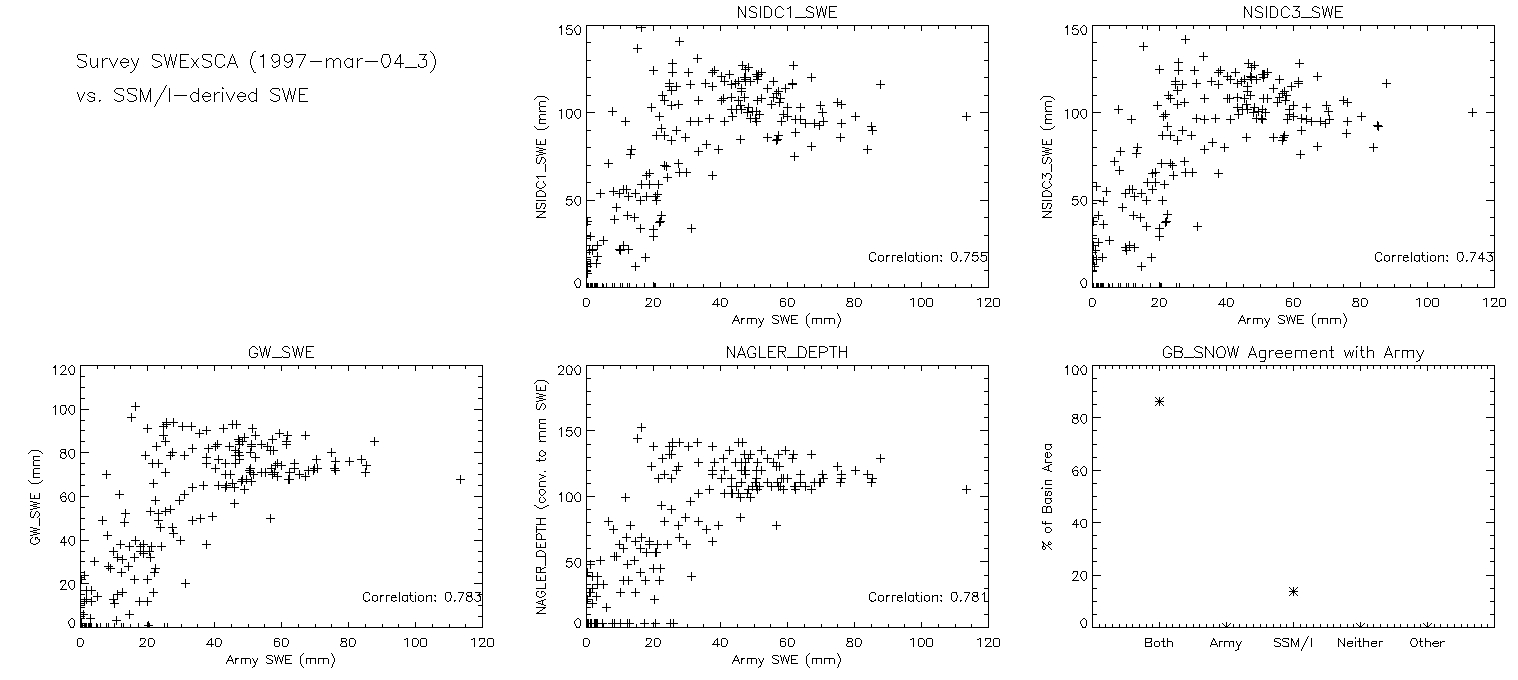
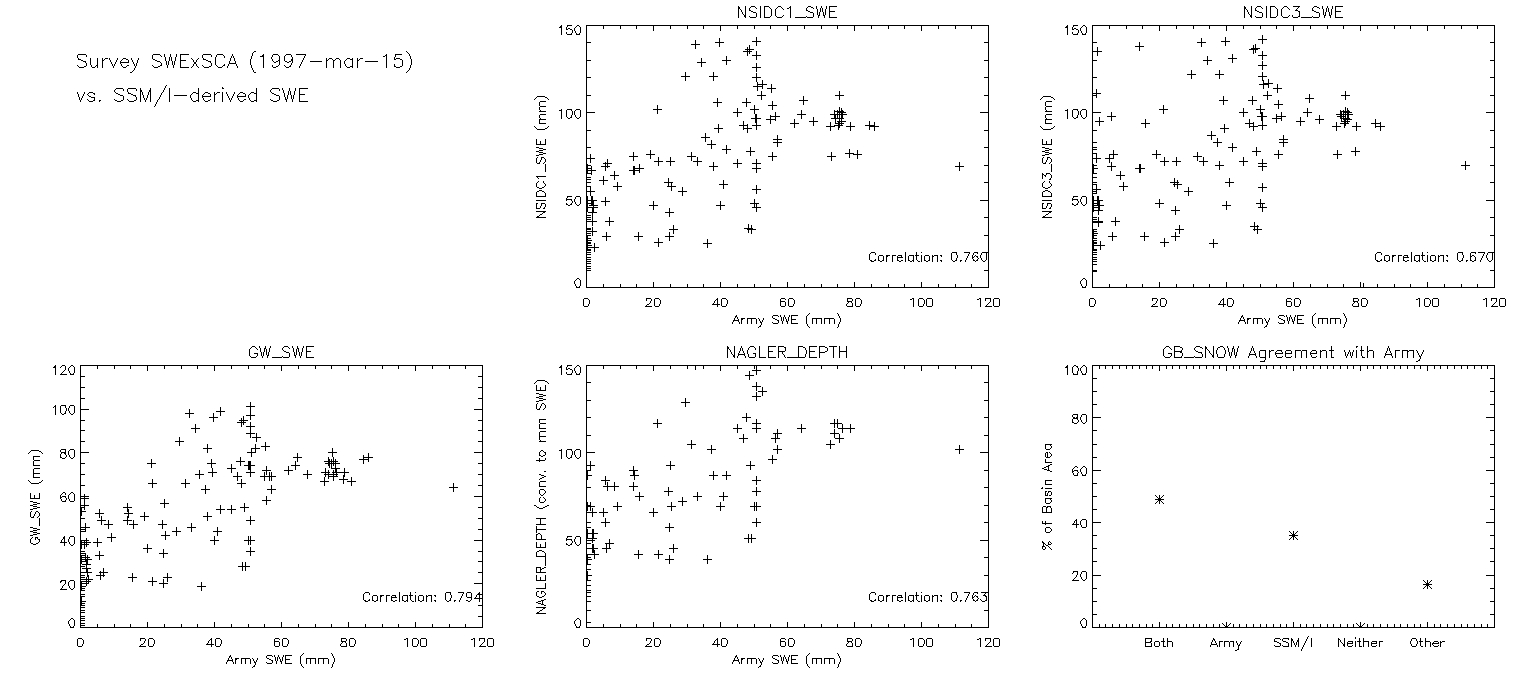
outline of the Army data SWExSCA extent. The plots contain scatter plots
of the Army data vs. each algorithm output. Only SWE values are
considered (i.e. "wet" snow flags and pixels with missing TBs are
eliminated).
(Click on any panel to see full resolution version.)