 |
EASE-Grid 18H Tb Time Series |
 |
|
EASE-Grid 18H Tb Time Series |
|
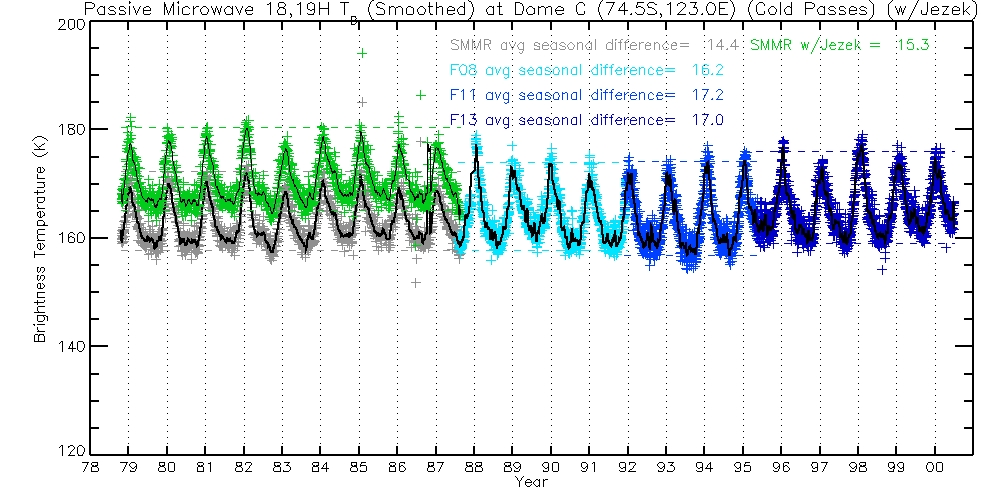
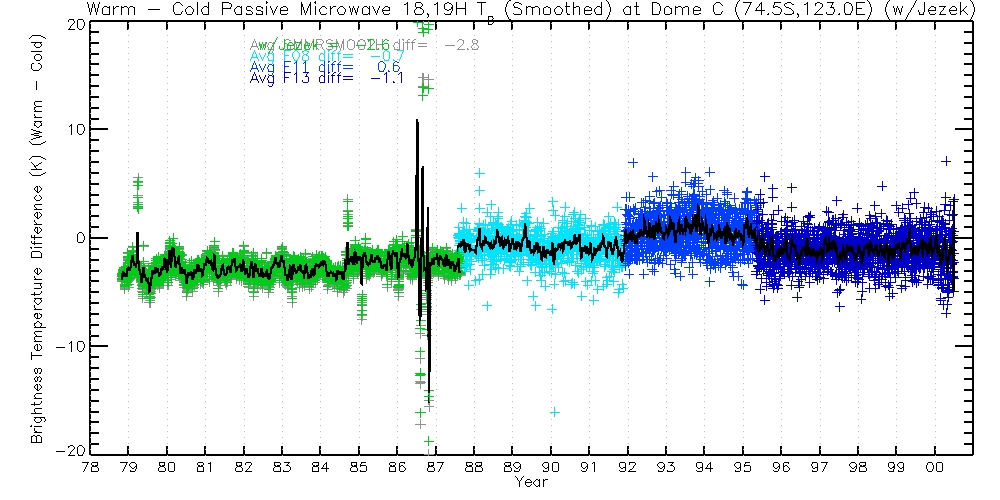
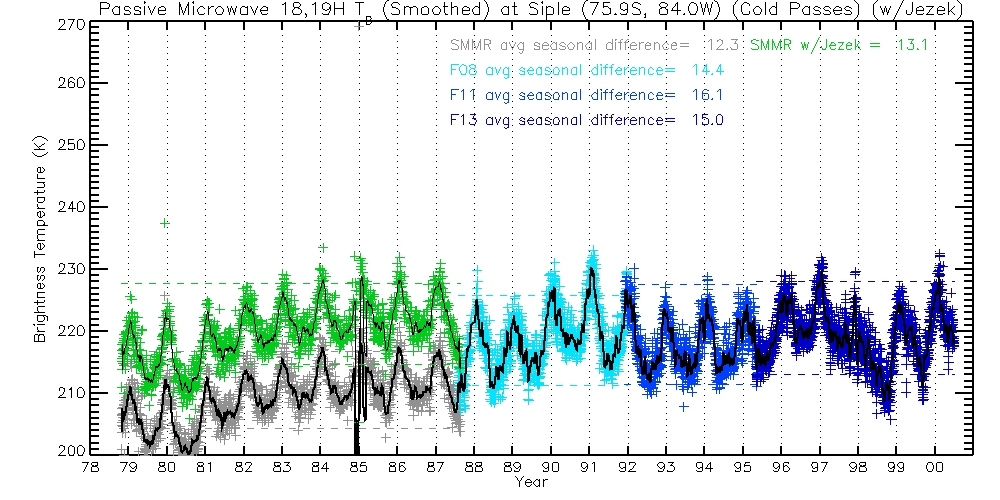
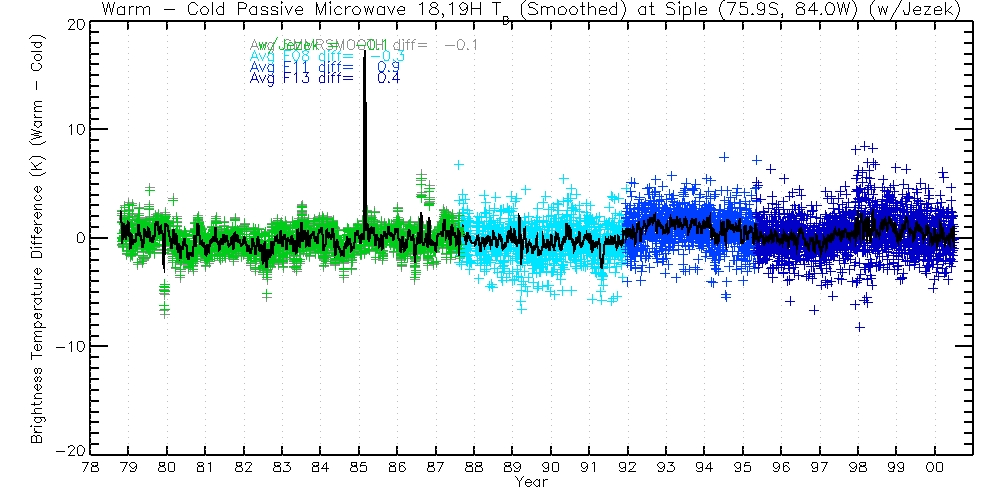
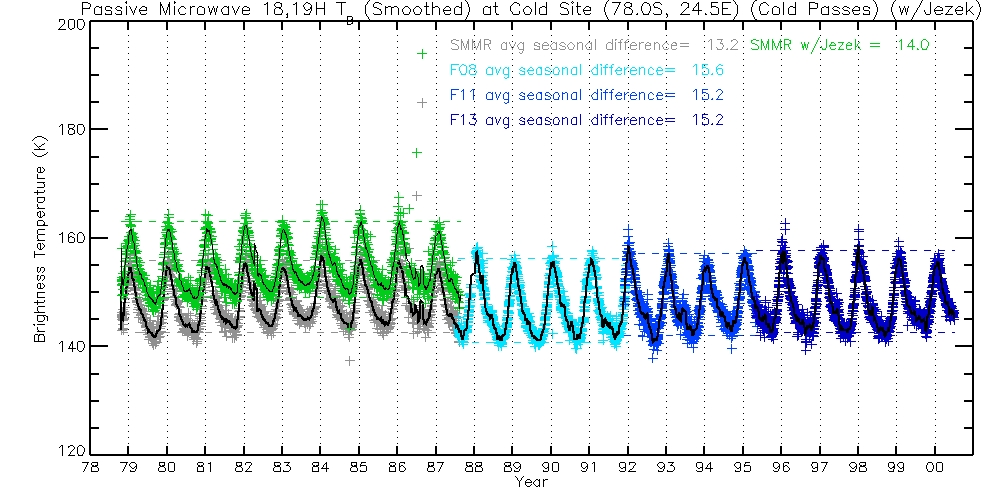
| Location | "Warm" Passes | "Cold" Passes | Difference (Warm - Cold) |
|---|---|---|---|
| Dome C 18,19H GHz | 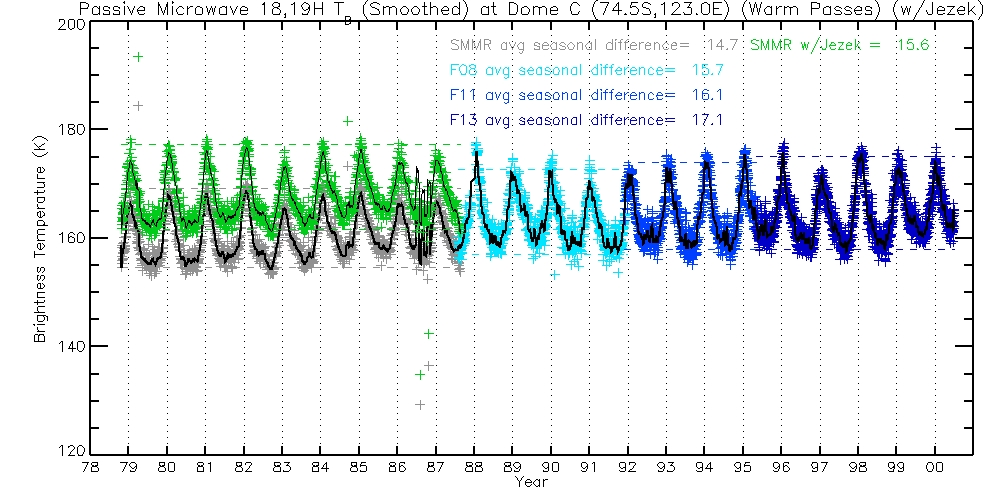 |
 |
 |
| Siple 18,19H GHz | 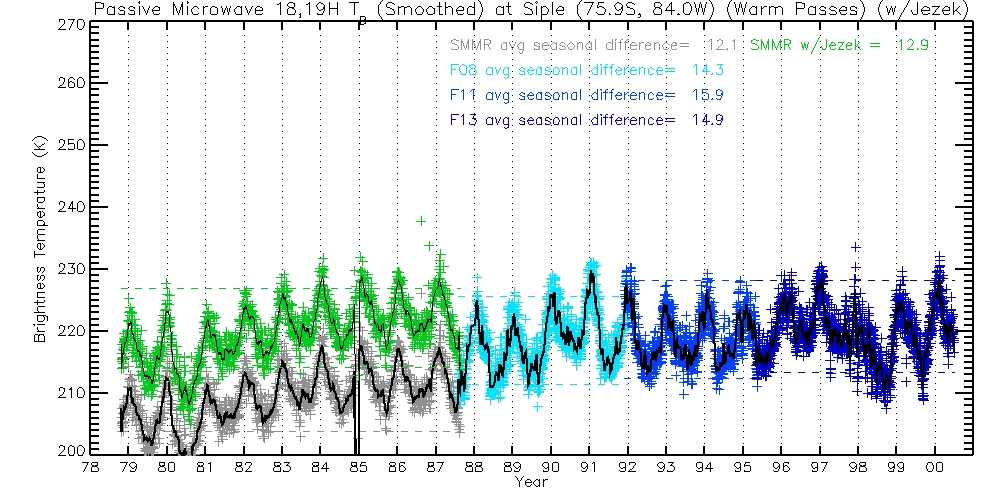 |
 |
 |
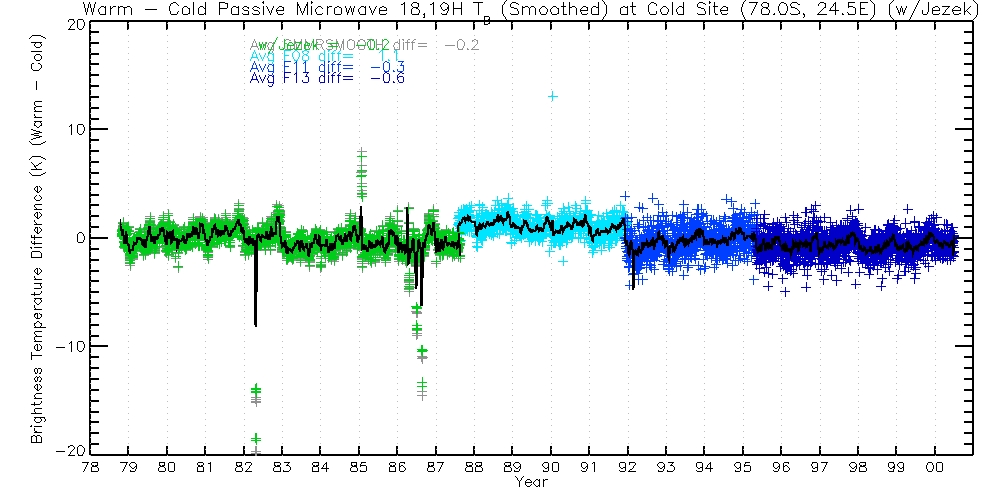
| Coldsite 18,19H GHz | 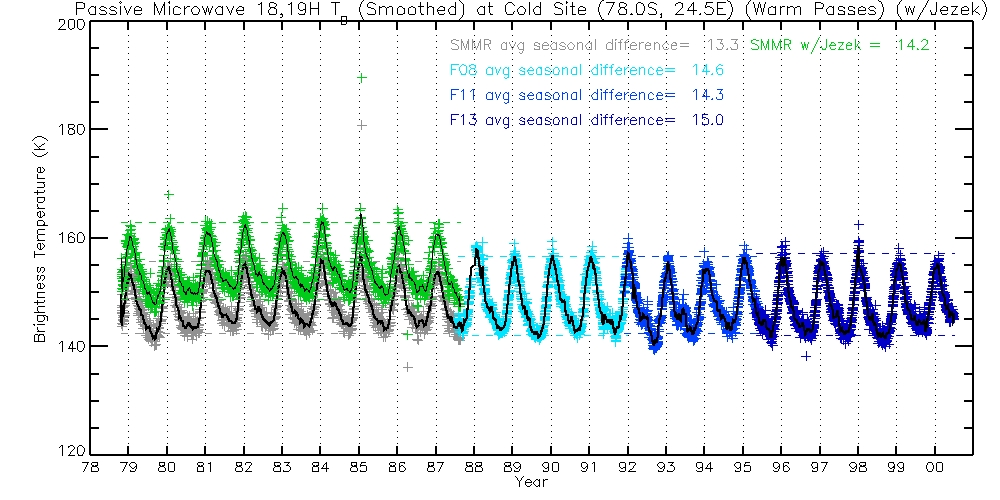 |
 |
 |
| Little Washita 18,19H GHz |  |
 |
 |
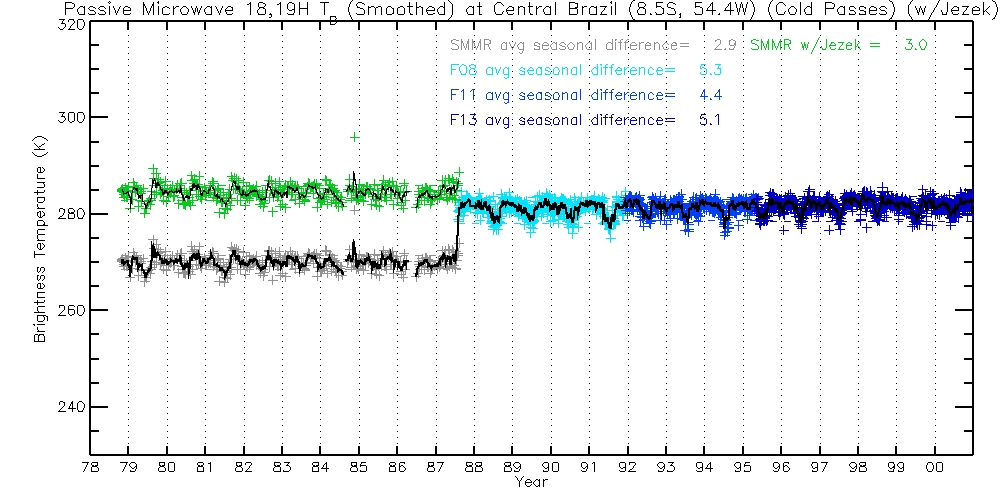
| Central Brazil 18,19H GHz |  |
 |
 |
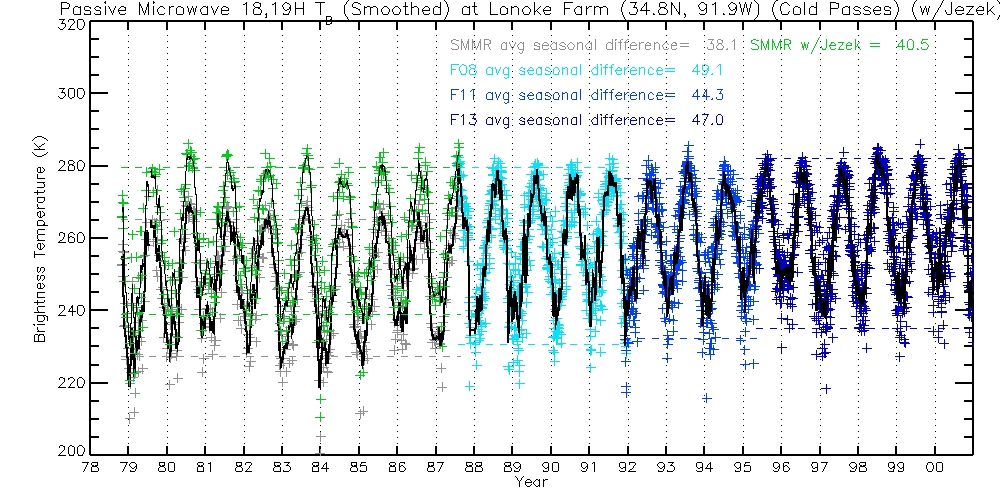
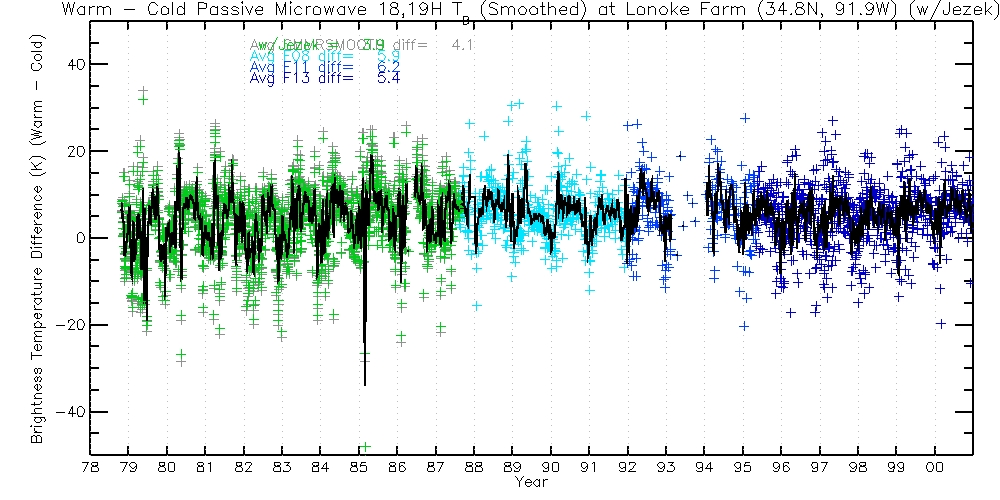
| Lonoke Farm 18,19H GHz | 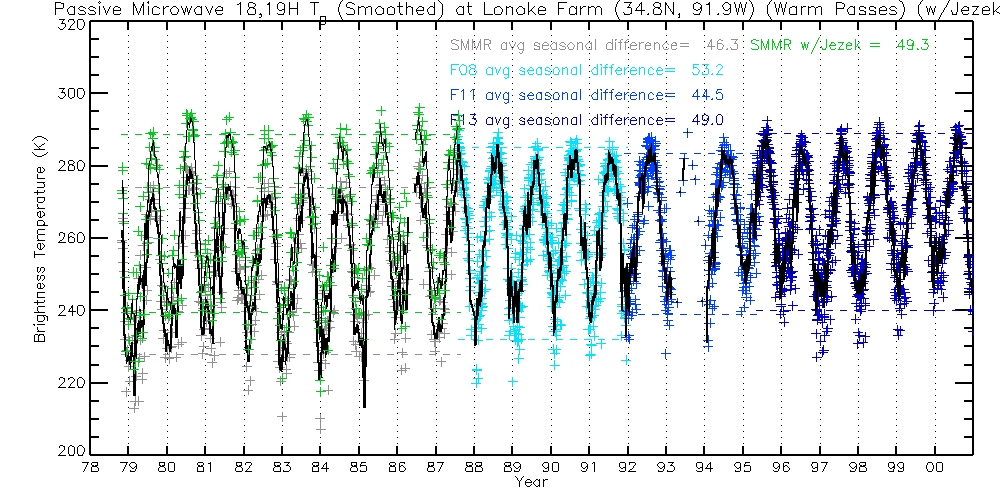 |
 |
 |