 |
AWS Data
|
 |
AWS Data
The following table contains various representations of AWS data from Siple and Dome C.
(Click on any thumbnail to see full resolution image.)
|
Siple |
Dome C |
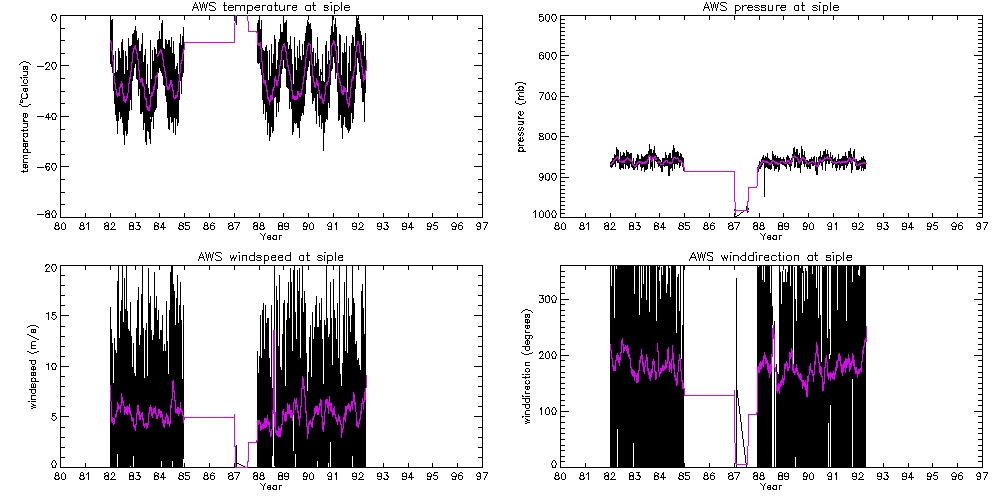
| AWS all fields 1980-1996 |
 |
 |
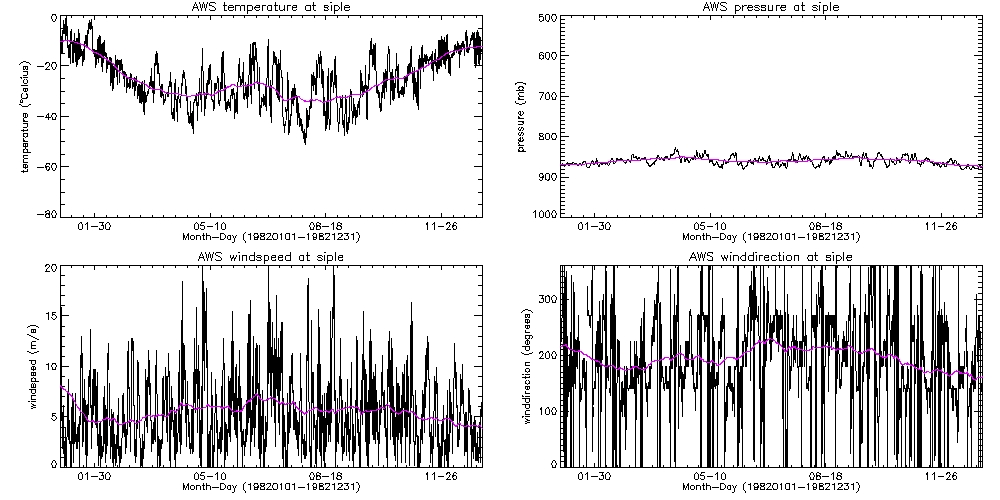
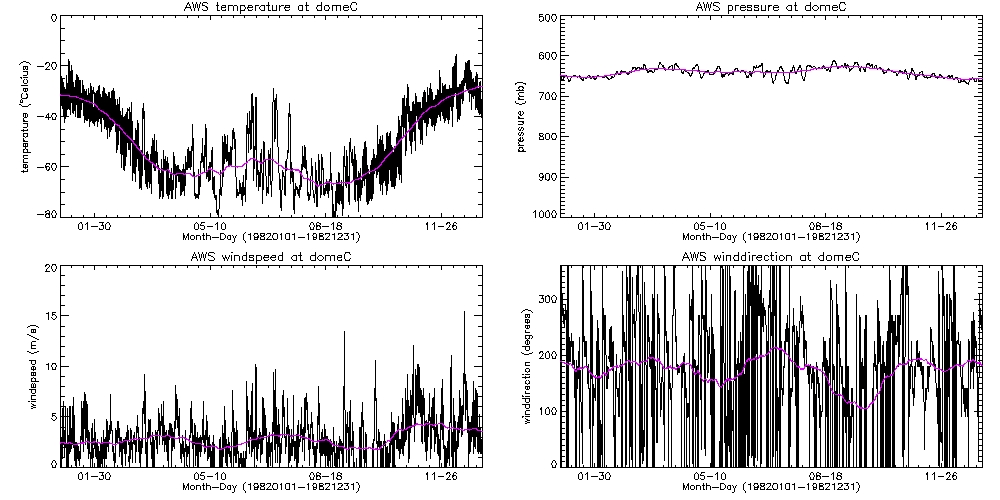
| AWS all fields 1982 |
 |
 |
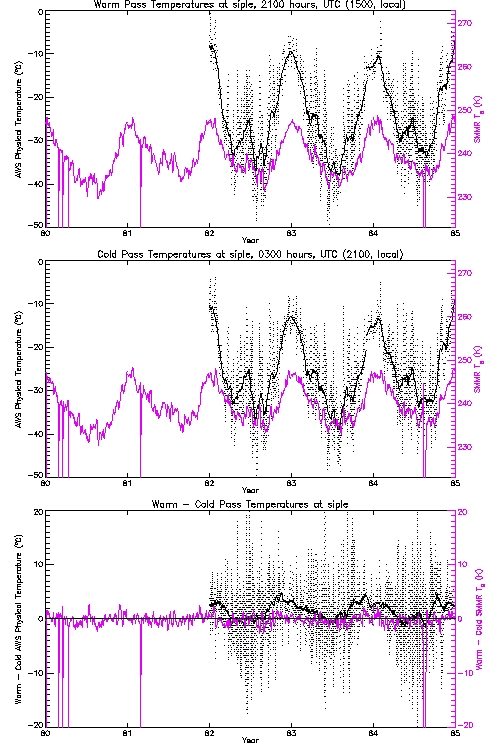
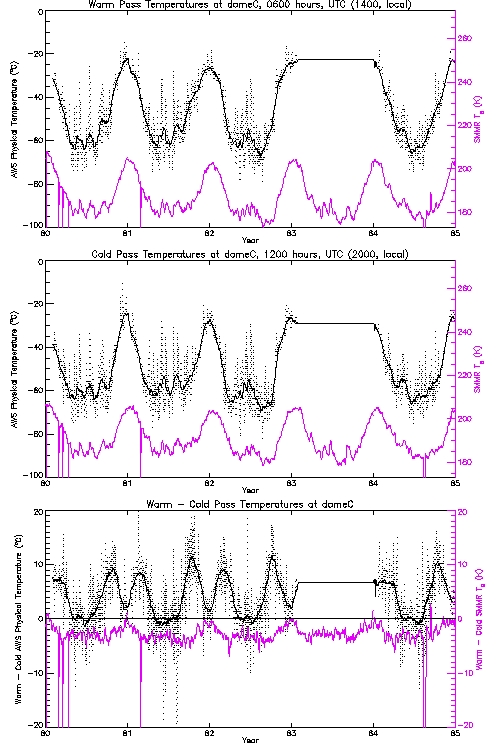
| AWS vs. SMMR temperature differences 1980-1984.
Solid black line is 30-day smoothed AWS temperatures. Note that y-axes are scaled differently at Siple and Dome C. |
 |
 |
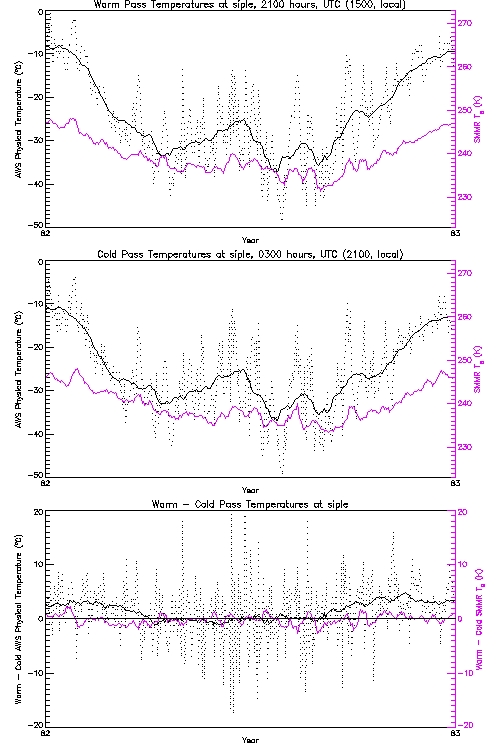
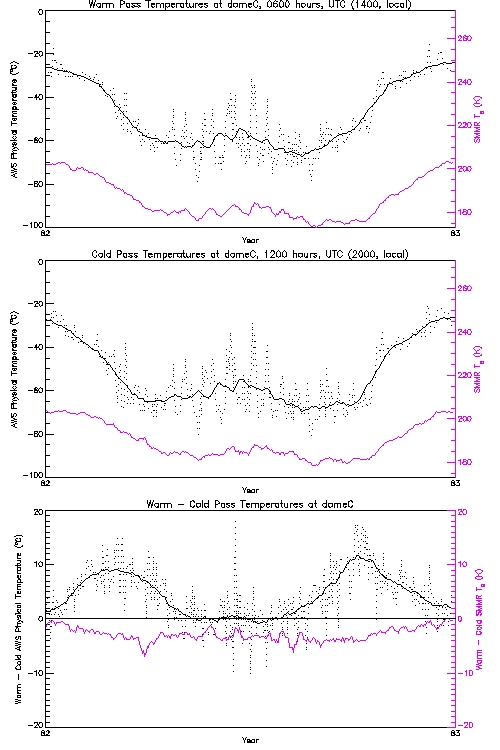
| AWS vs. SMMR temperature differences 1982
Solid black line is 30-day smoothed AWS temperatures. Note that y-axes are scaled differently at Siple and Dome C.
Notes: bimodal shape in differences at Dome C, winter, no sun, no difference; summer, always sun, small positive difference, but essentially the same temperature at 2p.m. and 8 p.m.; fall and spring, sun is rapidly going/coming, so differences reflect this.
Question remains: why is warm-cold at Dome C always negative in SMMR? |
 |
 |
M. J. Brodzik <brodzik@zamboni.colorado.edu>
Last modified: Fri Sep 28 14:18:19 2001