coSH meta-data

Superstition Hills Fault near Imler Road Naval base

32.9301N, 115.7009W

Length 6 m

Obliquity 30°

Invar rod installed 1978.

DC-SE#J1811 Transducer -8.022 dextral_mm/V Range 32 mm, Resolution 0.01 mm.

End mounts consist of 1 m steel rods driven into sandstone.

A creepmeter was operated near Imler Road by Caltech for several decades prior to the Superstition Hills earthquake of 1978 (Louie et al, ). It recorded slip at roughly 1 mm/yr, but it had been abandoned by the time of the earthquake. A few days after the earthquake the first of three creepmeters on the fault was installed (Site 1) to monitor afterslip. These were operated for about five years until funding was discontinued. Funding was renewed in 2004 and a creepmeter was re-activated at Site 1, now called coSH) . Telemetry was added in 2006 and solar power added in 2009.

Although daily temperature variations at 30 cm depth are roughly 1 deg C, and generate a thermoelastic signal with an amplitude of roughly 0.01 mm, seasonal variations of 25 deg C have negligible effect on the data

Bilham, R., Surface slip subsequent to the 24 November 1987 Superstition Hills, earthquake, California, monitored by digital creepmeters, Bull. Seism. Soc. Amer., 79(2), 425-450, 1989.

Bilham, R., and J. Behr, A two-depth model for aseismic slip on the Superstition Hills fault, California, Bull. Seism. Soc. Amer., 82, 1223-1235, 1992.

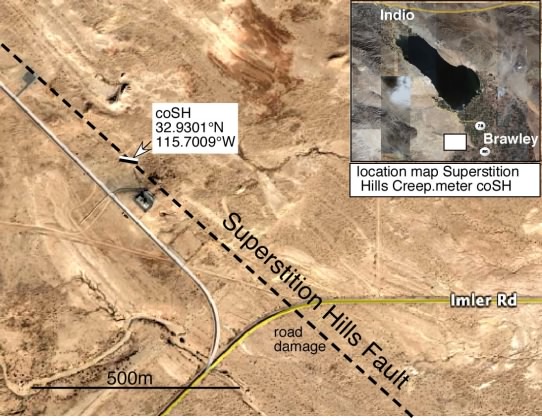
Superstition Hills, Creep-meter, coSH

map

New incoming data with a 15 minute sample interval are available here. User "geo" Password "hobo". A paper discussing the 2006 Mw=4.7 slow earthquake was published by Wei et al.(2009). Details of this event can be viewed here.

The background creep rate between large slip events has halved in 5 years from 1.3 mm/yr to 0.6 mm/yr as indicated in the plot. In this time the slip events total 52 mm.

Numerical Data coSH

A csv fie for all data 2004-Feb 2011 can be downloaded here.

Processed dextral slip data with GMT date and time of acquisition between March 1994 and Oct 2009 are listed in a zipped .csv file available here. The data are calibrated and mechanical offsets removed. No other editing has been undertaken. The data are listed sequentially as 5 minute, 10 minute and most recently, 15 minute intervals to reduce telemetry costs.