
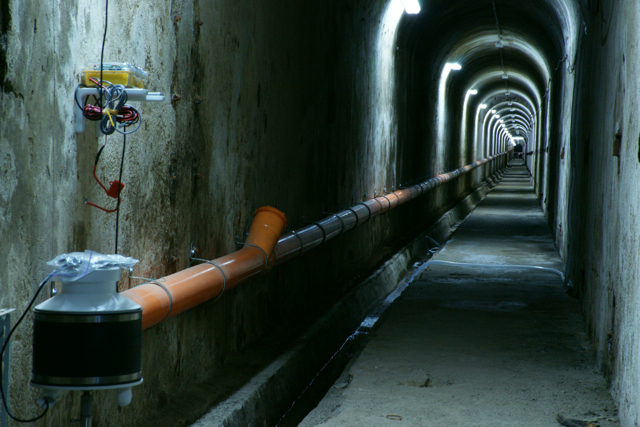
View of north sensor and 241 m long pipe of the NS tiltmeter in the northern Pozzuoli tunnel. A distant horizontal light marks the half-way point of the pipe. The NE and NW arms are located behind the camera. Click to enlarge.
Tilt-meter Operation

A water-pipe tilt-meter consists of two sensors, one at each end of a sealed rigid pipe half-full of water. Under isothermal conditions the water surface is an equipotential reference, and tilt of the ground causes one end to fall and the other to rise an equal amount. Tilt is derived from the difference in height change detected by the two sensors, divided by the length between them. Temperature variations underground, and pressure variations in the pipe, are negligible, hence the water surface, in principle, provides a drift-free horizontal datum: tilt stability each year is typically 0.1 microradians and tilt precision at weekly periods is about 1 nanoradian. Tilt resolution at one minute intervals is 0.1 nanoradian
The sensors can detect water level changes of 0.1 micron (roughly 1/500 of the thickness of a human hair). Because the Pozzuoli tunnels are vented, temperature variations exceeding 1 deg C occur, which adds noise to the measured tilt signal. By adding a third sensor to the center of the water pipe it is possible to obtain three measures of tilt, permitting signal integrity to be verified. To further discriminate real tilt from local noise temperature is measured at each sensor to millidegree precision.
Clusters of tilt-meters have been installed in two tunnels. In the northern tunnel tiltmeters operate in three azimuths. In the southern tunnel three pipes measure two azimuths. Each sensor detects a combination of body tide, load tide and volcano inflation. Data are sampled 16 times per second and averaged for 90 s. The data are recorded each minute with 16 bit A/D converters on a local data logger. An independent 12-bit data logger averages the data for 30 minutes and these data are transmitted using the Iridium satellite every 120 minutes (programmable remotely). An email alert is sent to local scientists when the tilt signal exceeds a prescribed level, or in the event of a local power failure.
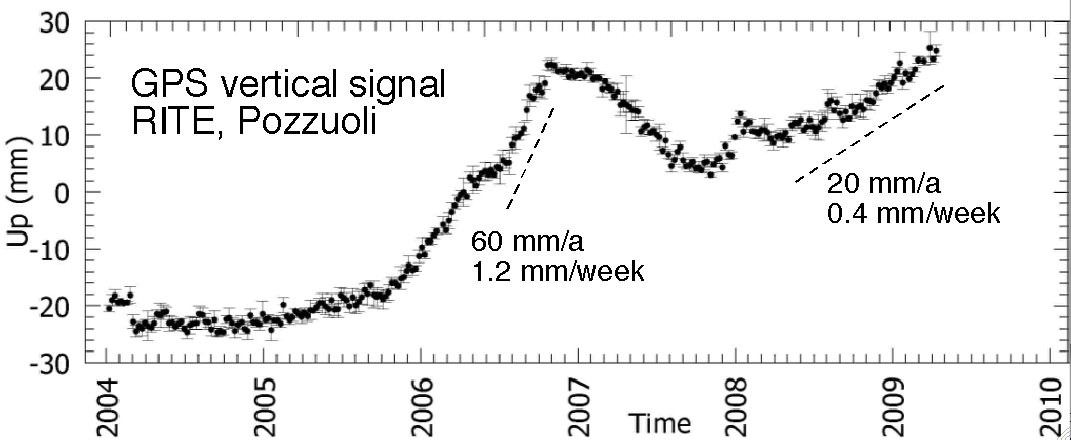
Data
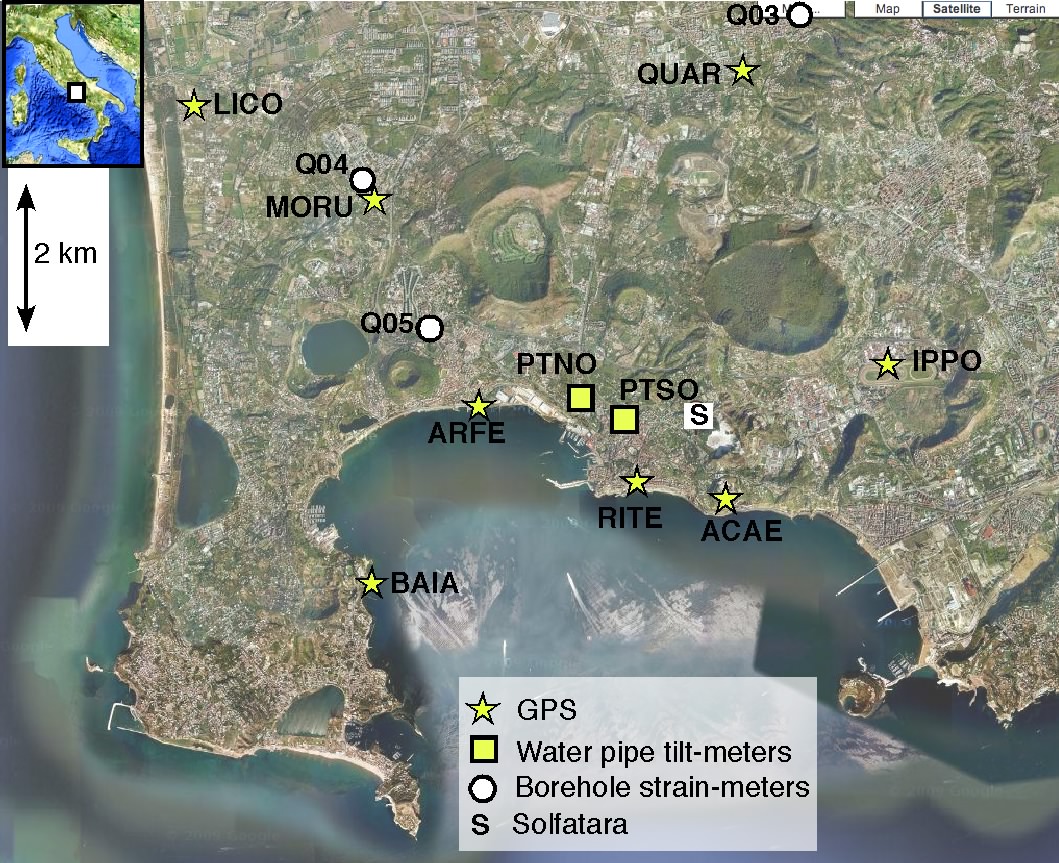
Location of tiltmeters
click on map for enlarged views
Water level sensors
Each of the 12 sensors in the tiltmeter array consists of four 5-cm-diameter, chromium-plated, copper balls supporting a central ferromagnetic core whose vertical position is monitored to a precision of 0.1 micron by an LVDT fastened to a stable pillar 20 m underground.
Microwatt heaters prevent moisture condensing on the floats and lid, and a 6 micron thick flexure strip guides the core within the body of the LVDT. The tiltmeter sensors are calibrated to 1% accuracy. Intercalibration accuracy can be verified by adding or removing 1 litre of water to the pipe.
Pozzuoli Tiltmeters North, PTNO
Two 12 cm diameter pipes are strapped to the stone wall of the tunnel at 1.5 m intervals. The photo above shows the north water-level sensor at the end of the 241-m-long north/south pipe.
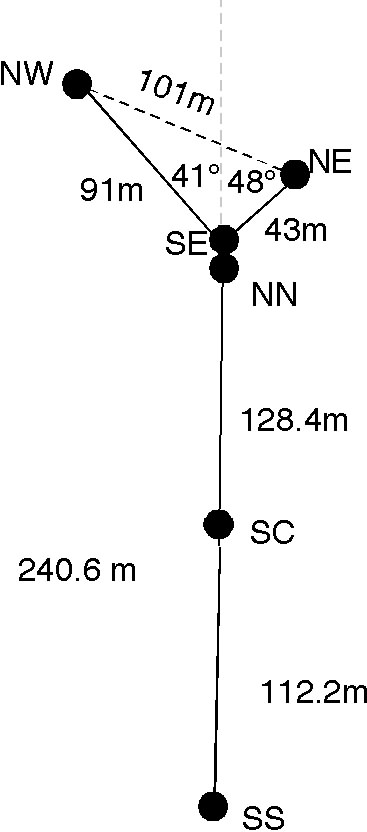
The figure below illustrates in map view the geometry of the three pipes and the sensor naming scheme in the northern Pozzuoli tunnel. A single pipe links the NW, SE & NE sensors, a geometry limited by the lengths of the side tunnels. The length of the north/south pipe is limited to 240.6 m by the slope of the tunnel and by the floor-to-ceiling height.
Pozzuoli Tiltmeters South PTSO
The figure below illustrates the geometry of the three pipes and the sensor naming scheme in the southern Pozzuoli tunnel. Separate pipes link the NW & CH sensors, the CL & SE sensors, and the NE and SW sensors.The steep slope of the tunnel down to the NW limits the longest horizontal pipe to 70 m. The CH (centre low) sensor is 1.5m below the CH (centre high) sensor.