Creepmeters in the Coachella Valley 2004 (Plots and data files)
For recent NUMERICAL AND GRAPHIC DATA DATA click ON THE MAP on the Creepmeter of interest
The information below is retained only for archival purposes only
CLICK ON THE MAP FOR RECENT DATA.
The information below is retained only for archival purposes only
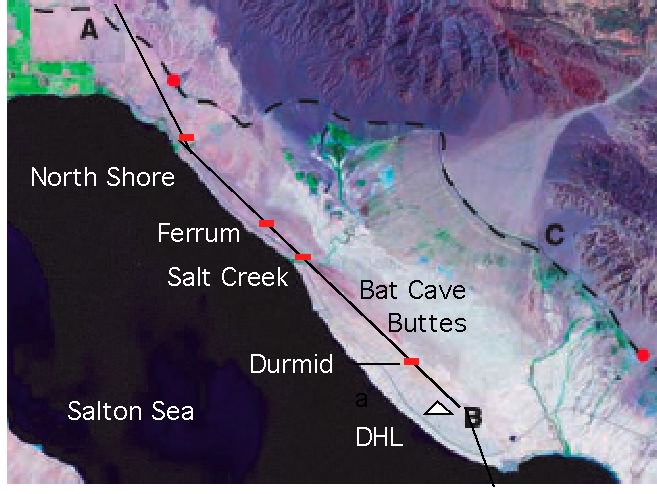
Creep-meters on Durmid Hill are shown as red east-west bars on the Southern San Andreas fault. The instruments are completely buried. The distance between Ferrum and Salt Creek is 1.37 km, and between Salt Creek and Durmid is 5.58 km, a total span of 6.95 km. The Coachella Canal (dashed line) is unlined between the two red dots (Lyons and Sandwell, 2002). The sampling rate is 1 sample per minute to one sample every 10 minutes. Data are normally collected at 6 month intervals although telemetry is now being considered at sites protected from vandalism. On 25 March'04 Ferrum and Durmid were equipped with graphite rods with a thermal coefficient of linear expansion of 0.3 ppm/°C. Ferrum is influenced by daily expansion and contraction of the rail track beneath which the length standard passes. This, however, does not effect the seasonal signal here.
North Shore creepmeter (Installed by Caltech, inoperative since 1990 and unrecoverable)
[coFE] Ferrum to October 2009 33.45725°N , 115.85386°W, Length 10 m, Obliquity 30°, Invar/steel composite January 2004-October 2009 Latest data
See latest data for most recent edited time series, or DataGarrison.com for incoming data. Battery pack disconnected accidently for two months in early 2005 with no loss of absolute datum. DC-SE#2225 Transducer Range 32 mm, Resolution 10 µm. The creep-meter lies at the base of a railroad cut 5 m deep into the fault, and the creep rate here is ≈2 mm/yr . The creep rate appears to have slowed in early 2007 but the same process occurred in early 2005 and it is probably a seasonal signal. Note the very different behaviour in the winter months of 2005/6, however, when two creep events occurred. Telemetry started September 2006, and recent data in graphical or numeric form can be accessed on line at https://datagarrison.com/users/1101128/90029EDG1/plots.php You will need the following password access: User=geo password=hobo. The Satellite telemetry unit gave us trouble in early 2009 and was replaced with an AT&T unit in July 2009. At the same time solar power was linked to the data logger battery to reduce maintenance intervals. The cell-repeater is at the northern end of Durmid hill and required the transmitter to be mounted 2 m above the surface to attain line of sight connection.
Download csv text listing of March'04-July'07. or same data as a space-delimited file . Each has three columns: the first 18 characters are the date in an Excel or Igor format, (mm/dd/yy hh:mm:ss), the next column is the calibrated dextral displacement in mm, the final column is the temperature in degrees Celsius. Only the first two decimal places in the data columns are meaningful.

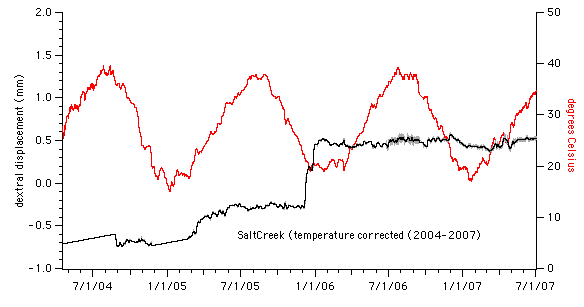
[coSC] Salt Creek to July 2007 33.44855 N 115.8437 W DCSE J2781 transducer Length 10 m, Obliquity 80°, Invar wire. Effective Transducer Range 21 mm. Oscillations in the system occur during the passage of nearby freight trains. Early data lost due to excursions of the lever arm of the original Caltech system. This beam balance lever arm was bypassed early '06. The data in the figure have been corrected for a linear thermal coefficient Download text listing of 10 minute data Mar04-June06. data to April07
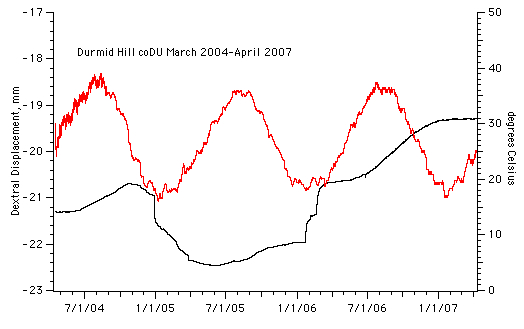
[coDH] Durmid Hill To April 2007 33.4147 N 115.7985 W DC-SE J2959 transducer Length 8 m, Obliquity 30°, Invar rod 6-25 March 2004, replaced with graphite rod 25 March. Transducer Range 32 mm, Resolution 10 µm. Calibration -7.0163 dextral mm/volt. The large lef-lateral creep on event on 29 Dec 2005 is quite unique and occurs less than 1 day after the Sumatra Mw9.15 earthquake. Download ascii file
[coSH] Superstition Hills To June 2007 33.72824°N, 116.23171°W Length 6 m, Obliquity 30°, Invar rod. DC-SE 2229.
The first plot shows data to June 06. The second plot shows the data to April 2007 that includes a 28 mm creep event discussed elsewhere.
Transducer Range 32 mm, Resolution 10 µm. Download text file of ten minute samples Apr04-June06.


Summary plots for the three Durmid Creepmeters showing creep events in late 2005 and early 2006 propagating southward. The figure below shows three creep signals from Durmid Hill for 2 years, and illustrates how the creep rate at Ferrum (2.6 mm/year) slows near and south of Salt Creek. 
The events shown below (raw data with calibration applied) start within a few minutes at Ferrum (coFe) and Salt Creek (coSC) but take 42 and 55 days to propagate the 5 km to coDU. Download PDF narrative that explains how the data are processed and gives numeric details of these small creep events (total offset ≈1 mm).

The following figure compares the above creep data with several other creep signals gathered in central and southern California. Note the occurrence of creep events simultaneously at Ferrum and Salt Creek, followed by a small creep event on the Supersition Hills fault and at Durmid Hill. Rainfall results in a left-lateral signal at Parkfield and Nyland in both years, and at Ferrum, Nyland Ranch & Durmid Hill in 2004. In contrast, in 2005 the lower monthly rainfall in southern California triggers dextral creep events. Note the 1/10 scale on the right hand axis for these southern California creep-meters. Noise in the data is less than 20 µm before and during the creep events suggesting that though catalyzed by precipitation, they result from a reduction in friction on the fault by hydraulic processes in the shallow fault zone.
