SURFACE WAVES
This webpage includes surface wave tomography using data from La Ristra, TA and SIEDCAR arrays.

One main result from La Ristra project is the Surface Wave tomogrpahy for this transect to map the RGR shear velocity structure up to a depth of 350km. 29 earthquakes were used to generate dispersion curves for each station of the La Ristra, and they are inverted into 2-D shear velocity model as a funtion of depth and the distance along the transect. Lithosphere thickness of the Great Plains is around 200km, compared with 55km of the RGR. Low anomaly along this transect shows a inverted-U structure, constructin a low anomaly channel underneath the Colorado Plateau and RGR. Different from the Shear velocity model form body wave tomography, no evidence of the low anomaly sourse is found in this model. As a resutl, West te al. suggested such features show an upwelling produced by small scale convection due to shallow temprature variations and lithosphere thickness variations. (West et al, 2004)
The latest approach using TA data are surface wave tomography using ambient noise technology and tele-seismic data. Weisen et al. constructed a 3-D shear velocity model using this algorithm. This model has a resolution about 60km, and covers the whole Rio Grande Region.
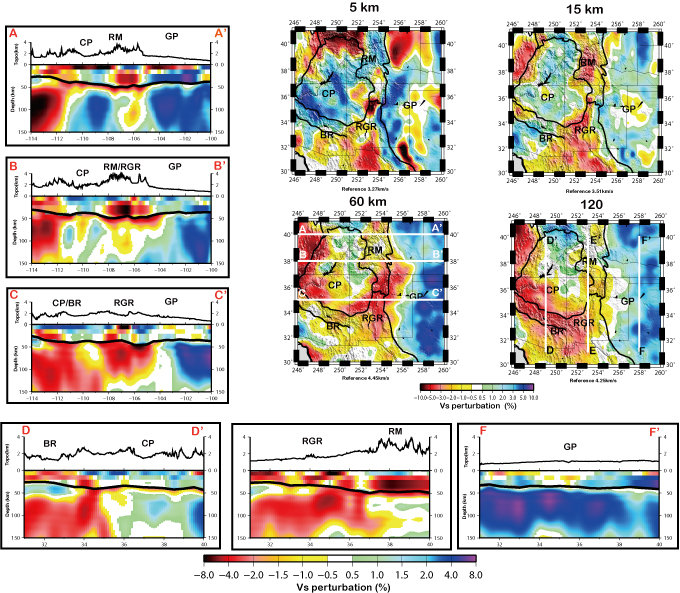
Three vertical cross sections of shear wave speed along latitudinal profiles delineated by white lines at a depth of 60 km. The Vs perturbations are plotted on the left side.
Three vertical sections of shear wave speed along longitudinal profiles delineated by white lines at a depth of 120 km. The Vs perturbations are plotted underneath.
In the middle and lower crust, a low velocity zone is observed beneath the Rocky Mountains. The low velocities extend into the mantle to a depth of about 100 km.
Beneath the Rio Grande Rift, upper crustal velocities are affect by sediments within the Rio Grande Basin. Middle and lower crustal shear wave speeds are neutral compared with the very low velocities in the upper mantle which extend to a depth of ~130-150km. For the Colorado Plateau, high velocities are observed throughout the crust into the upper mantle, which reflects the relative stability of structures within the Plateau. However, at the edge of the Colorado Plateau and the eastern frontier of the Basin and Range, very low velocities penetrate from the crust to a depth larger than ~150km and show a high contrast with the Colorado Plateau. And also
we observed that a big portion of the Colorado Plateau shows a very gradient Moho which leads to a high anomaly in the crust and low anomaly in the upper mantle. The Great Basin demonstrates a very high velocity anomaly compared with the Rio Grande Rift. (Weisen et al. 2009)