Figure 1 (Stein and Wysession, 2003)
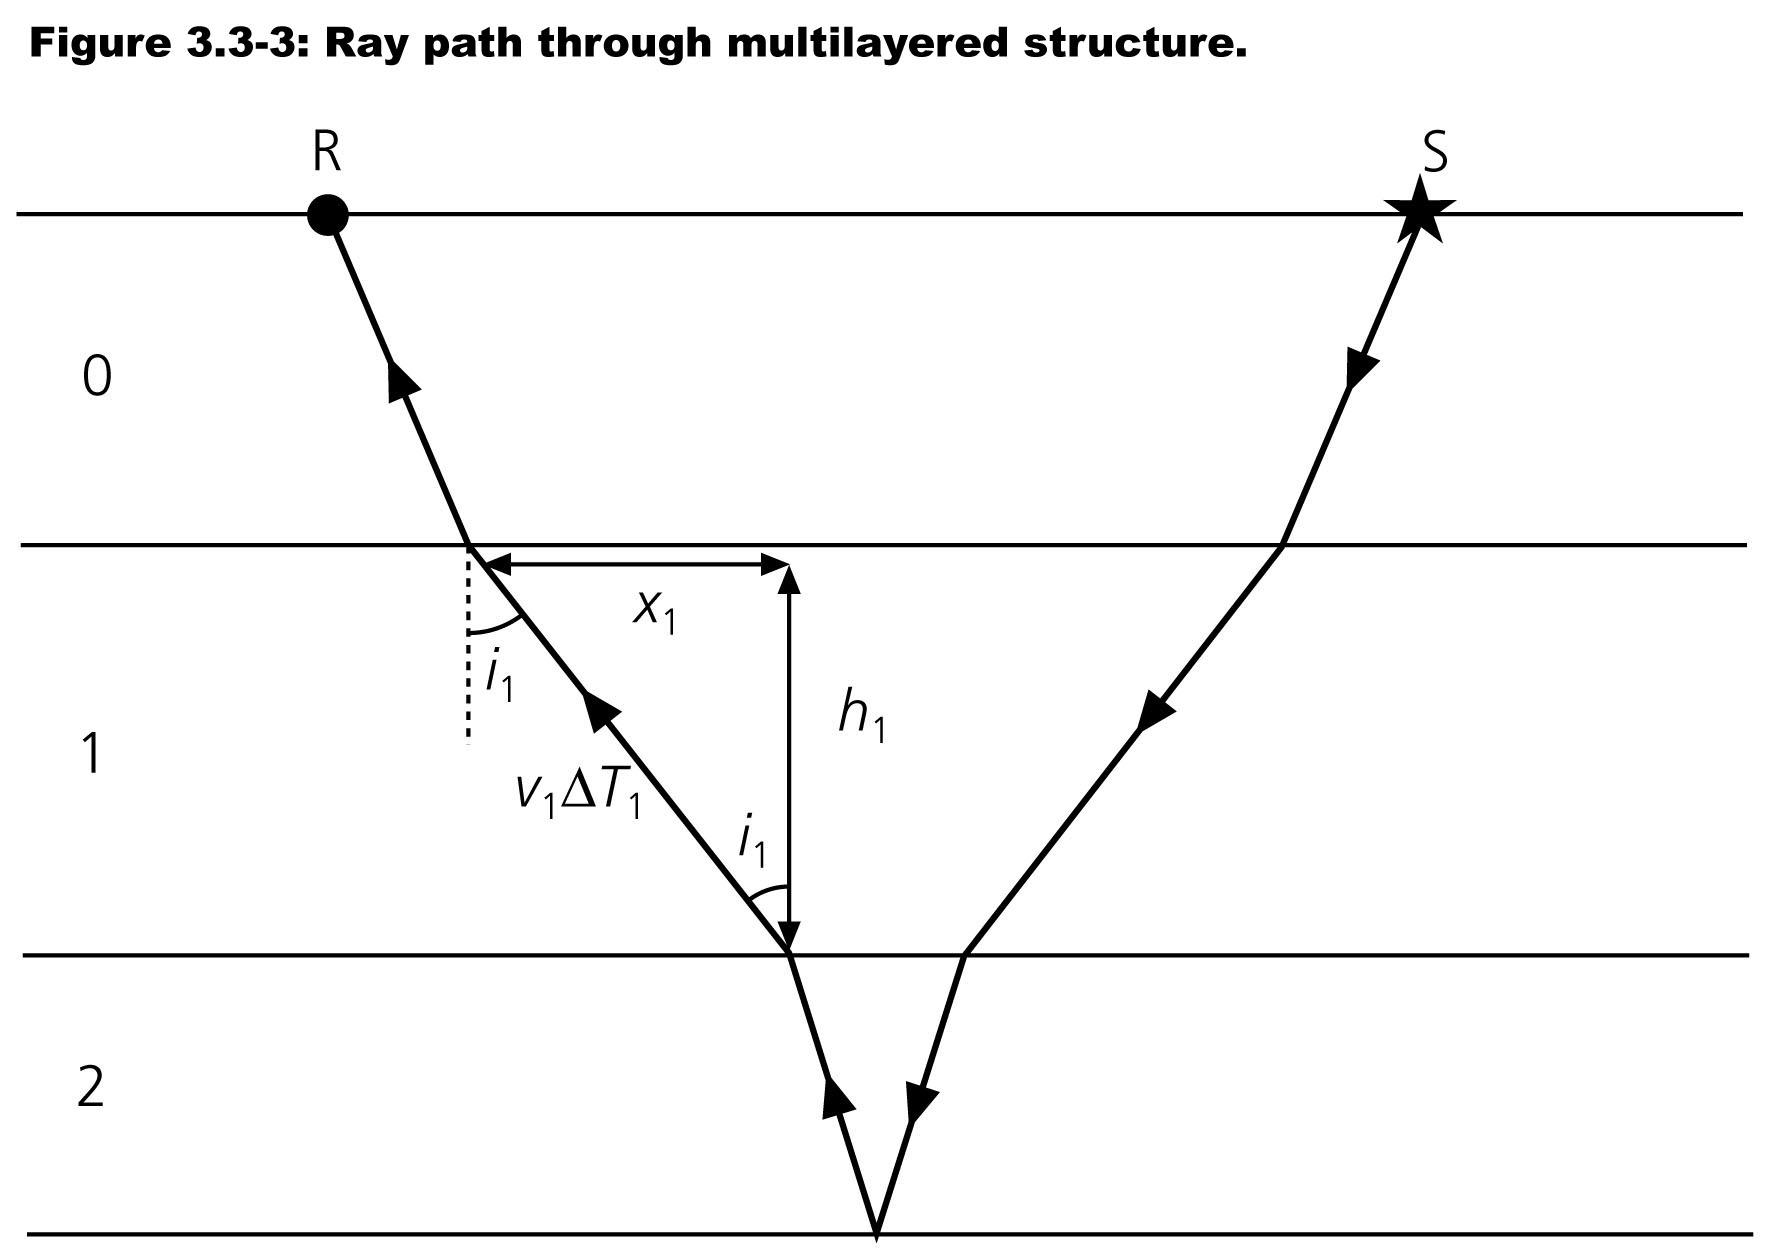
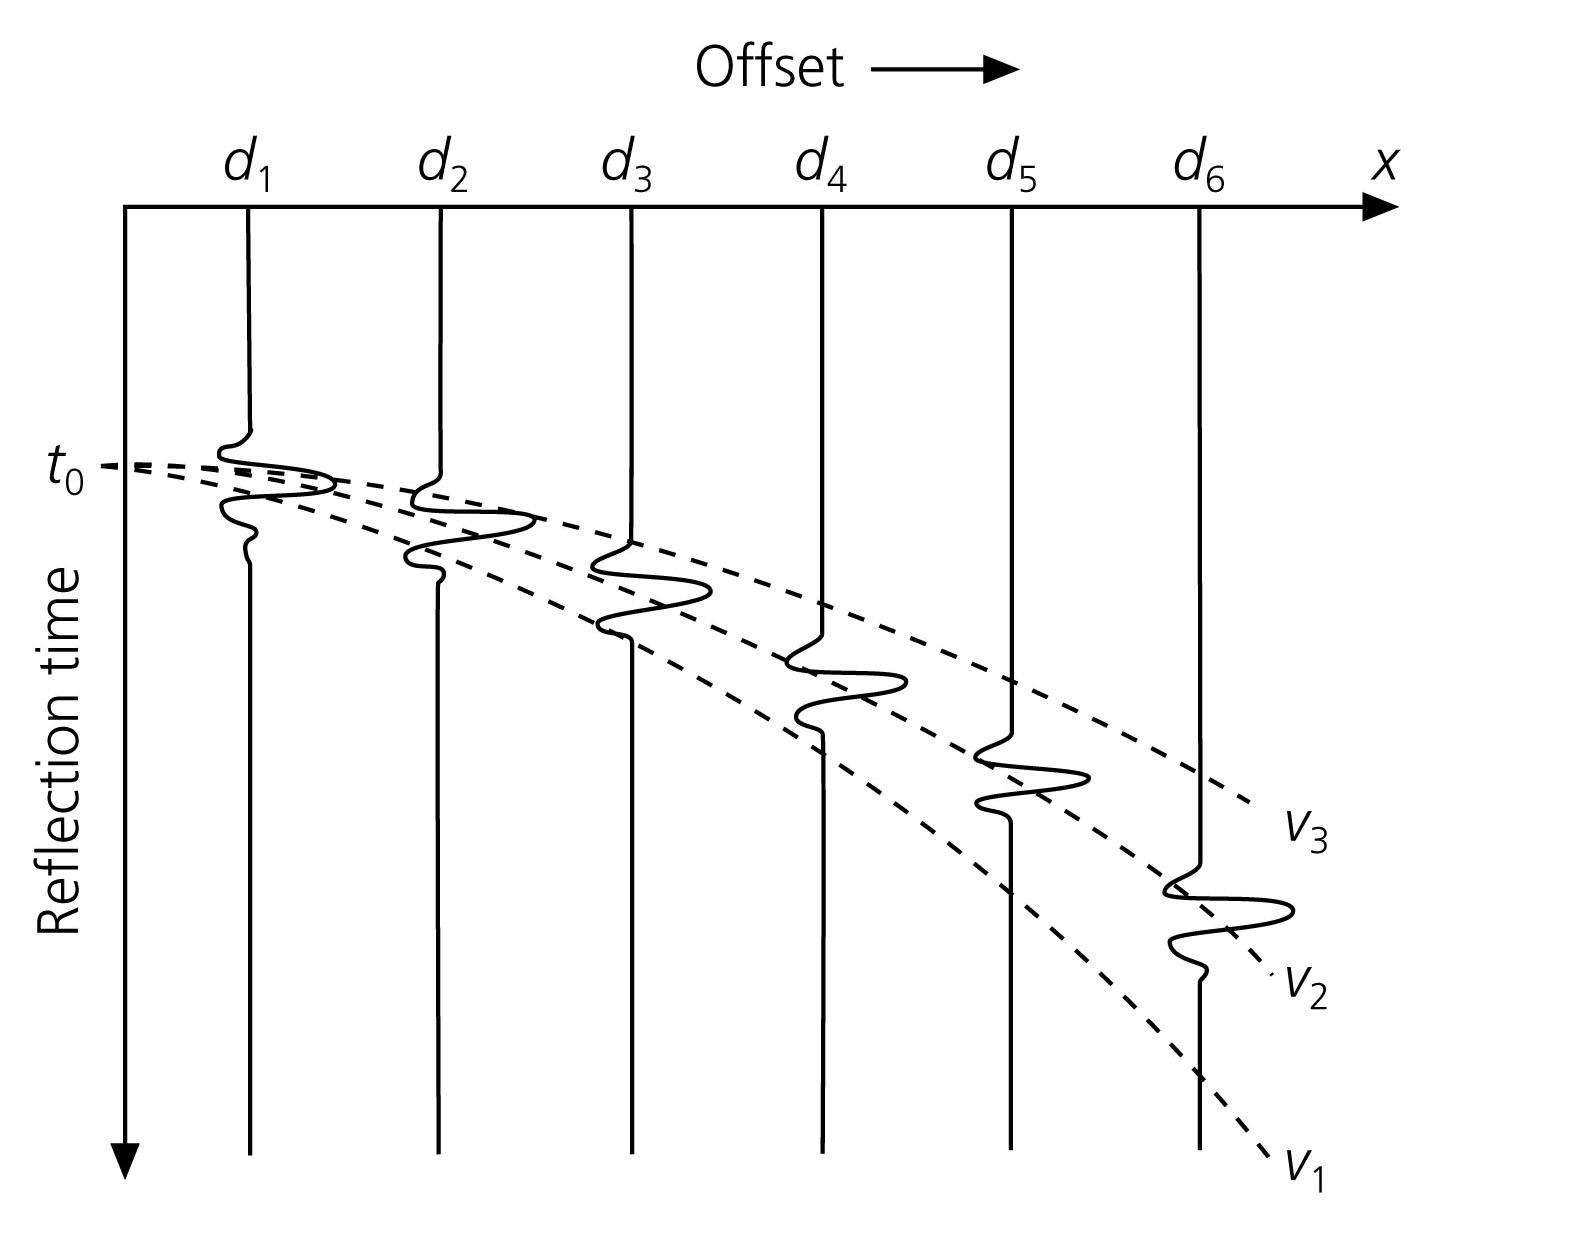
Figure 2 (Stein and Wysession, 2003) ____________________________________________Figure
3 (Stein and Wysession, 2003)
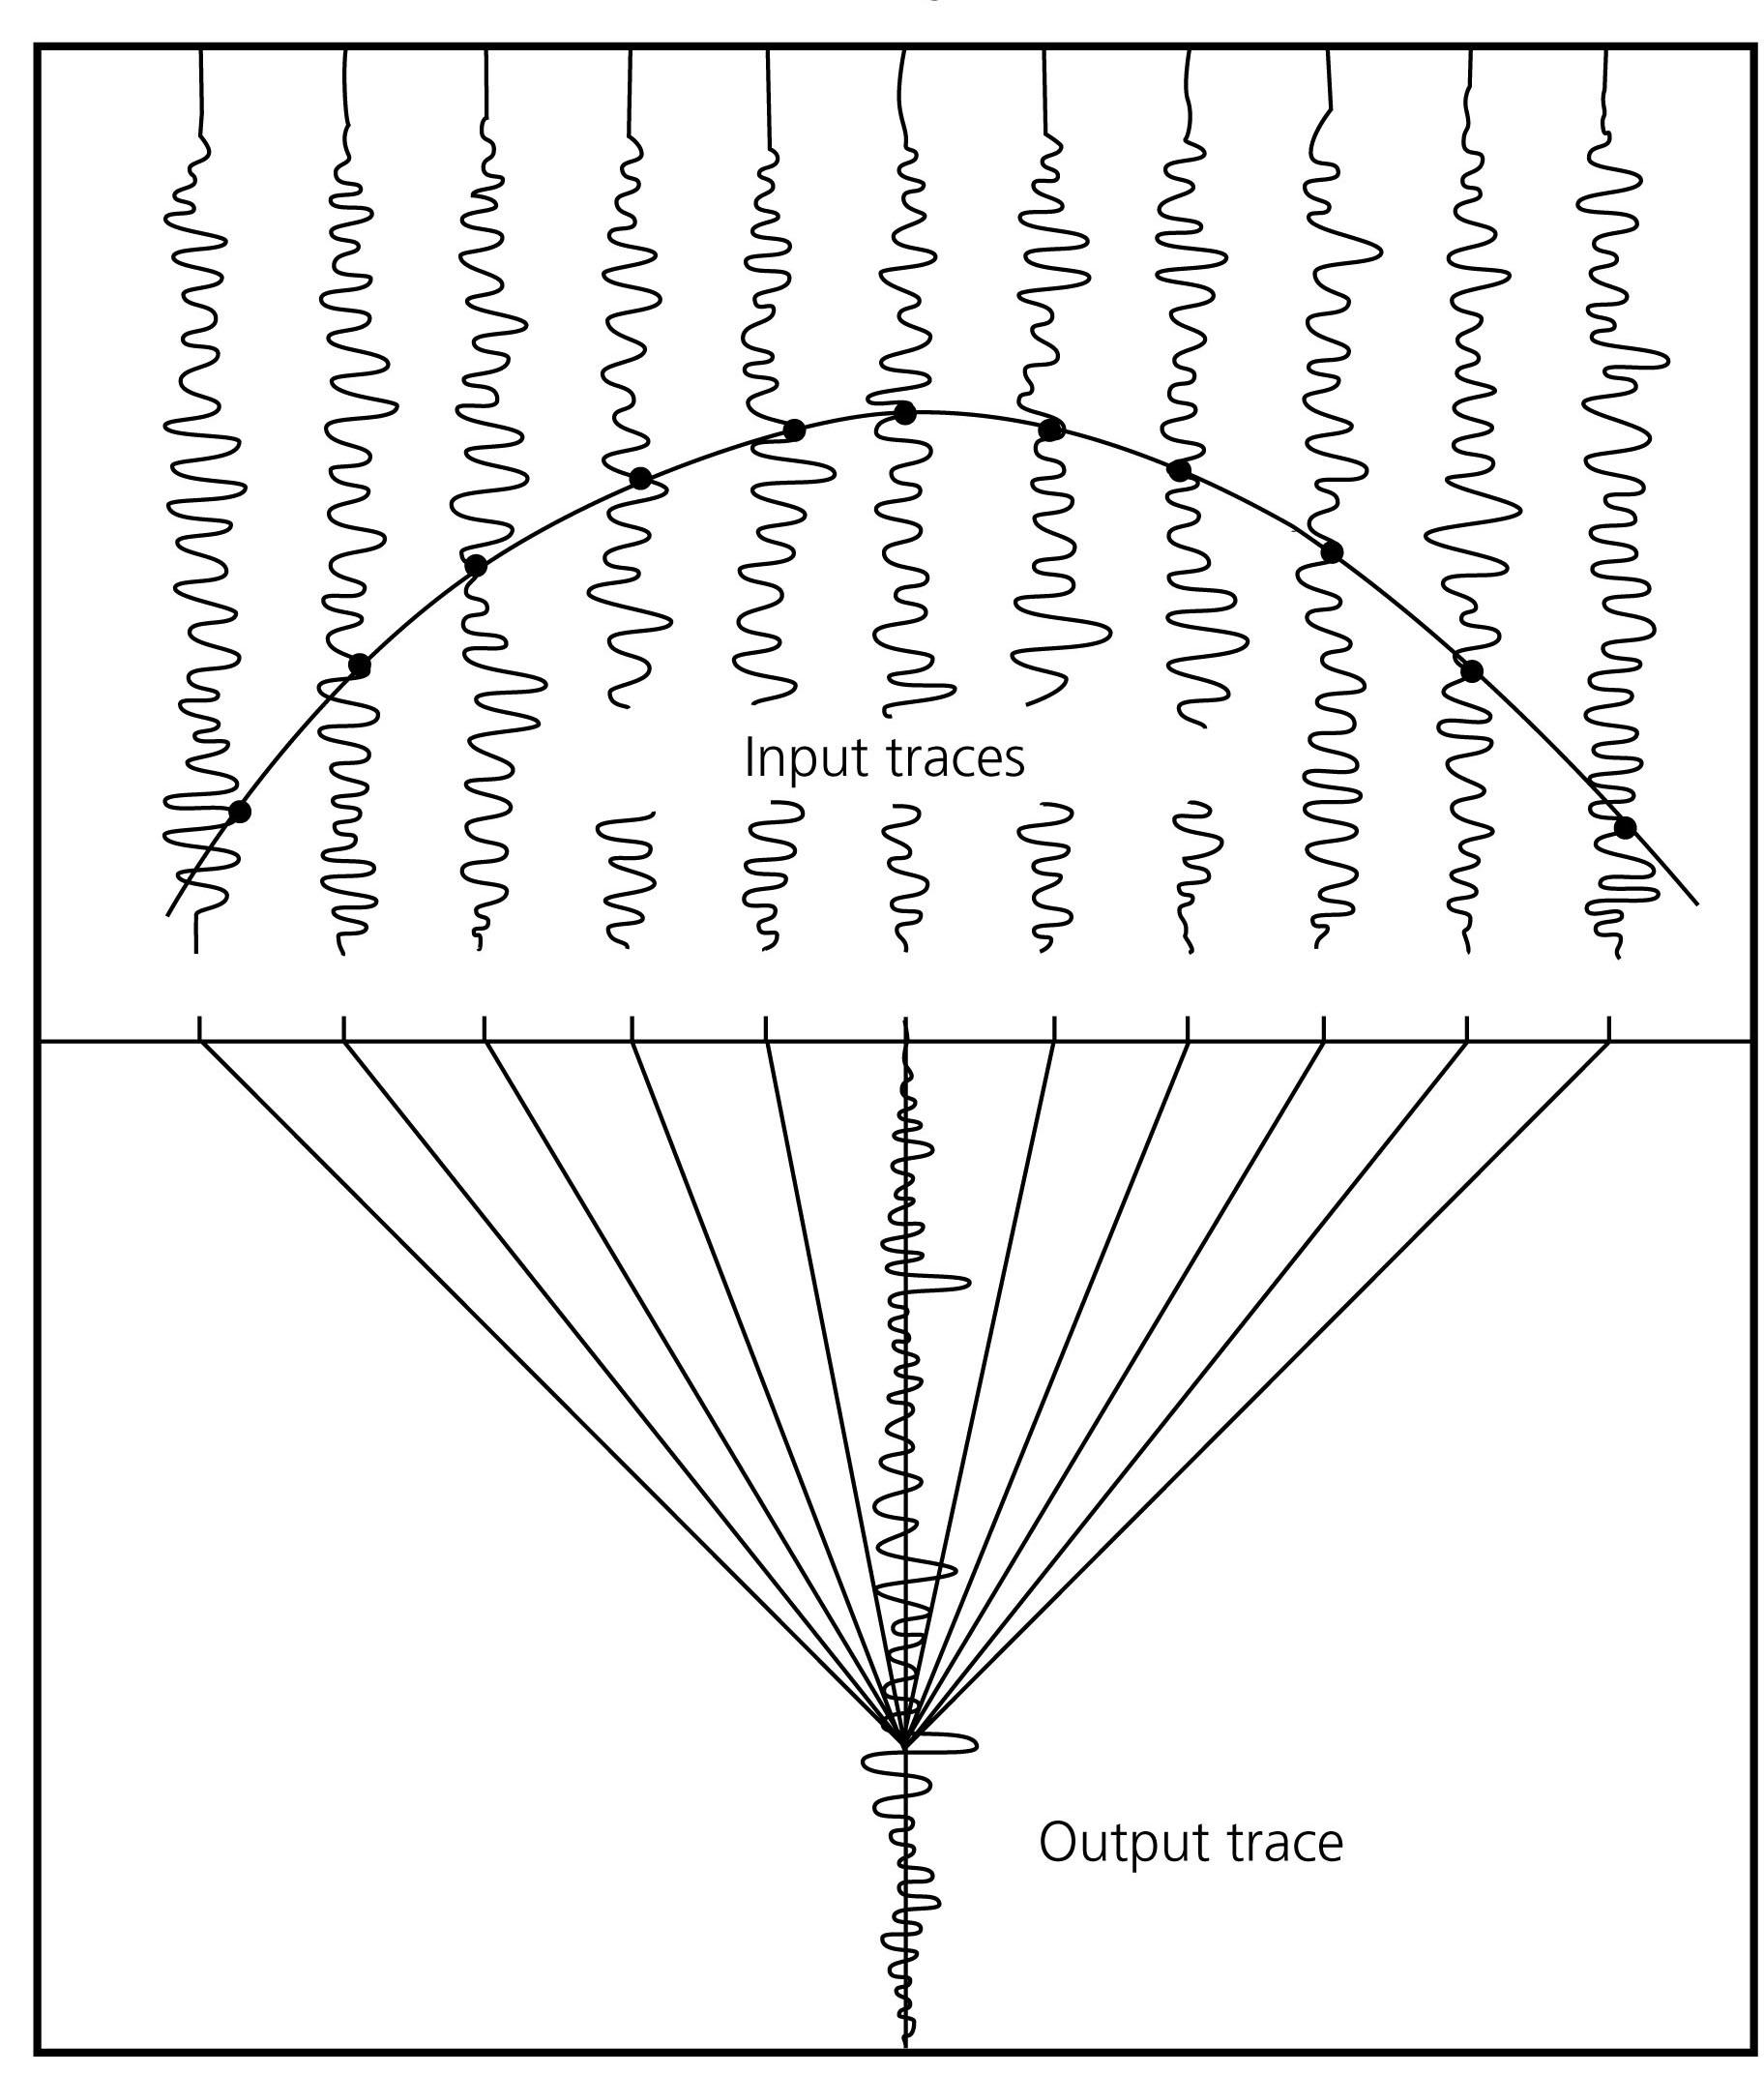 Figure 4 (Sten and Wysession 2003)
 Figure 5 (Stein and Wysession, 2003)
Seismic Profiles:
Imaging the Overlap
Introduction
Seismic reflection profiles have been the key tool in oil and gas exploration.
With seismic reflection profiles, geologists can identify areas which
most likely contain a reservoir large enough to make drilling feasible
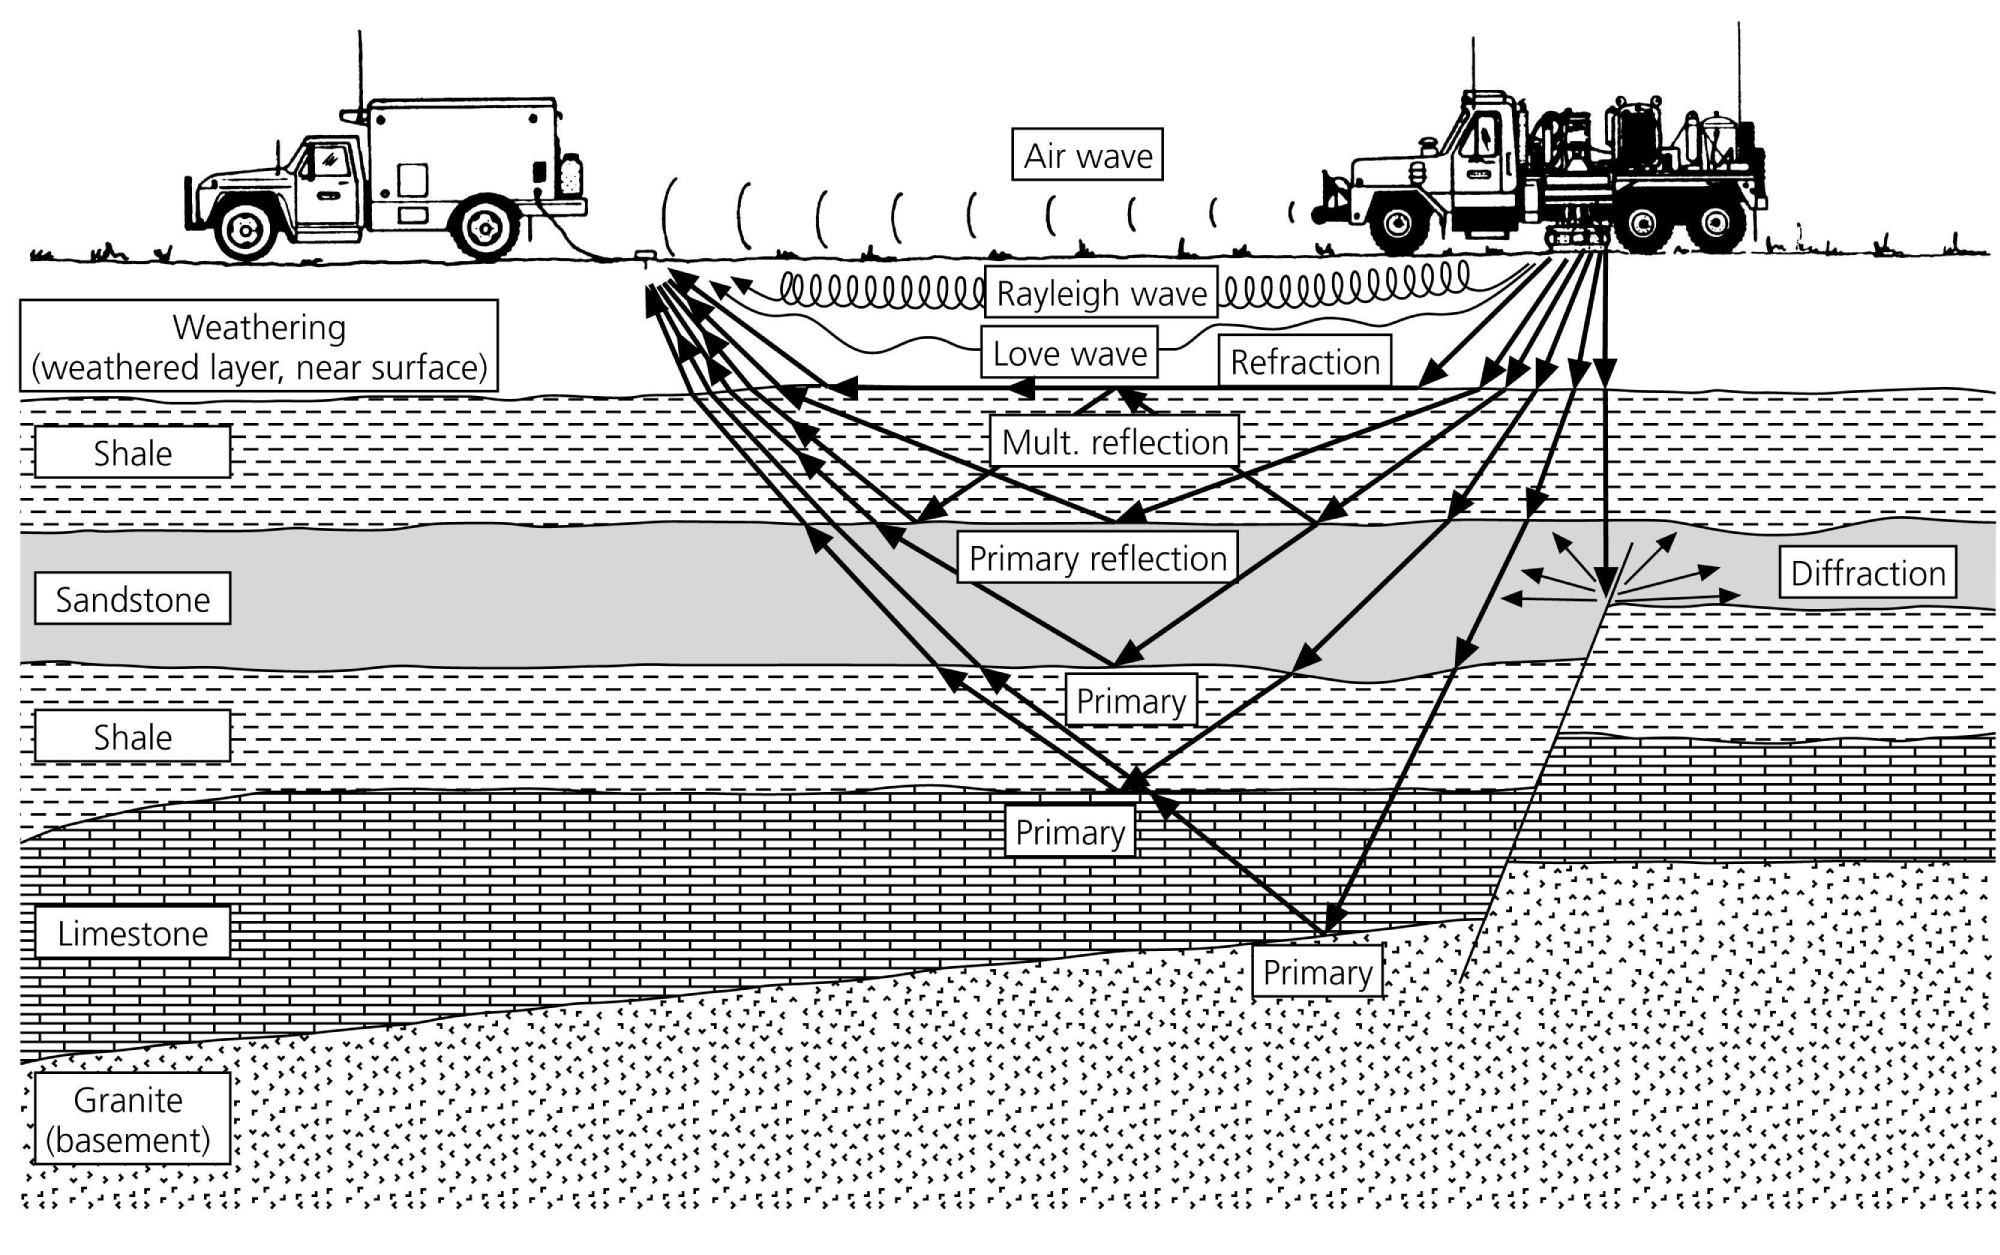
. In the last 50 years, much effort has been made to image the Rocky Mountain
region of the United States with seismic profiles in order to find oil
and gas reserves (Figure 1). As a result, subsurface deformation features
such as thrust faults from the Sevier Orogeny and reverse faulting from
the Laramide Orogeny have been imaged and then used to interpret the tectonic
story of the western U.S.
The Method
The seismic reflection method uses active sources, or artificial
earthquakes, to measure the travel times of the Primary seismic waves
from the source to a transect of sensors. The primary goal to identify
and image reflectors in the subsurface. Reflectors depend on the density
and speed contrasts between two layers which controls the angle at which
the P-wave reflects. (Figure 2).
By choosing a common reflector point at a common depth for each sensor (Figure 3), a common reflector for each sensor will represent the same surface assuming it is horizontal. By taking into account the offiset distances of each sensor and any diffraction of the propagating wave due to non-horizontal surfaces this hyperbolic reflector curve will flatten. All the traces are summed for the sensor above the common depths (Figure 4).
These outpust traces are created for each sensor, then they are combined
to make one image (Figure 5).
Example of seismic reflection in the
Laramide/Sevier Overlapping Region.