| Intro | Seismology | Heat flow | Gravity | Conclusions | References |
| Low velocity zone | Traditional techniques | ||||
| Mantle stratification (via receiver functions) | Admittance | ||||
| Coherence |
Coherence
There are many approaches and variations to the study of coherence, and this overview will focus on the coherence technique as it was originally formulated [Forsyth, 1985] and discussed in Watts (2001).
Coherence is a measure of the correlation between topography and gravity and calculated by the ratio of cross power spectrum to auto power spectra:
γhb2 = |Phb(k)|2 / Phh(k) Pbb(k)
h represents topography and b the gravity anomaly, Bouguer gravity anomaly in this case.
As does any correlation, coherence varies from 0 to 1. Qualitatively, it is a measure of how much of the observed gravity anomaly can be predicted directly from the topography. If γhb=0, there is no information on gravity from the observed topography. This limit is achieved at very short wavelengths where flexural compensation is complete. If γhb=1, local isostasy is active.
As with admittance, the information on the flexural rigidity lies in the relationship between topography and gravity. For example, in the case of Bouguer coherence for a surface load:
Phb=HtWt
where Ht is frequency domain topography from surface loading
and where Wt =Ht ρc Φ(k) / (ρm-ρc) is the flexural response
and again, Φ(k)=[ Dk4/(rm-rc)g +1 ] -1
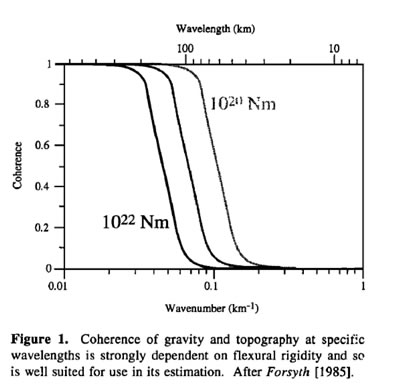
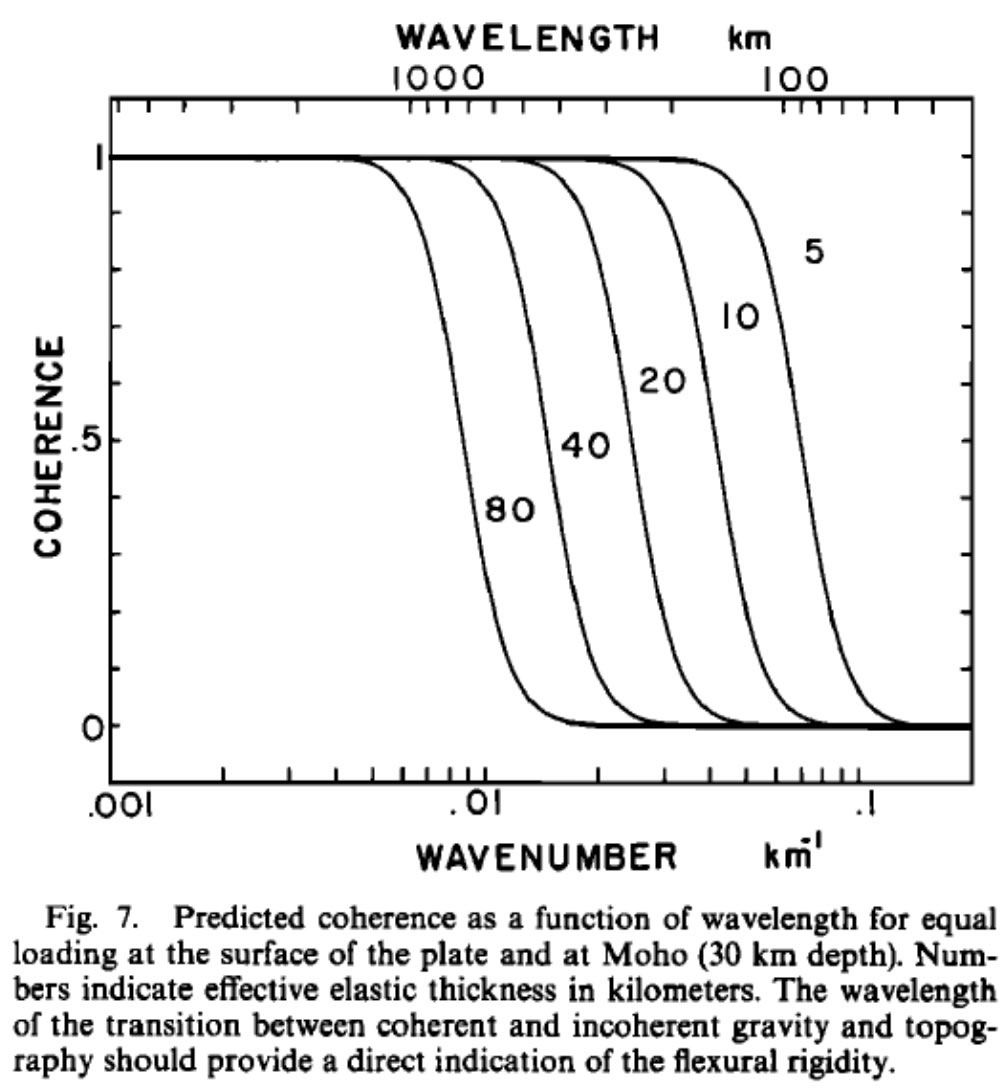
Also as with admittance, the coherence is strongly dependent on flexural rigidity. It is not as dependent on surface vs. depth loading, however. As shown in the figures below [Forsyth, 1985], for a given flexural parameter or elastic thickness, there is a characteristic narrow band of topographic wavelength over which the coherence changes rapidly.
The coherence technique has been applied to the western U.S. [Bechtel et al., 1990; Kirby and Swain, 2009; Lowry and Smith, 1994]. The results show that elastic thicknesses range from just a few km (e.g. Basin and Range) to well over 100 km in the Superior Province. Unfortunately, the resolution of these estimates is limited by the topographic wavelength of signal that must be used. For example, an elastic thickness of 80 km begins to show a breakdown of flexural support only at wavenumbers greater than 0.01 per km, wavelengths of ~650 km.
Nevertheless, as seen below, various coherence based techniques show high Te in the Wyoming Craton relative to the rest of the western U.S.
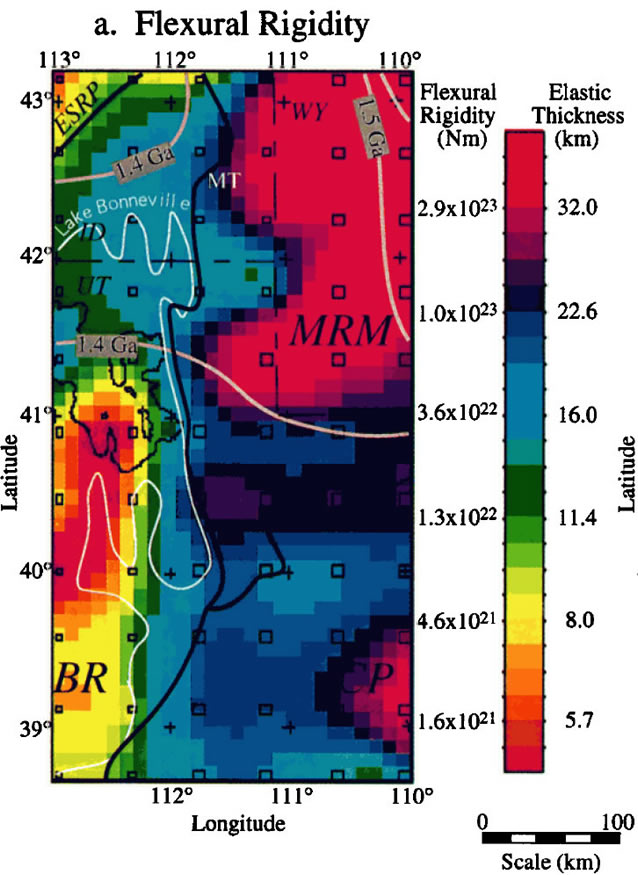 |
Lowry and Smith (1994; at left) resolve streadily increasing elastic thickness into the Wyoming Craton, which sits at the northeast edge of their study area. The authors further negatively correlate flexural rigidity with heat flow, predicting a high strength of the craton even outside of the region examined by spectral gravity techniques. |
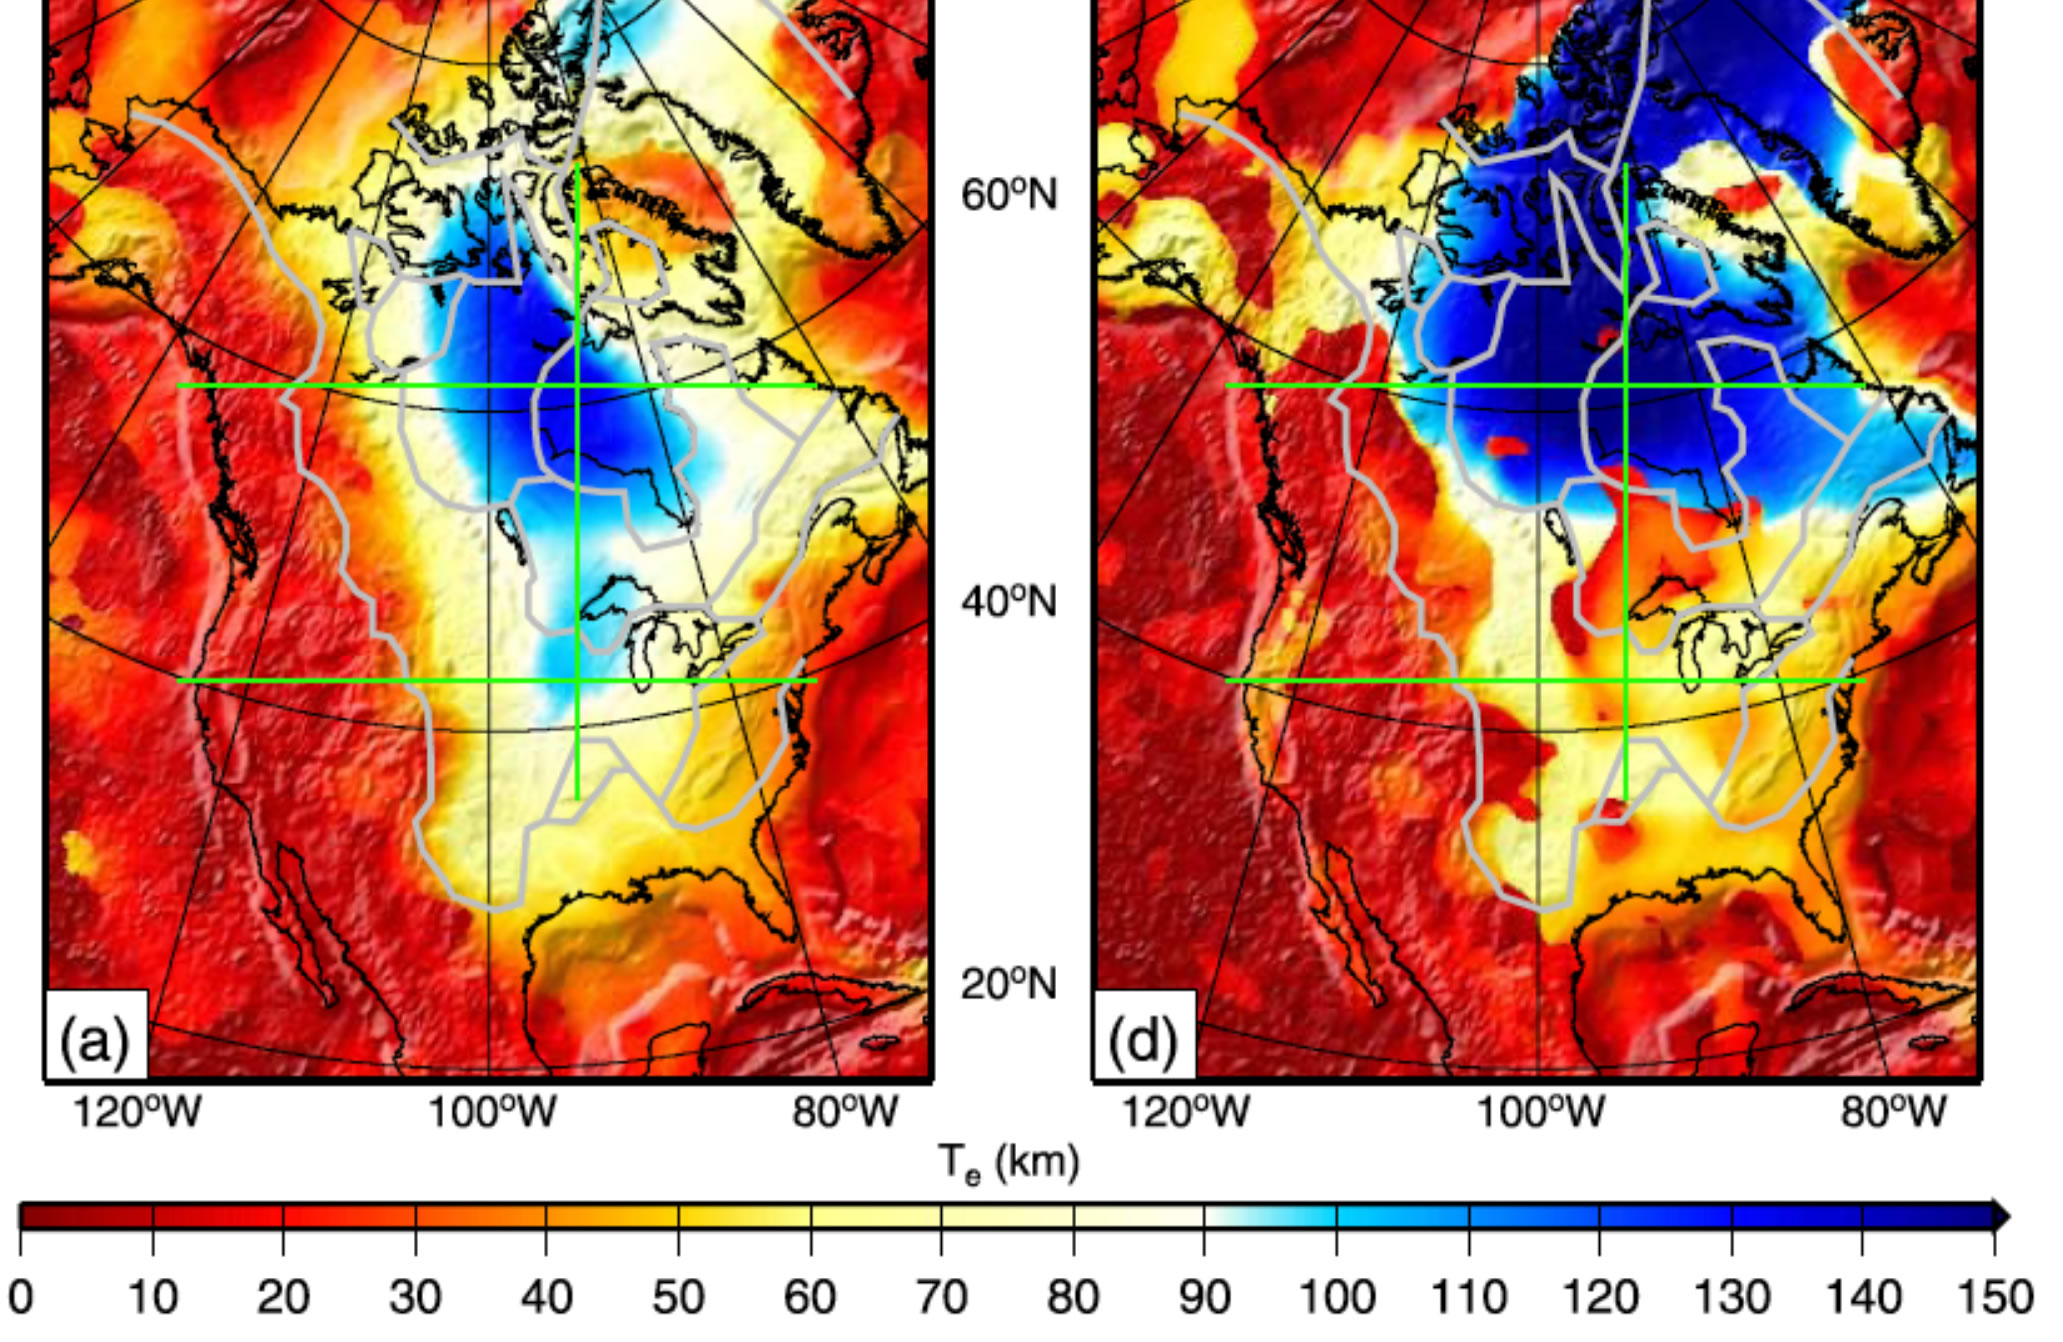
Kirby and Swain (2009) compared various spectral techniques by examining North America. As seen below, the results are robust and indicate a marked increase in Te east of the Cordillera (gray line running ~ north-south west of 100 degrees). More interestingly, the authors show an entrant of low strength into the continent at ~40 degrees N, near to the Cheyenne Belt. This drop in strength may represent a modification of the lithosphere or an anomalously high geothermal gradient caused by refraction of heat at the base of the cratonal keel.