| There are five major mechanisms
of crustal thickening that need to be considered (Bird, 1984). Some
of these mechanisms may affect this system to a greater degree than
others. The first mechanism is Sedimentation. Estimates for sediment
volumes from the Cretaceous to the present spread over the Great Plains
would yield a crustal thickness of only 200 m which is just a few percent
of the total crustal thickness increase. The second mechanism is magmatic
intrusion. This effect is estimated to contribute just 0.1% of total
crustal thickness in the Rocky Mountain foreland. Furthermore, vast
undiscovered plutons in the lower crust would be required to provide
even a mild contribution to the overall crust in the area (Bird, 1984).
The third mechanism is crustal shortening which is easily quantified
by measuring displacement across compressional faults. This does explain
a small amount of the thickening in the Rocky Mountains but is absent
in the Great Plains.
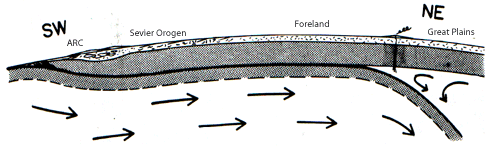
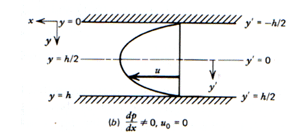
Of these five models, the last two are favored for the Rocky Mountain foreland and Great Plains. Both rely on displacement of material in the lower crust. The fourth mechanism is lateral shear in the lower crust. Simply, this would be described by flow in a channel driven by a plate edge, like a piston in a tube. And finally, the fifth mechanism is passive flow, or less formally oozing. Shearing and Pushing Bird (1984) strongly advocated this mechanism of crustal thickening. As the name implies, this mechanism requires that a slab is moving below the Western US providing the basal shear stress. More specifically, it requires that the Farallon plate underwent flat subduction and was at a significantly shallow angle of subduction, such that the top of the slab was in contact with the lower crust of the continent. Whether or not the Farallon slab underwent flat subduction is still under heavy debate. In the figure below, we can see that the continental crust was under ridden by the Farallon slab for over 1000 km before the slab took on a steeper angle and formed a hinge line. It’s intuitive that the larger the distance between the edge of the continental plate and this hinge line, the less likely that it’s physically accurate.
From Bird 1984 paper, showing importance of the direct under riding of the Farralon plate all the way to the Great Plains.
Still, even if flat subduction did not occur, some sort of subduction did occur. So at some level, the lower crust near the edge of the continental crust was pushed to the east. Whether the hingeline is close to the plate boundary or not, lower crust was pushed eastward and influences the following mechanism.
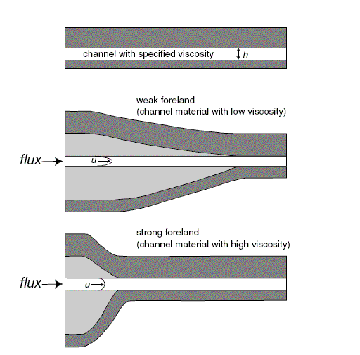
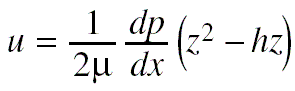
Oozing This model is best visualized through a simple diagram. The model below is from a paper by Clark and Royden (2000) dealing with similar thickening mechanisms for the margin of Tibet. This mechanism is also referred to as channel flow or Poiseuille flow.
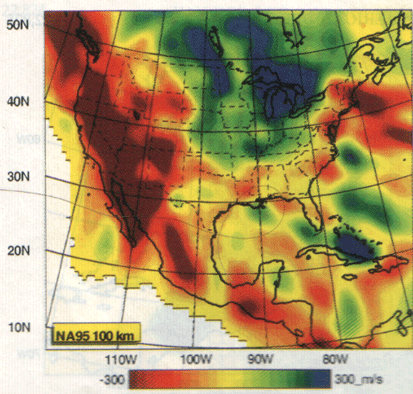
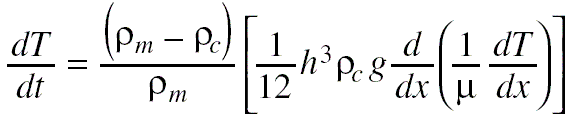
A shortcoming of favoring this type of support is that it is considered to be reversible. After all, if it could flow to the East so easily from the Colorado Plateau, there would be little keeping it from flowing further to the East, North or South. If we return to our plot of crustal thickness for North America we’ll see that this accommodation space is not so easily found. Overall this mechanism of crustal thickening seems to hold water pretty well. Effects on viscosity From measurements made after observing postglacial rebound, dynamic viscosity values of 4*10^19 Pa s. Deeper mantle values have also been determined as being about 10^21 Pa s. From this, µ (viscosity) can be determined from the simple relationship, dynamic viscosity = µ/density. It is also important to know the temperature dependence of viscosity. µ (t) = µ *exp(E/RT) where µ is the viscosity, E is a diffusion coefficient parameter, R is the universal gas constant and T is the temperature. This basically tells us that viscosity will vary significantly in the low temperature range. Aside from composition, this temperature dependence will affect when lower crust would move (if at all). Also, as shown above, the shape of the wedge will also be affected by the viscosity value. |