Osgood Road, Fremont, southern Hayward Fault Site map and cross-section 3-d view of site complexity
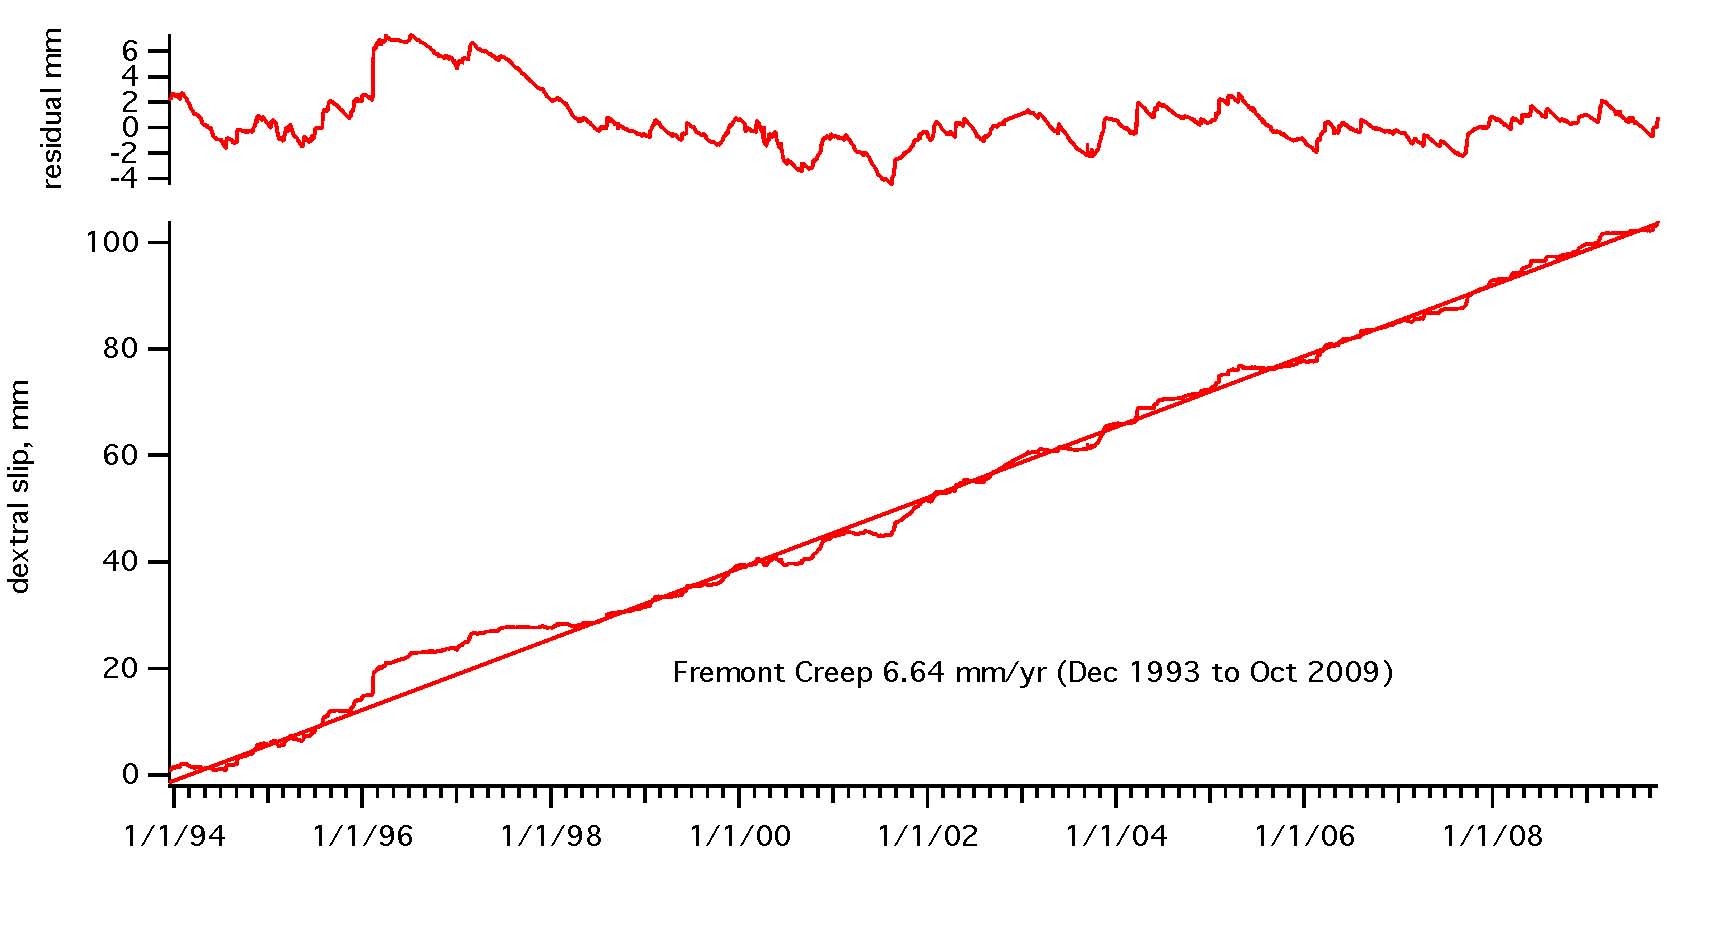
The mean creep rate in Fremont for the past two years has been approximately 6.5mm/yr consisting of creep events that occur largely between the months of February and June (see image.jpg below, or image pdf). The mean creep rate 1993/2009 was 6.6 mm/year. Creep event amplitudes are typically ≈1 mm.The largest creep event was 4.5 mm in 1996 and it was followed by two years of anomalously slow creep. The 16 year calibrated and corrected data may be downloaded here in various formats. Only the first two decimal places are significant.The site was vandalized 1 June and the transmitter stolen. It was vandalized again and the main transmitter damaged 1 July 2007.
All the data 15 Dec 1993 to 1 October 2009 are available as single files below. FORMAT example. The data are in two columns with a one line header labelled Fremontday [date in excel format (MM/DD/YY hh:mm:ss)], amd Fremontmm [dextral slip to four decimal places of which only two are significant]. The starting value is arbitrary. There are 438416 rows in two columns and the unpacked .csv file is 11 Mb. The downladable zip files are 1.3 Mb
1. All data 1993-2009 . Time tagged variable spaced data. A .csv zipped file. The data are listed with time tags that vary in time interval from 10 minutes to 1 hour.
2. All data - Hourly data (Equally spaced data at hourly intervals - a comma-separated zipped file.
3. All data - Ten-minute samples interpolated from raw 15 minute, 10 minute and 5 minute samples -- a comma-separated zipped file.

THE INFORMATION BELOW IS UNLIKELY TO BE OF INTEREST TO MOST READERS BUT IS RETAINED FOR ARCHIVAL PURPOSES
Alternatively the data may be downloaded as yearly listings (200k to 1.4 Mb) of 10 minute samples by clicking on the appropriate year here 1993 1994 1995 1996 1997 1998 1999 2000 2001 2002 2003 2004 2005 2006 . The data start at an arbitrary negative value in mm and by 2006 had recorded a total dextral slip of ≈8cm. Two creepmeters here monitor complex motions caused by a wedge extending 7 m into the subsurface that sometime moves more with the west side of the fault and at other times moves more with the east side of the fault. Differences of up to 3 mm occur between the signals recorded by the two creepmeters. Equally spaced 10 minute samples of J3293 data for 2004/2006 can be downloaded here. A gap in the J3293 data (a 30-m-long creepmeter with 32 mm range, secured by two 10 m deep helical pile systems -red trace) occurred May-July 2005 due to data overflow at 1 sample per minute in the on-site logger. The transmitted channel cfw1 (33m-long-creepmeter with 100-mm-range & with 30 m deep vertical piles -green trace) was also inoperative at this time (May 24-July7), but the J3293 data provide an absolute datum across this gap since it was undisturbed when restarted 7 July.
The figure below shows the way in which the two creep meters respond to slip on a shallow wedge in the fault zone in Fremont. They record identical cumulative slip even though individual creep events show different characteristics.