
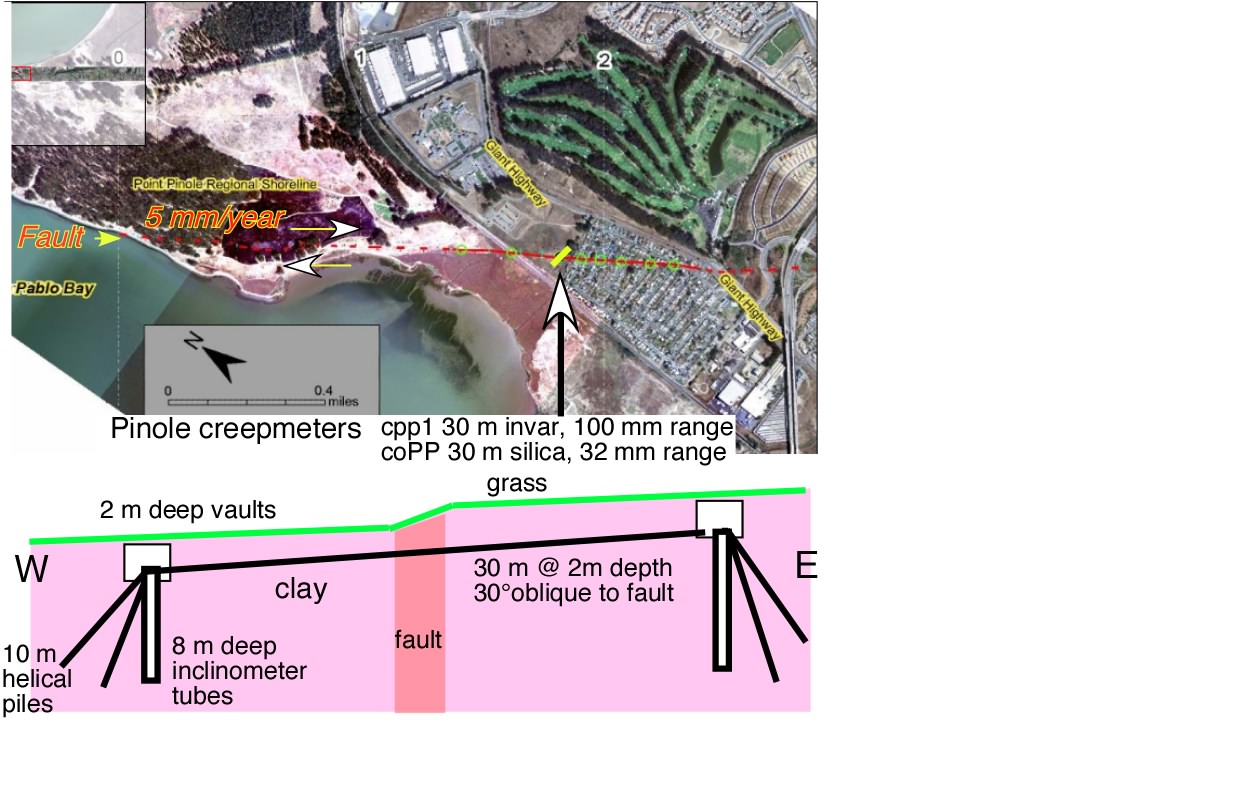
Point Pinole, northernmost Hayward Fault Site map and cross-section.
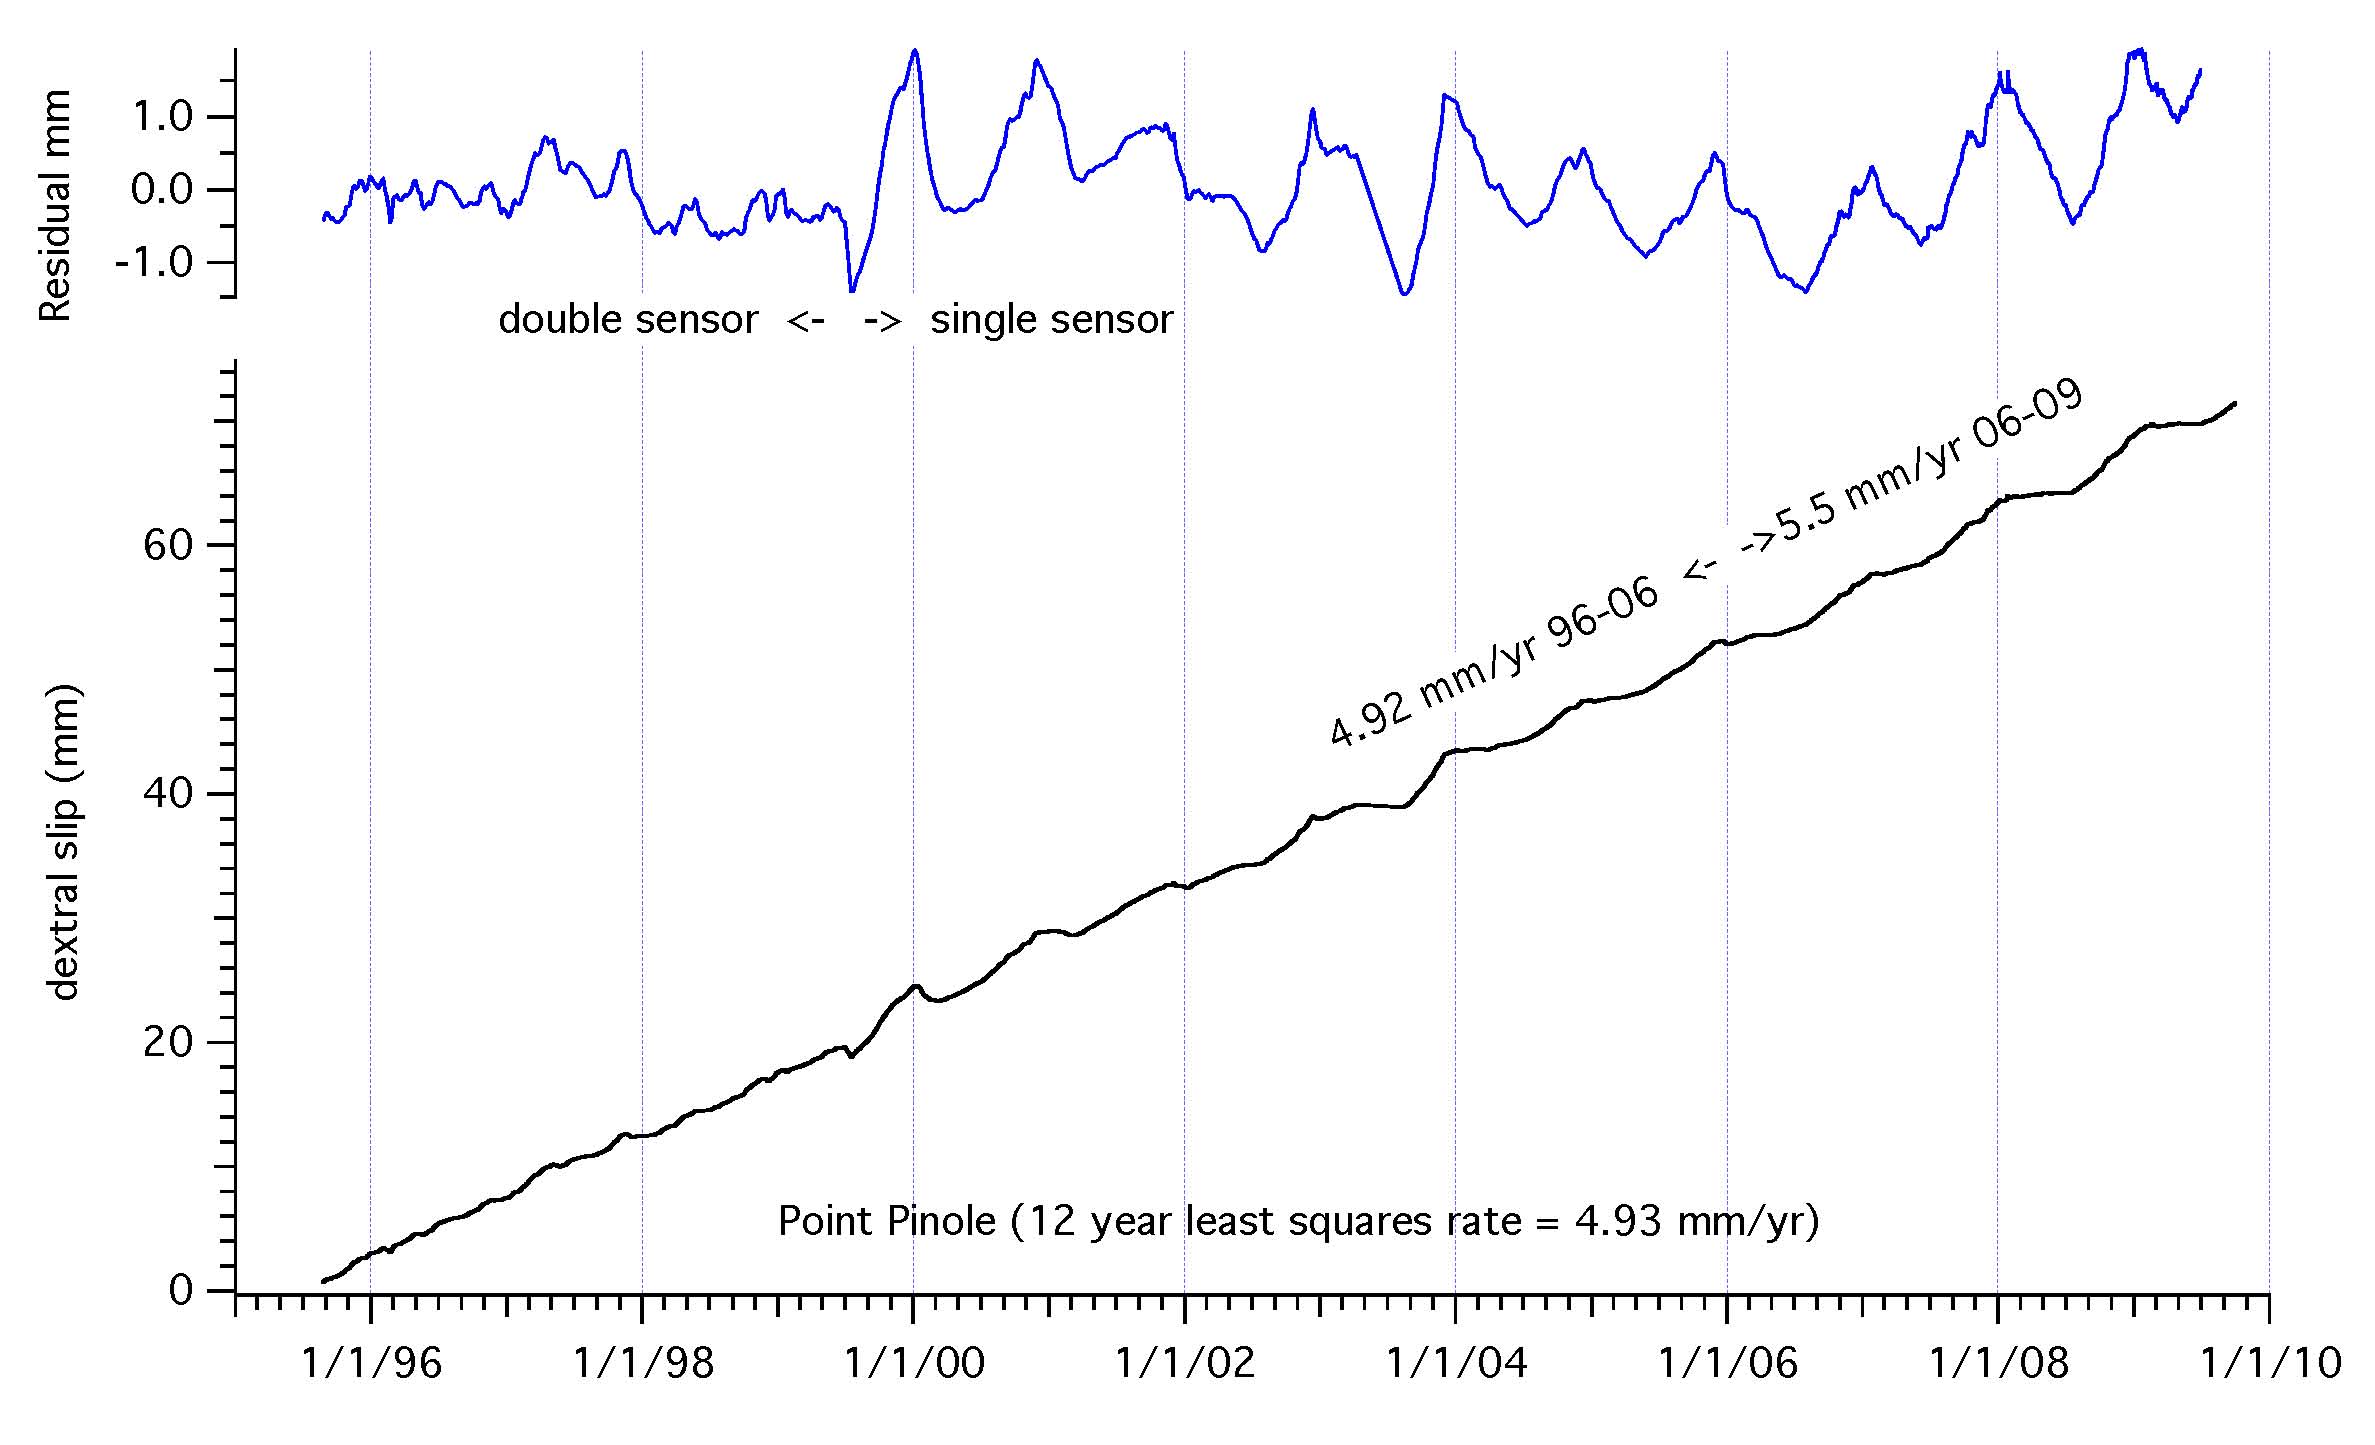
The creep rate here for the past 14 years has been approximately linear at 4.93 mm/yr with a 2 mm seasonal signal.[see image jpg, or image pdf]. An apparent 5-10% increase in rate occurred after 2006. The primary data are transmitted by a Sutron DCP, but an independent data logger was installed in July 2004 to circumvent loss of data due to telemetry failures. This data logger has occasionally sampled at 5 minute intervals, ten minute intervals and, since 2008, at 15 minute intervals.
All data 25 August 1995 to 1 October 2009. FORMAT. The data are in two columns with a one line header labelled pinoleday [date in excel format (MM/DD/YY hh:mm:ss)], amd mm [dextral slip to four decimal places of which only two are significant]. The starting value is arbitrary. There are 733976 rows and the unpacked zip file is 18Mb. The zip files are 2.6Mb
1. All data 1995-2009 . Time tagged variable spaced data. A .csv zipped file. The data are listed with time tags that vary in time interval from 10 minutes to 1 hour.
2. All data - Hourly data (Equally spaced data at hourly intervals - a comma-separated zipped file.
3. All data - Ten-minute samples interpolated from raw 15 minute, 10 minute and 5 minute samples -- a comma-separated zipped file.
The graph above shows a steady 4.93 mm/yr creep rate at Point Pinole, with varying noise levels that characterize three periods of operation. The most recent four years on this plot can be fit to a 10% acceleration of rate (to 5.5 mm/yr) but this is marginally above the noise level (2 mm at annual periods). The noisiest data occurs during a period ( 2000-2004 ) when funding to maintain the instrument was unavailable, during which time a submerged electrical cable failed. The creepmeter initially consisted of an invar rod enclosed within a steel tube lying freely within the fault zone. Transducers in the period 1995-2000 measured the two changing gaps between steel buried tripods drilled to 6 m depth, 30 m apart and 7.5 m to the west and east of the fault respectively. Their outputs were summed to provide the creep signal, and the difference in length between the iron and invar was used to correct for thermal variations influencing the length of the invar. A fault in the 100 m underground signal cable to the transmitter caused the loss of two of these signals 2000-4. The cables were replaced in 2004 and an independent data logger started to circumvent transmission losses (J2215). The first unit uses the same invar rod but it now transmits a single transducer signal from the eastern end. Measurement of the differential thermal signal has been discontinued. The second transducer uses a quartz fiber length standard from which its original teflon coating has been stripped.
THE INFORMATION BELOW IS UNLIKELY TO BE OF INTEREST TO MOST READERS BUT IS RETAINED FOR HISTORICAL REASONS
Download calibrated recent microstation data (!!9 Mb file illustrated below) Pinole July04/Aug06. These 2-minute to 5-minute-sampled slip and temperature data illustrate the chilling effect of rainwater flowing from the east vault to the west vault via the silica fiber tube December to April each year. Note also the relative immunity of the creepmeter (±0.5 mm) to seasonal thermal variations exceeding 8°C. Data from August 2006 to June 2007 at 5 minute intervals (GMT time) are available as an Excel file consisting of nine 30,000 line columns. Columns 1, 4 and 7 indicate date and time, columns 2, 5 and 8 are the voltage output (multiply by -7.8557 to convert to dextral slip). Columns 3, 6 and 9 are the temperature. Excel 5.3Mb or tab delimited text 2.6Mb .

Noise levels are generally less than ±0.5 mm largely influenced by rainfall. The creepmeter is attached on east and west sides of the fault zone using two 10 m deep helical piles arrayed in the form of buried tripods. Noisy data between 1999 and 2004 were caused by damage to the 100 m long underwater cable linking creepmeter and satellite telemetry during a time of no funding.
