Comparison of NOHRSC (new, Aug 2010) scag vs. MODSCAG output at NSIDC
|
Comparison of NOHRSC (new, Aug 2010) scag vs. MODSCAG output at NSIDC
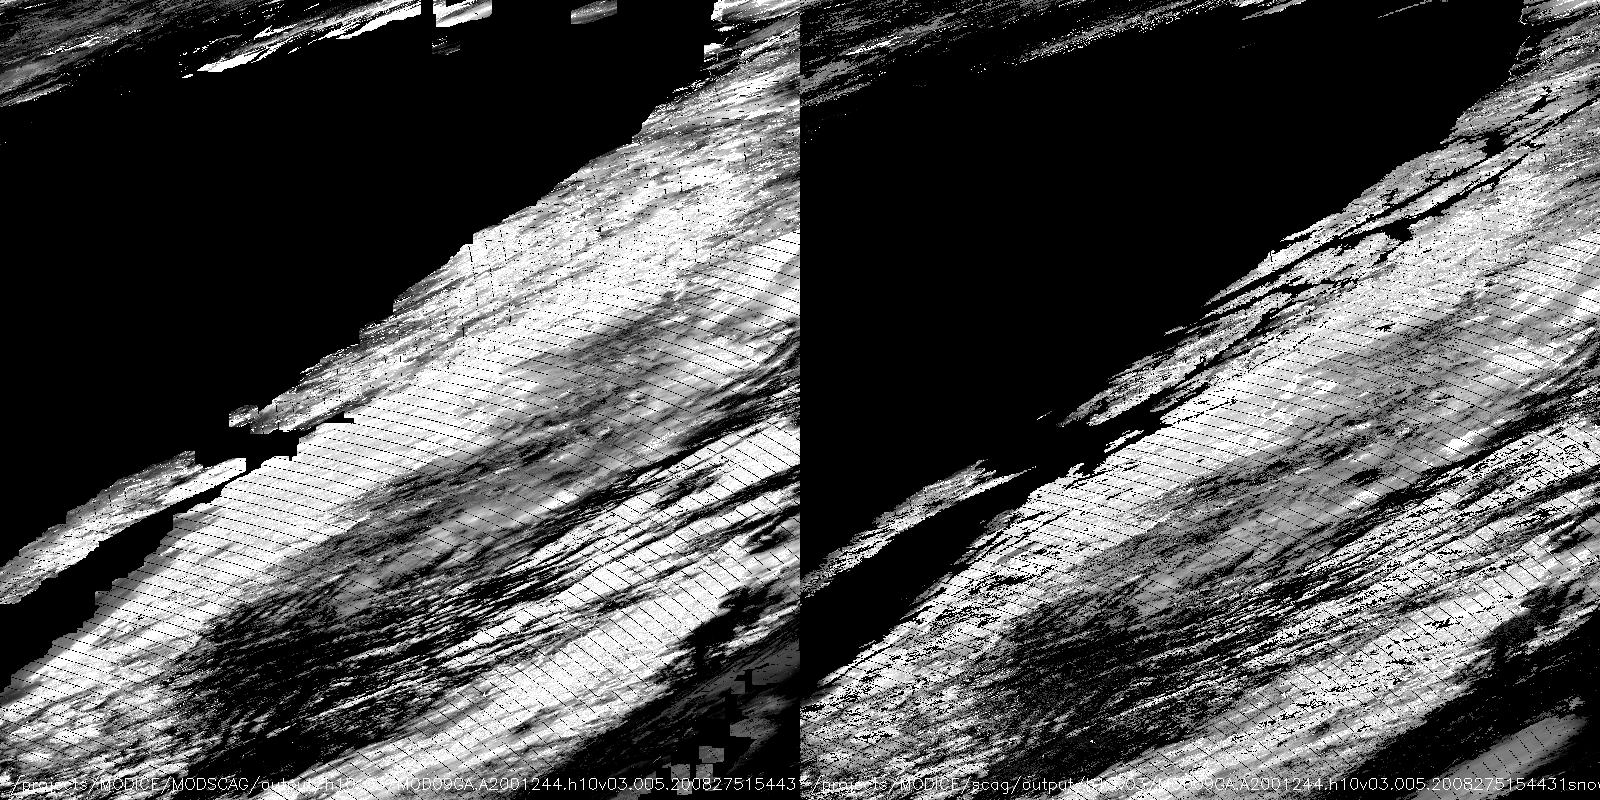
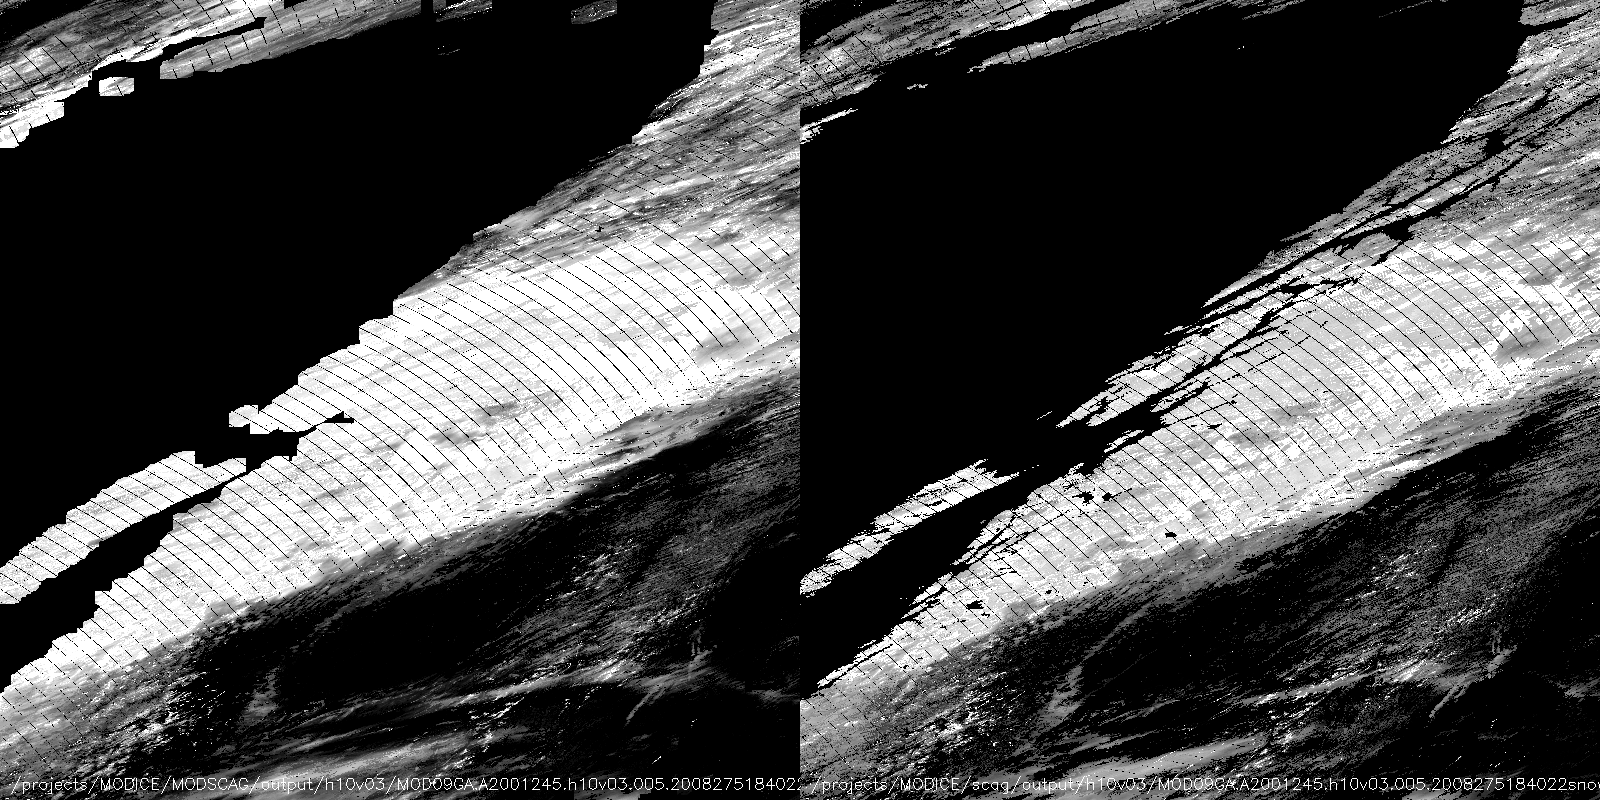
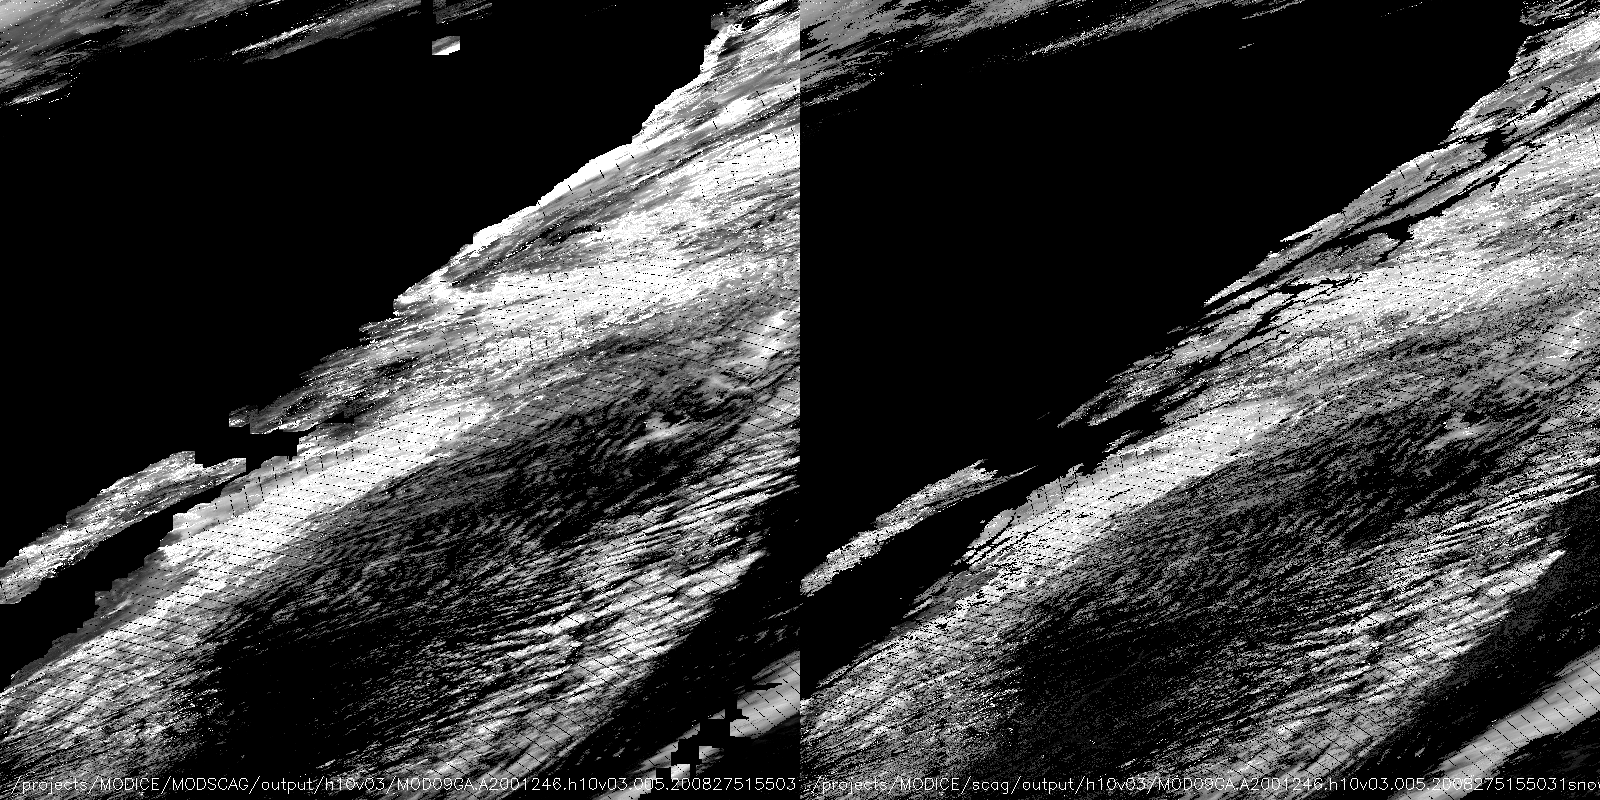
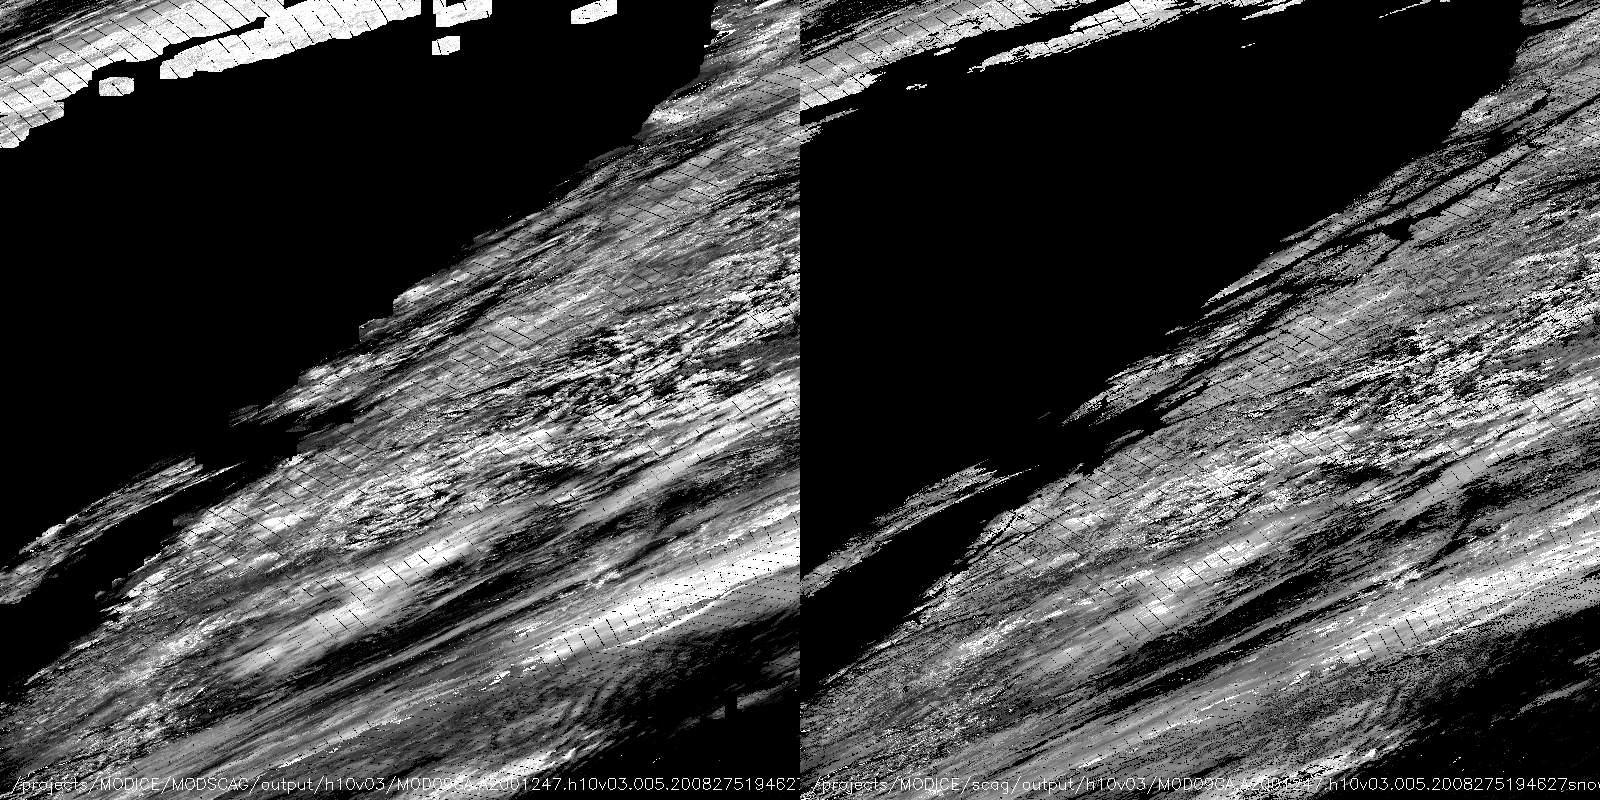
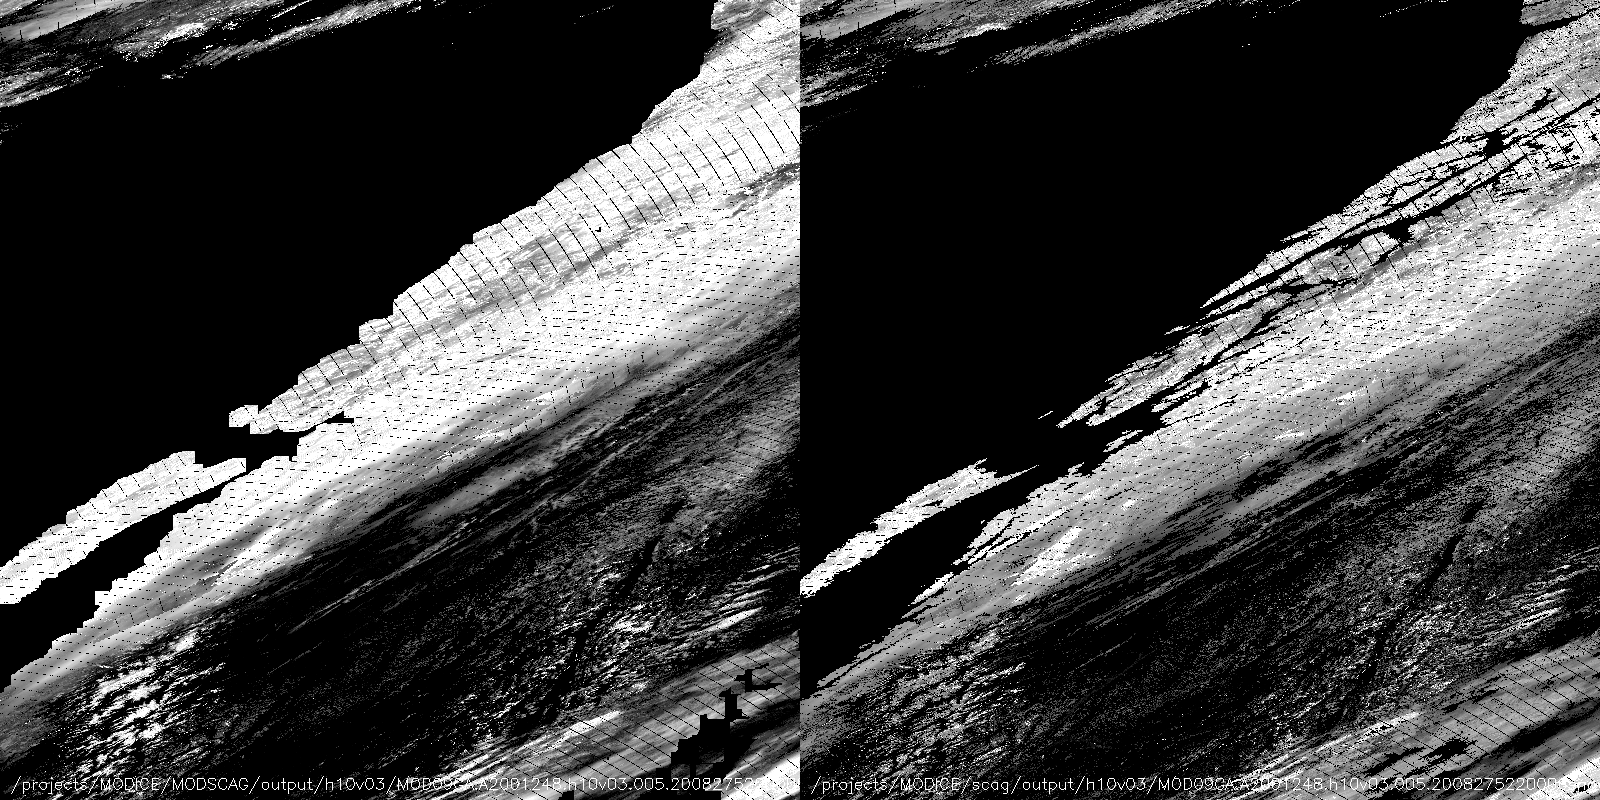
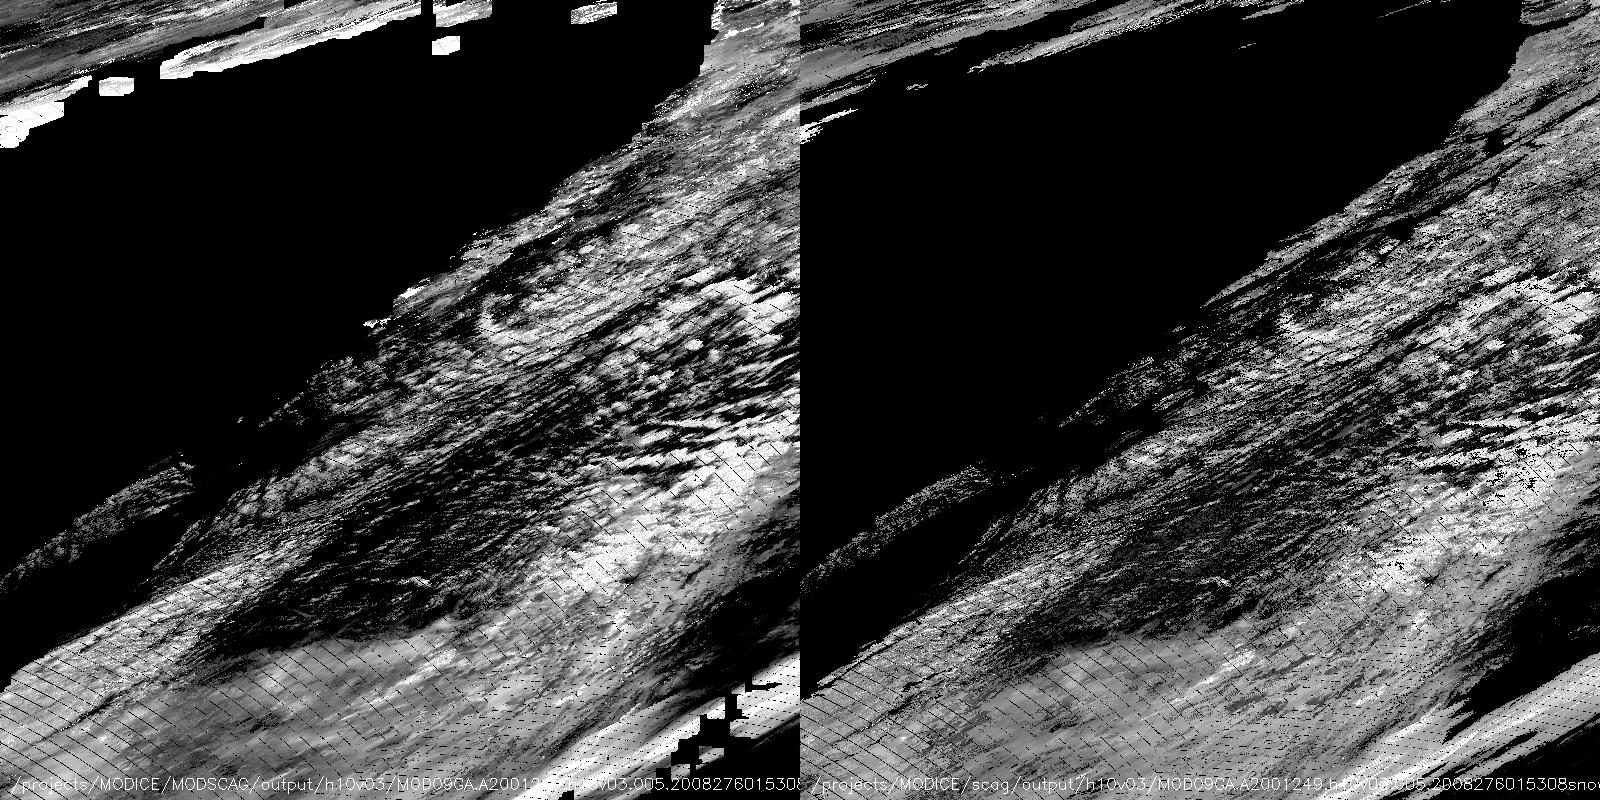
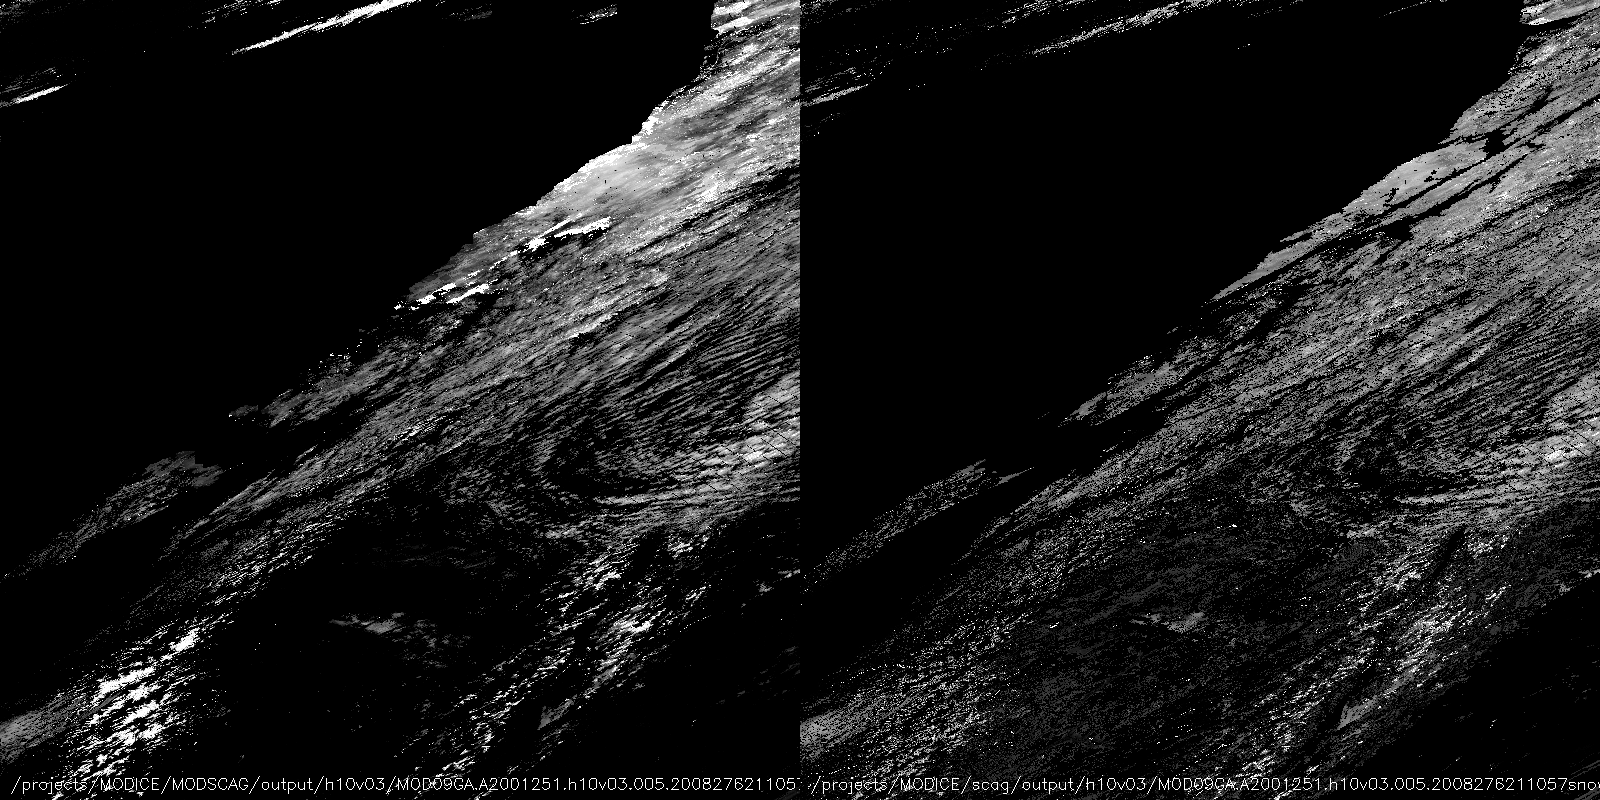
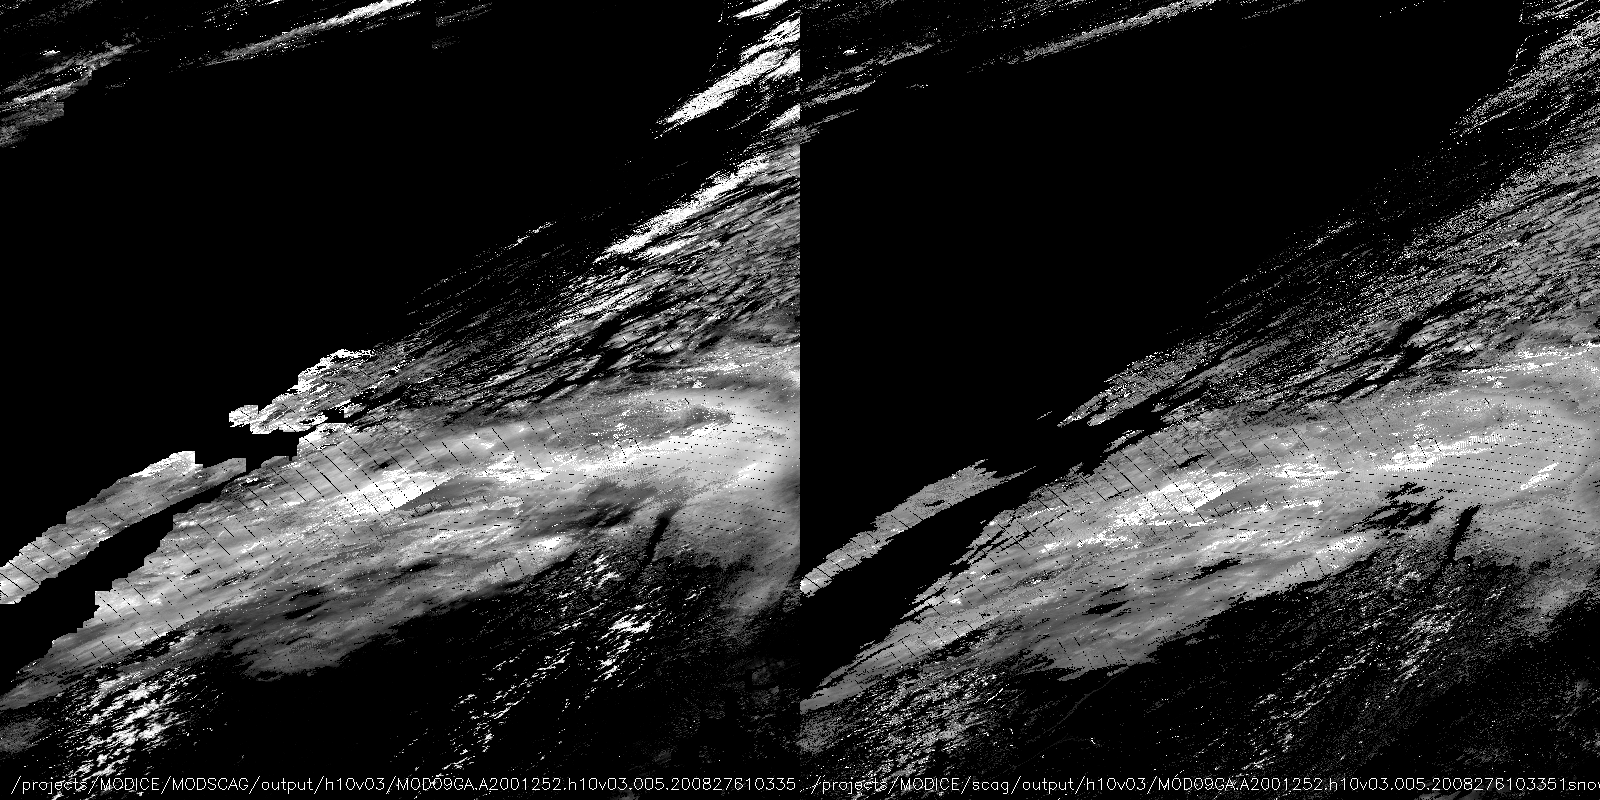
I compared original, NSIDC MODSCAG processing to output from latest version of NOHRSC scag from THP (August 2010) for h10v03 (SE Alaska tile). Each row contains
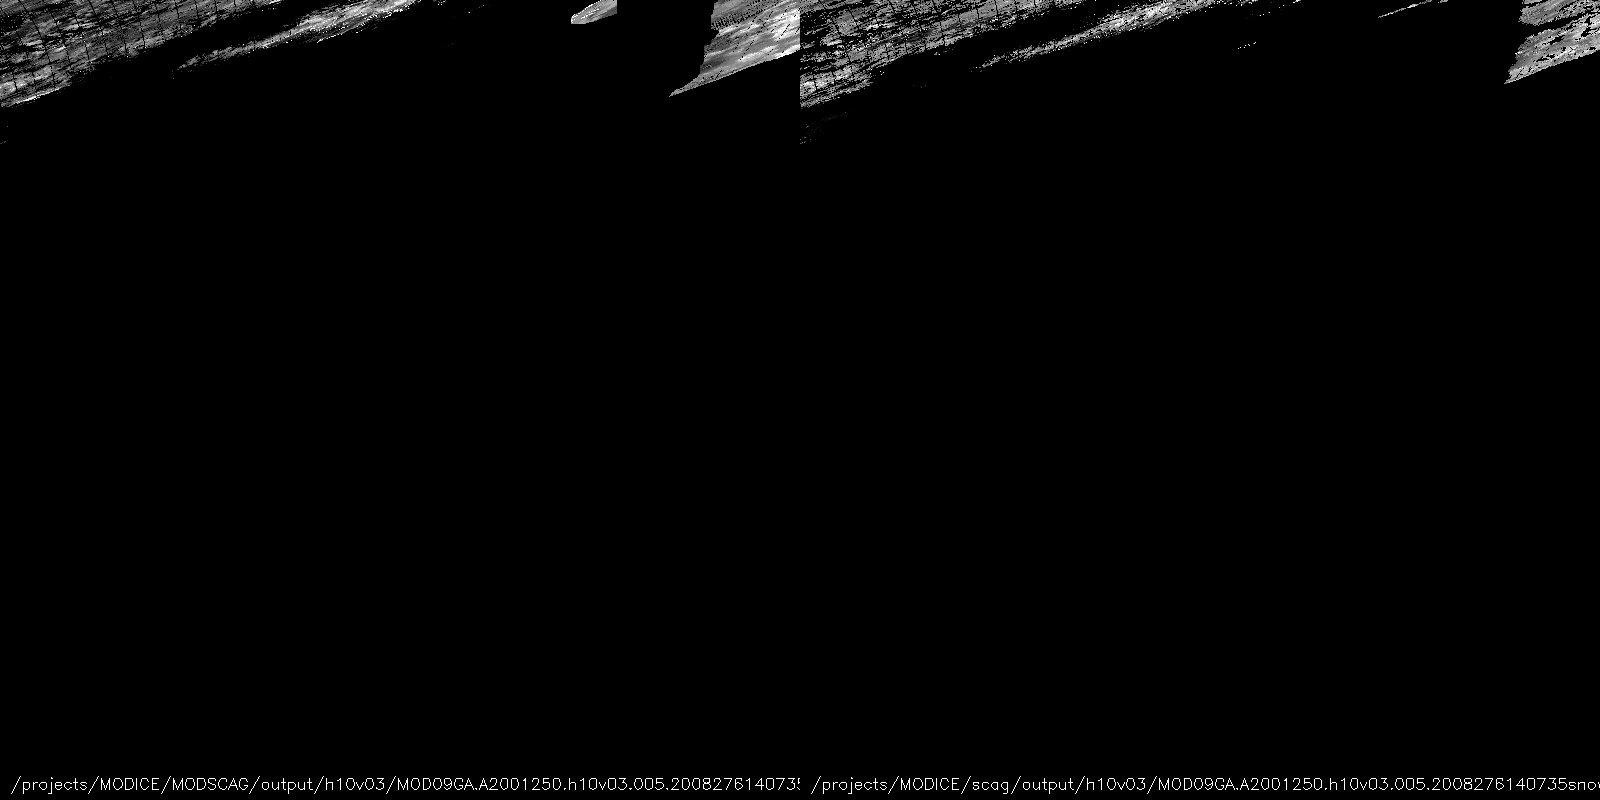
Original MODSCAG output (note blocky cutouts, due to my "likely ice" mask processing
NOHRSC scag output (note advantages of using land mask extracted from MOD09GA data)
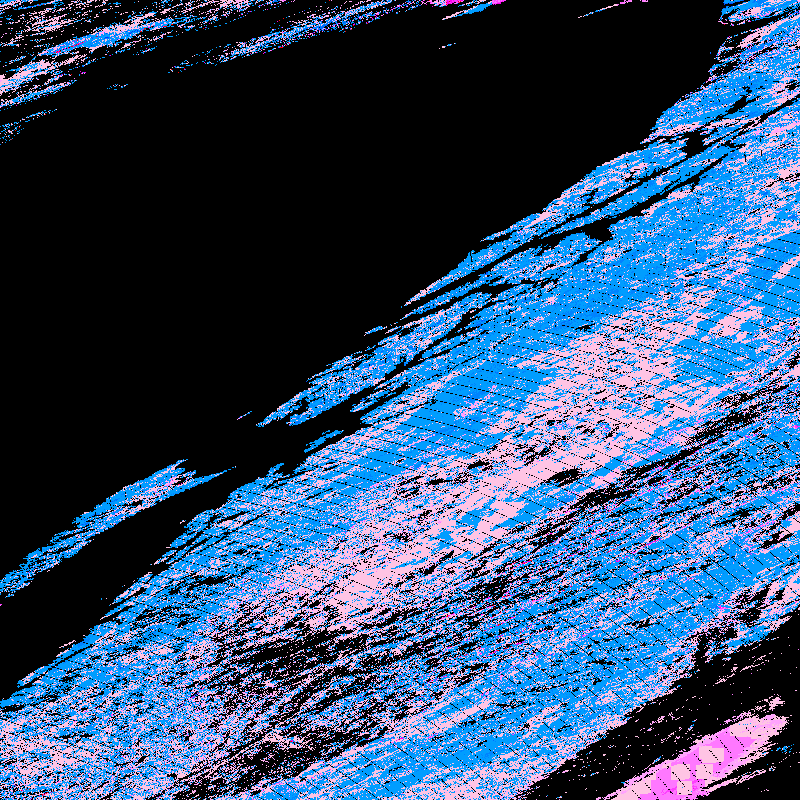
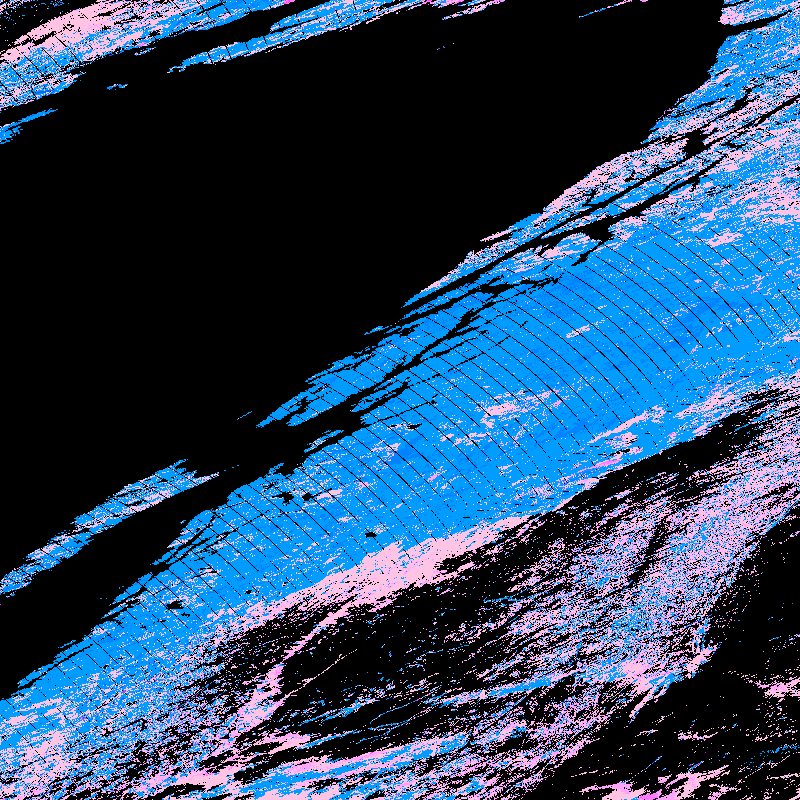
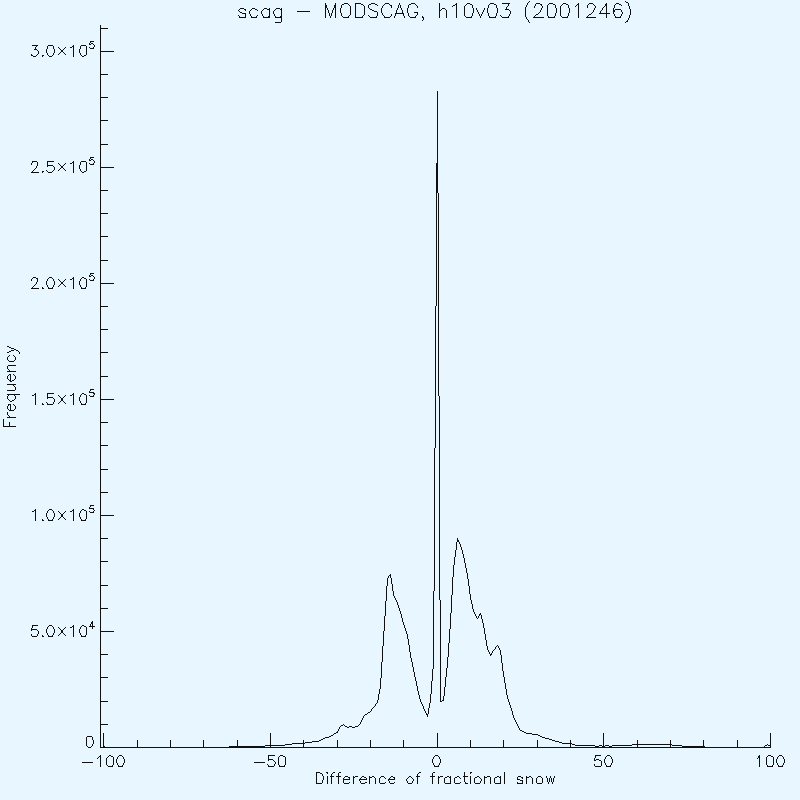
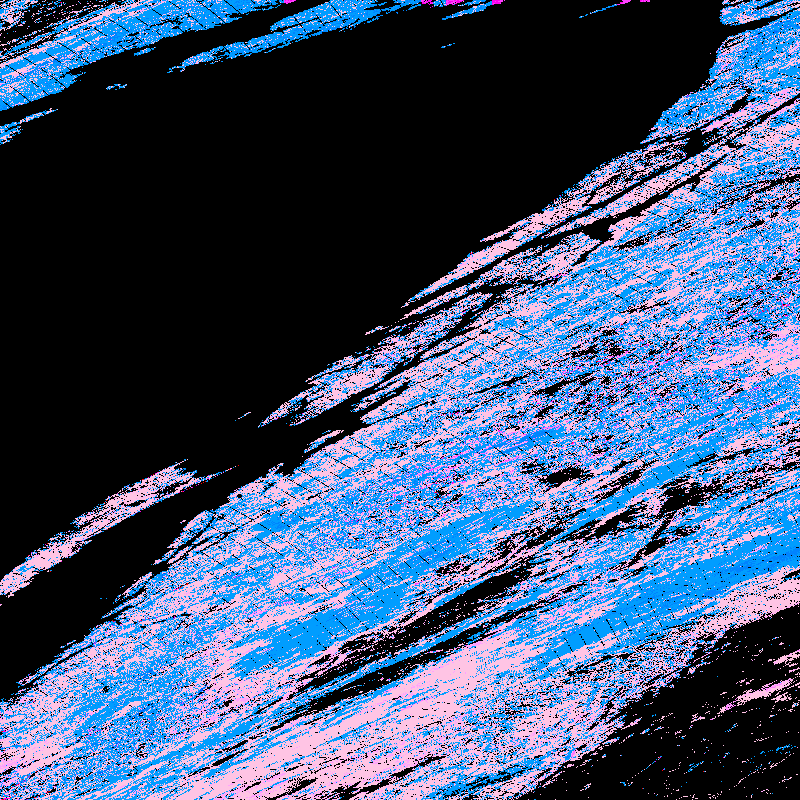
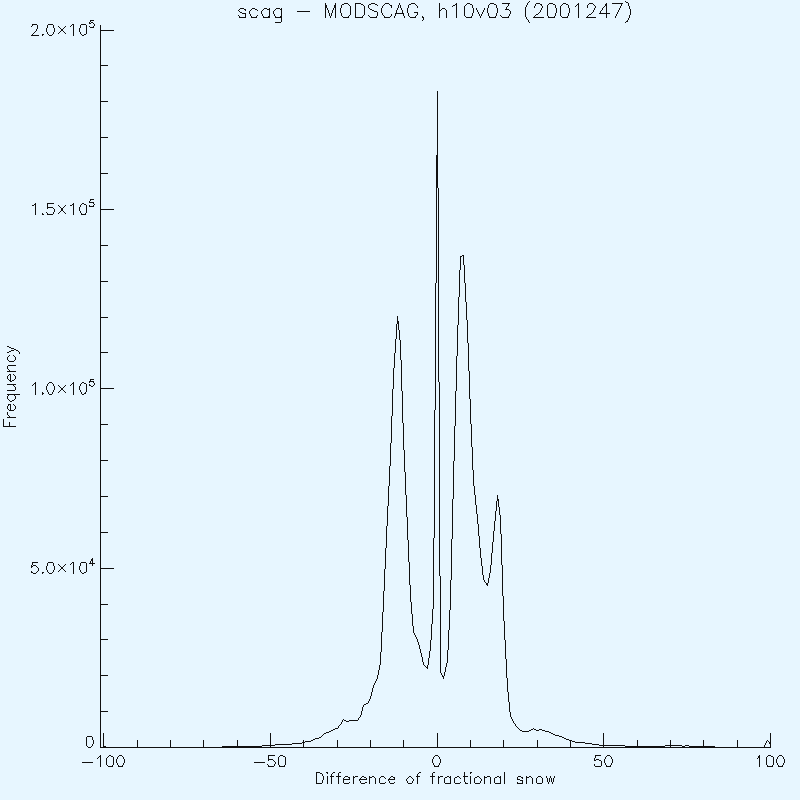
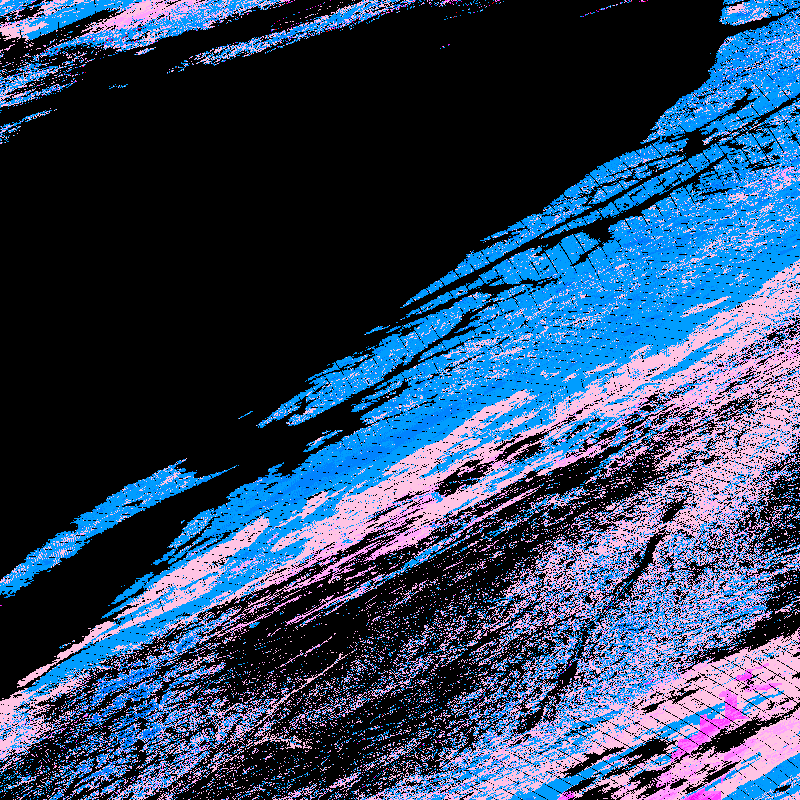
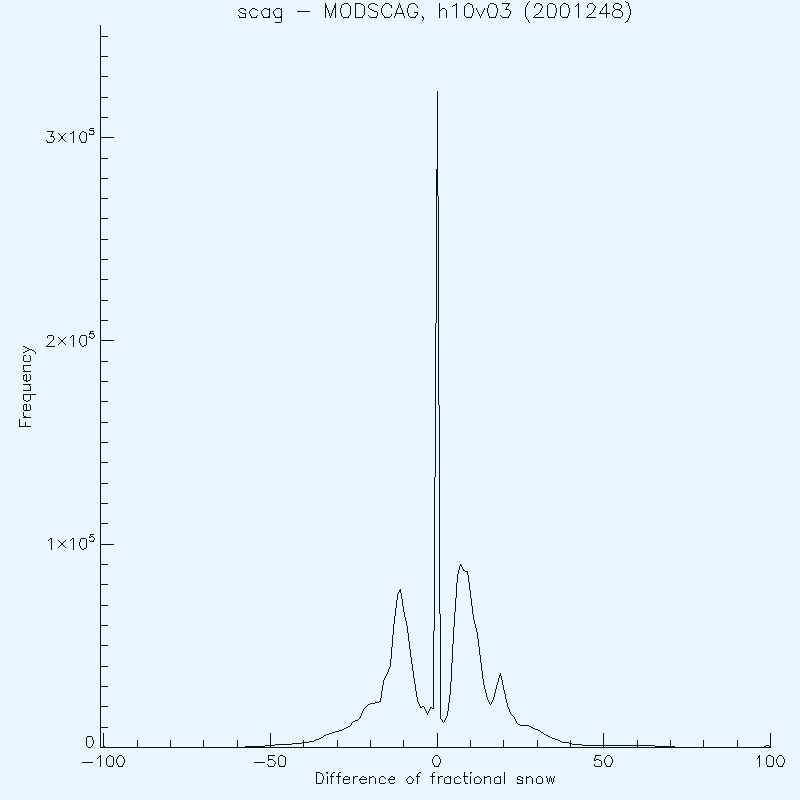
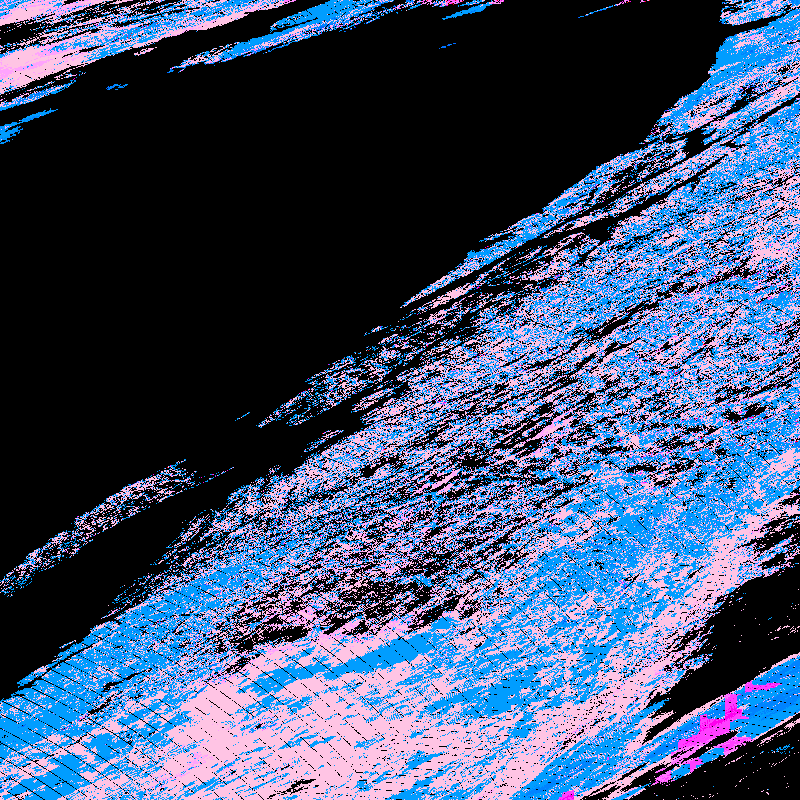
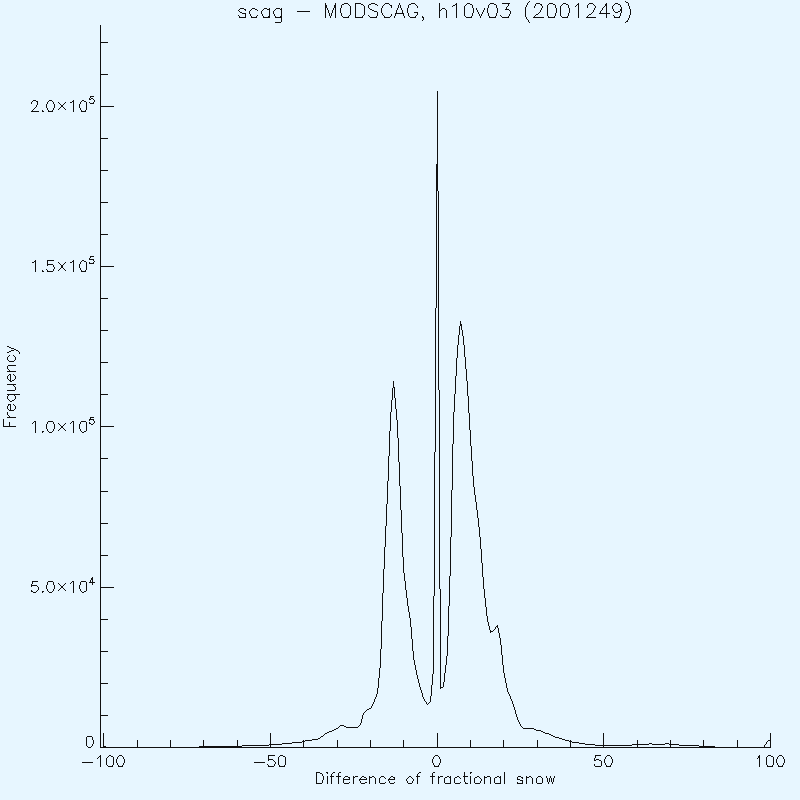
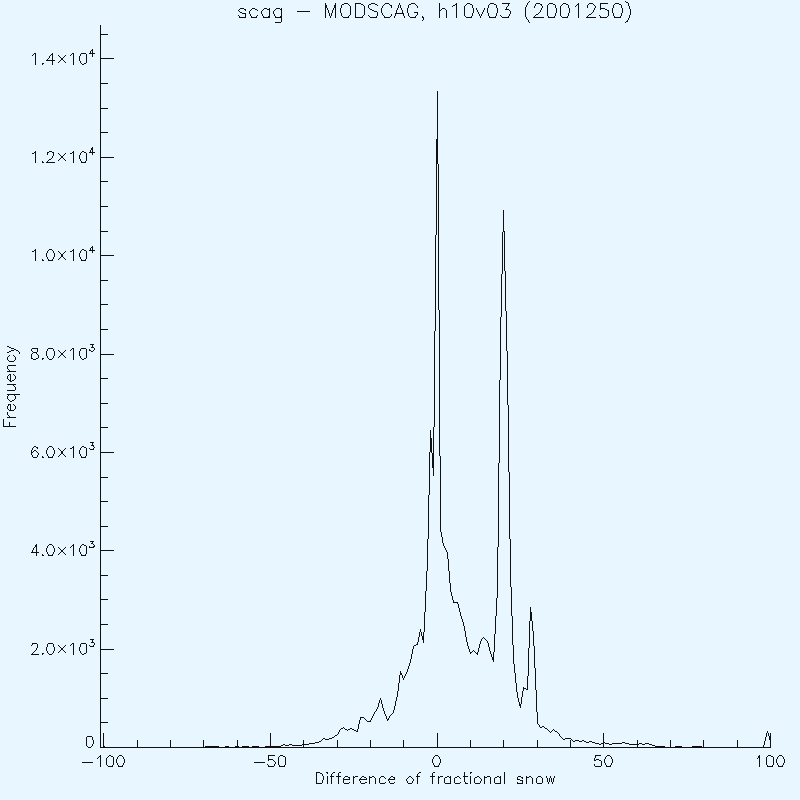
Difference image (anyplace where scag returned -0.01 I mapped to black); difference is scag - MODSCAG, blues are negative, pinks are positive
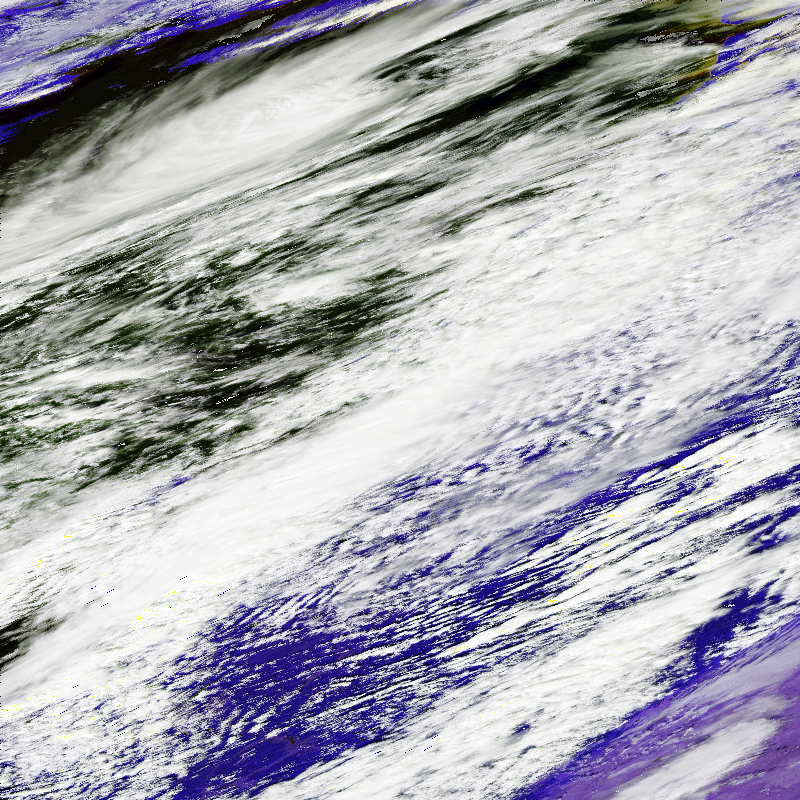
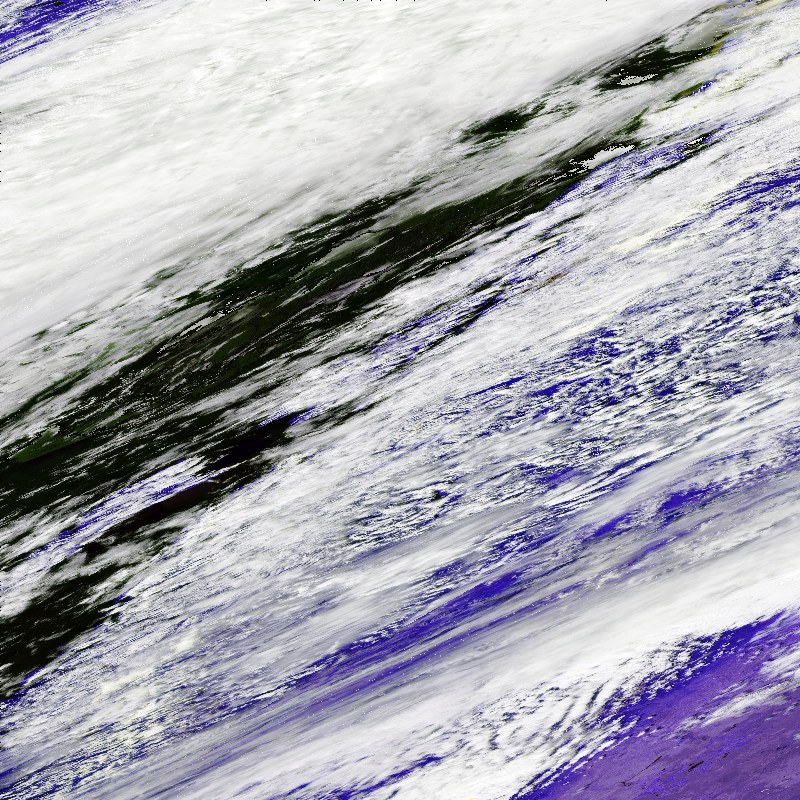
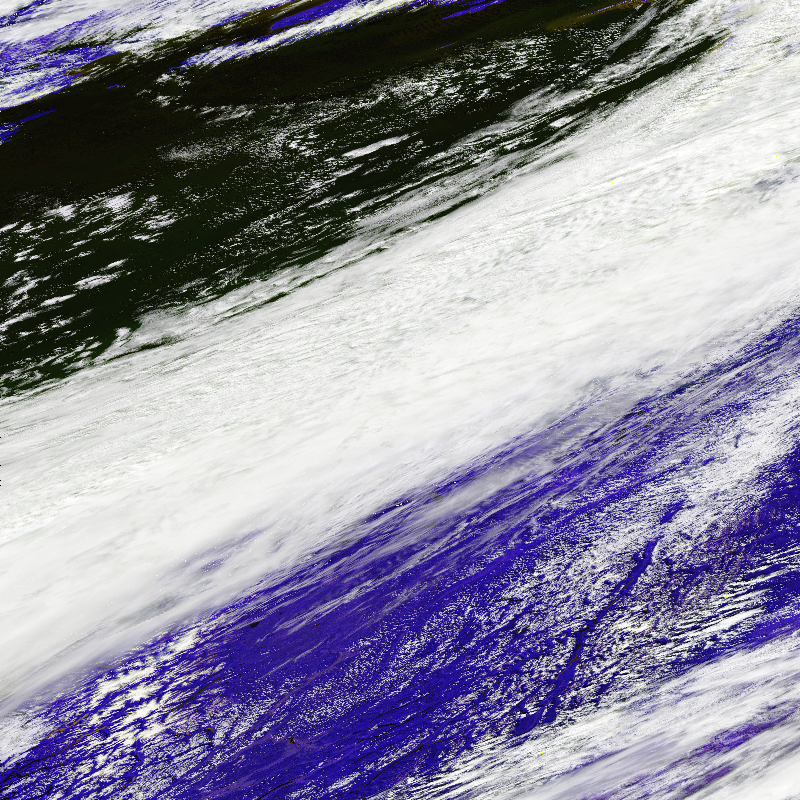
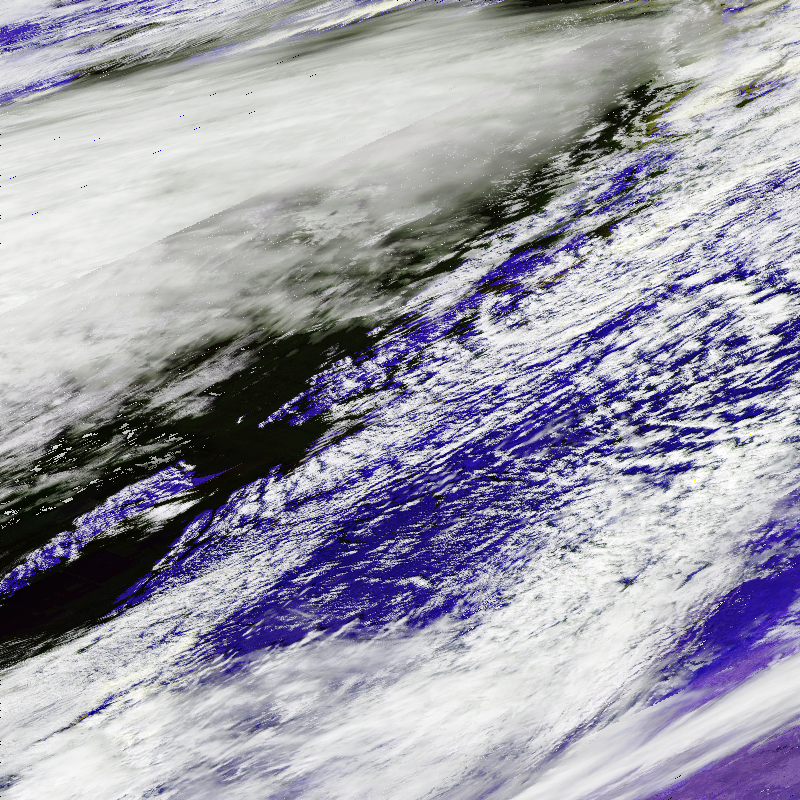
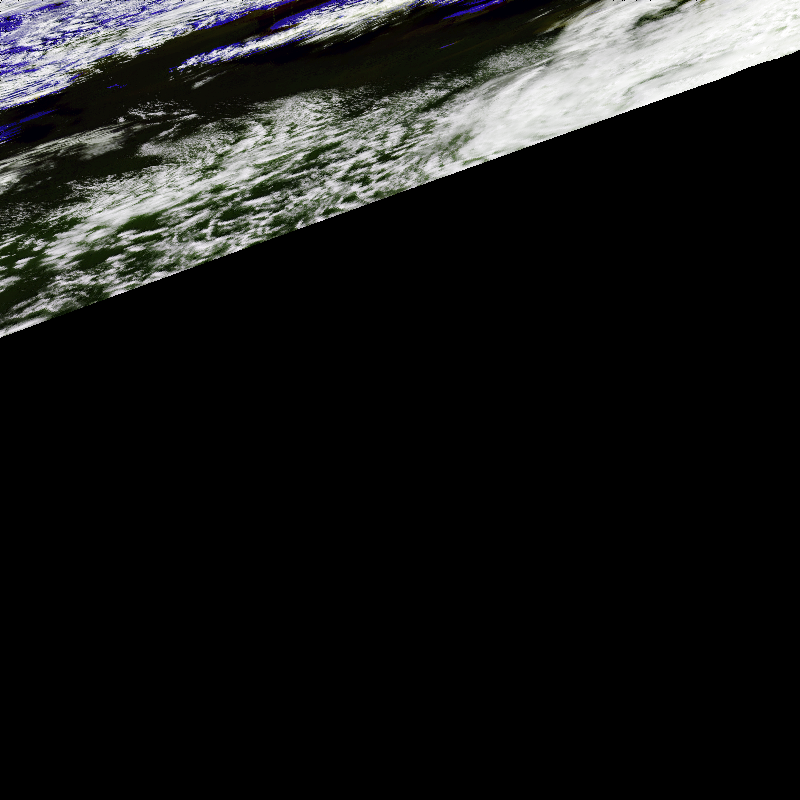
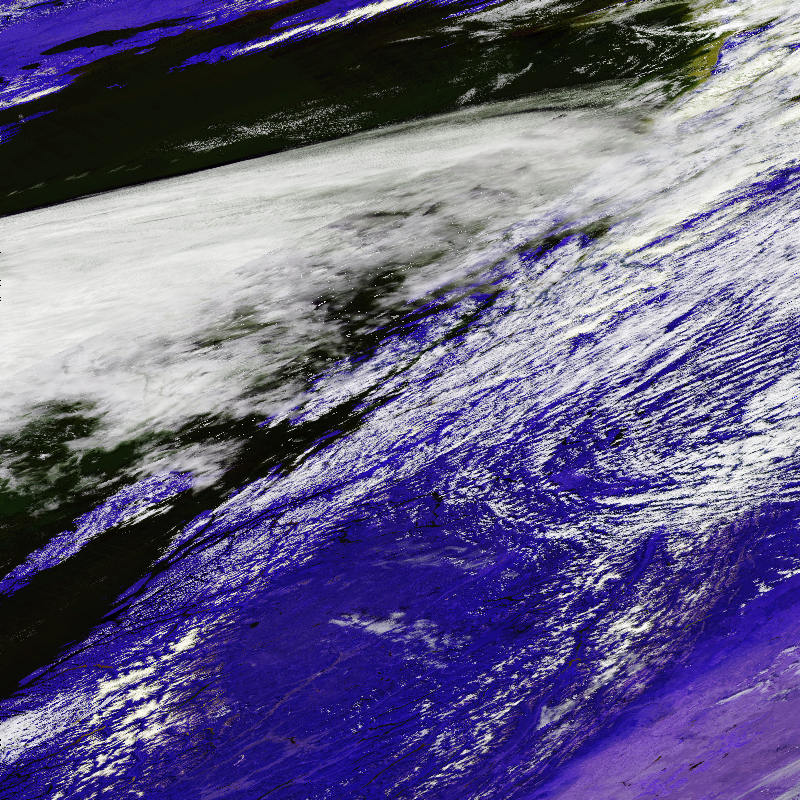
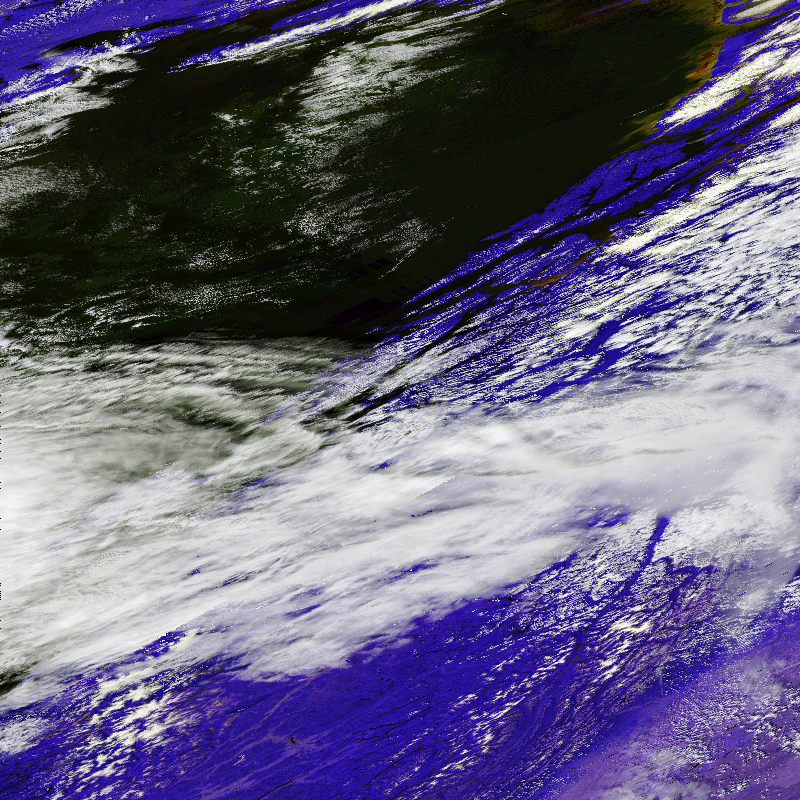
False color composite for MODIS bands RGB=432
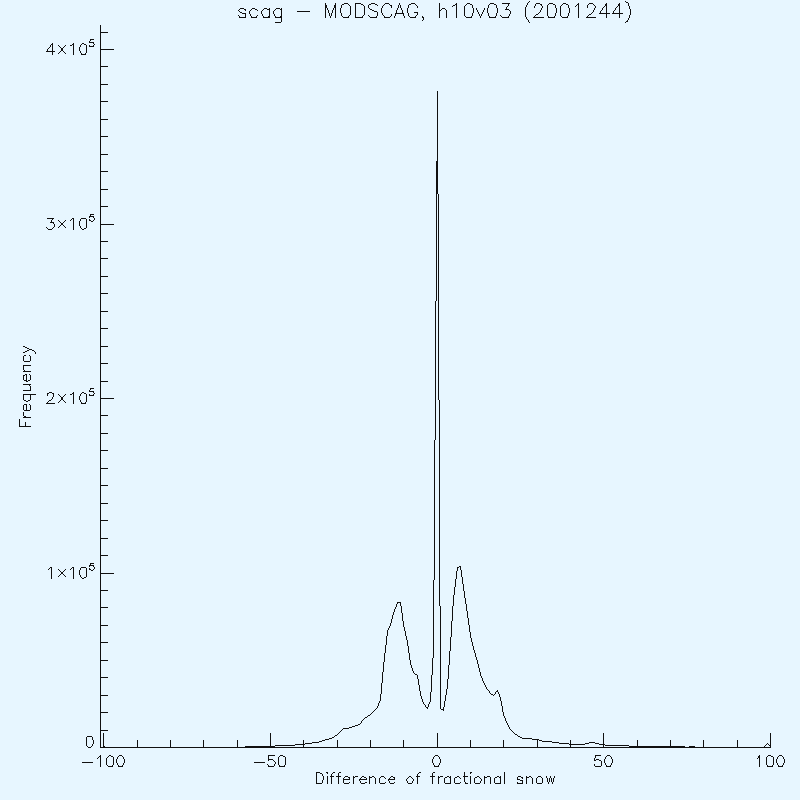
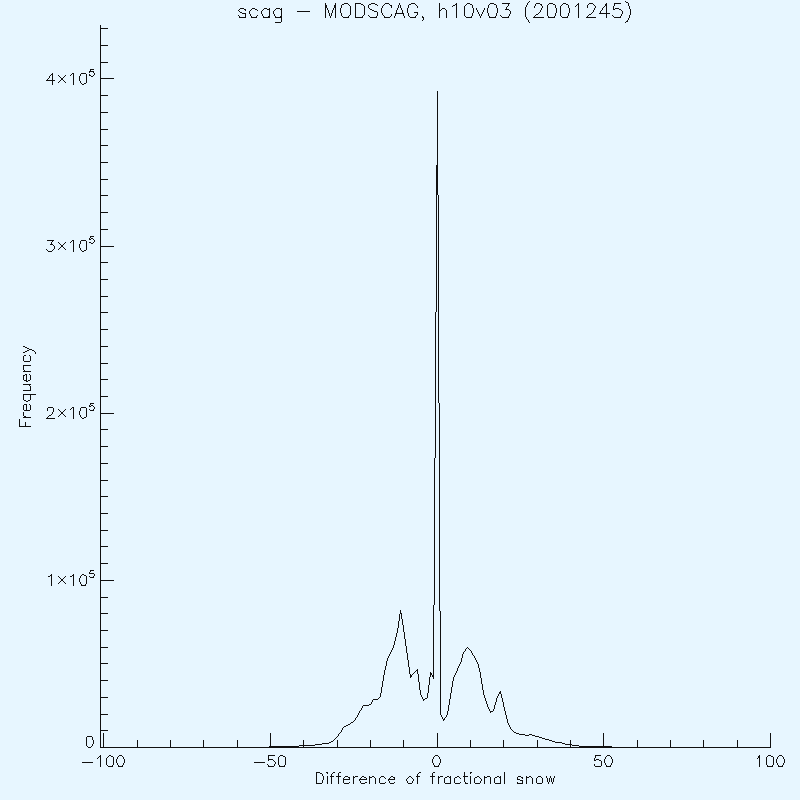
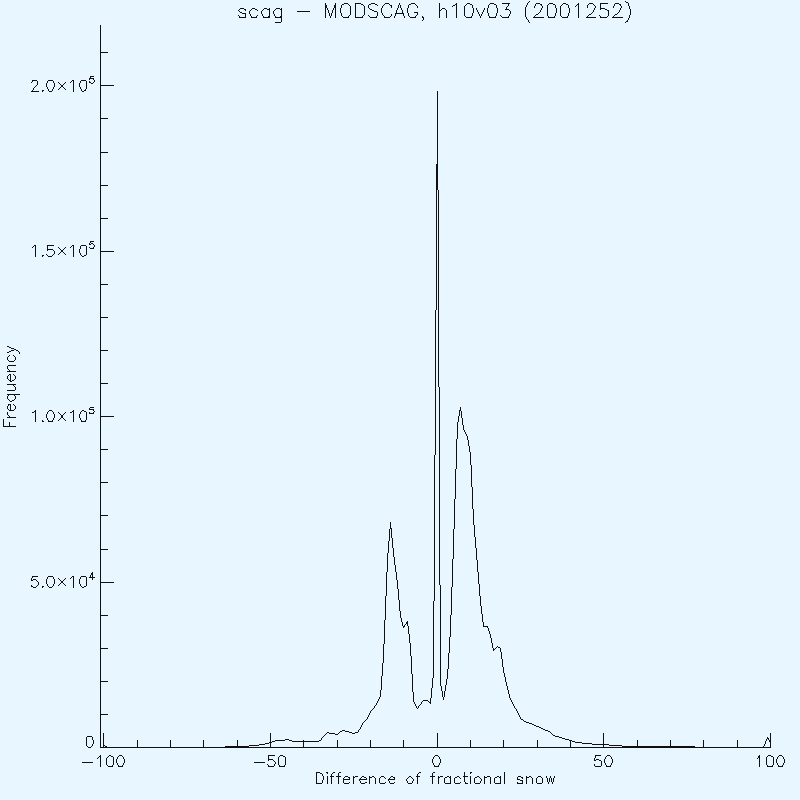
Difference histogram (ignores pixels where scag=-0.01)
Compare to original comparison from last February. There are differences between this scag output and last Feb's output (see in particular upper left corner of tile).
NOHRSC scag processing is multi-threaded. I ran it on snow, using 4 of 8 processors. The average time to process a complete tile with MODSCAG used to be 11 hours; scag is taking about 40-50 minutes.
email w/Painter, 2010-08-12: Tom thinks the differences between
original MODSCAG and new scag are the result of a bug that NOHRSC
fixed. Before, whenever the first 3-endmember solution was reached,
it was retained, no matter what later results found. He thinks this
is good, that the differences look like this.
(Click on any panel to see full resolution version. In the new window, if your browser displays a plus sign in a circle, click again for even more detail)
| Date |
Original MODSCAG output and NOHRSC scag output |
scag - MODSCAG image |
MODIS refl432 = RGB |
scag - MODSCAG histogram |
| 2001244 (Sept 1) |
 |
 |
 |
 |
| 2001245 (Sept 2) |
 |
 |
 |
 |
| 2001246 (Sept 3) |
 |
 |
 |
 |
| 2001247 (Sept 4) |
 |
 |
 |
 |
| 2001248 (Sept 5) |
 |
 |
 |
 |
| 2001249 (Sept 6) |
 |
 |
 |
 |
| 2001250 (Sept 7) |
 |
 |
 |
 |
| 2001251 (Sept 8) |
 |
 |
 |
 |
| 2001252 (Sept 9) |
 |
 |
 |
 |
M. J. Brodzik <brodzik@nsidc.org>