Summary

Aseismic creep occurs in the uppermost 5 km of the Hayward fault, faster in the south (6-9 mm/yr) than in the north (5 mm/yr).

Alignment arrays ( named locations on the map) indicate that the creep process is centered on the surface fault and is manifest as discrete slip on surface cracks within a shear zone 5-50 m wide. Since the apertures of the creep-meters are 15 m they measure most, but not all of, the total creep-signal at each location.

The mean creep rates in mm/yr since 1993-5 when the creepmeters were first installed are :

Pinole Park cpp 4.93

Temescal Park ctm 3.3

Oakland Zoo coz 2.4

Palisades St. chp 4.7

Fremont cfw 6.6

Rate changes have occurred at the times of local microseismicity near Oakland and Berkeley which have caused creep events with amplitudes of up to 5 mm, and with durations of weeks to months. These signals are most easily discerned in the detrended data opposite.

The data record seasonal variations (noise) caused by surface temperature changes that exceed 3 mm at annual periods in Pinole, Oakland and Hayward. These seasonal signals are much attenuated in Temescal Park where bedrock is close to the surface. The attachment systems at each location consist of helical piles driven 5-10 m into the Bay Area muds.


* Data file 2010-2012

text file with 6 columns column1:dd/mm/yyyy space HH:MM:SS

data columns - mm to 3 decimal places


Hayward Fault Creep

for creep in southern California click here

durmid coDU

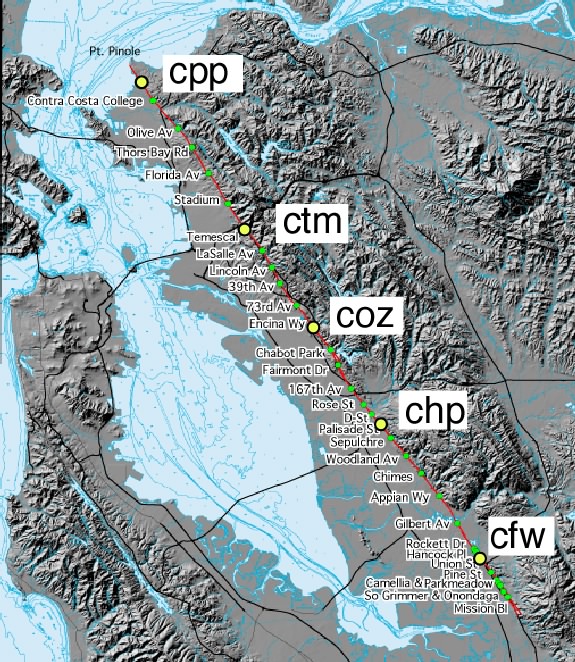
Click on one of the five creepmeters to view creep history or to download numerical data. Details.

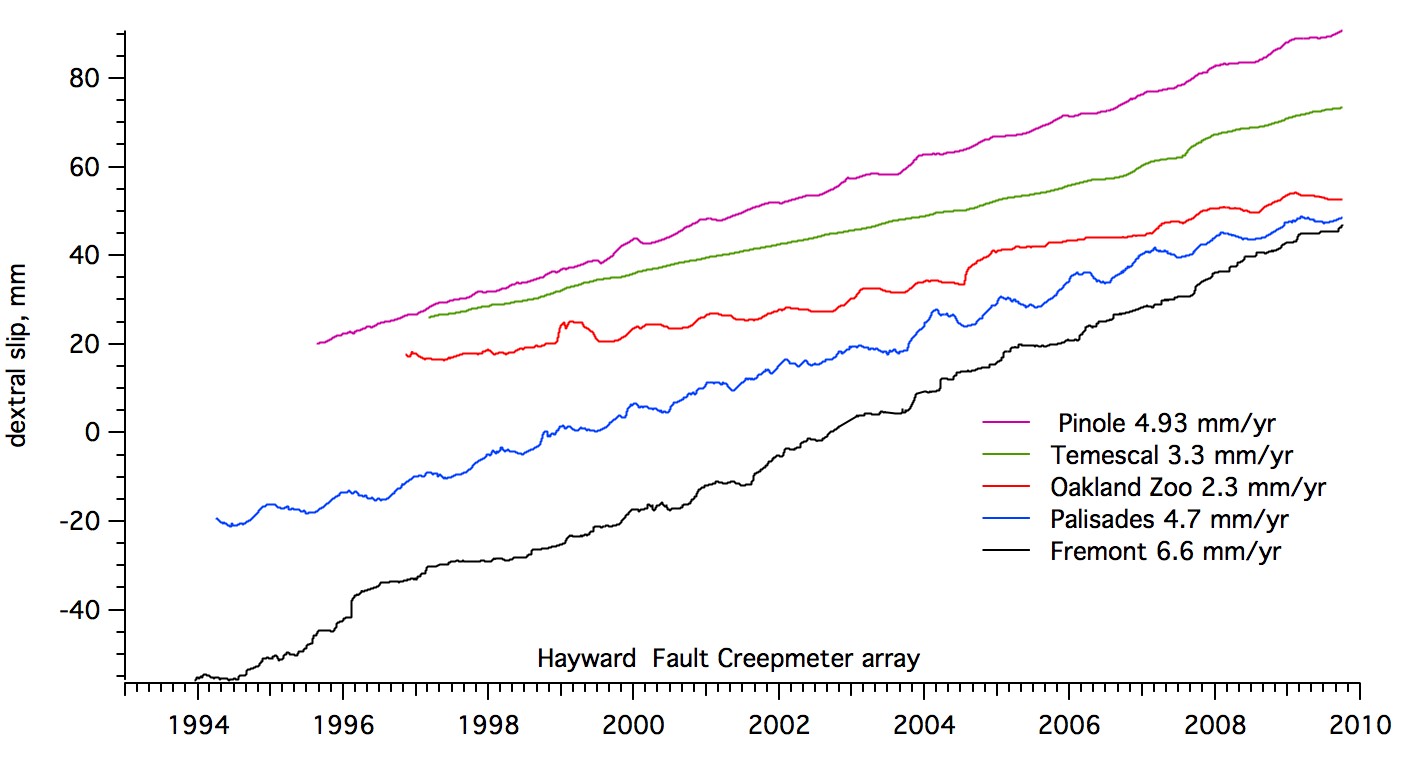
Cumulative Creep jpg pdf

cumulative creep

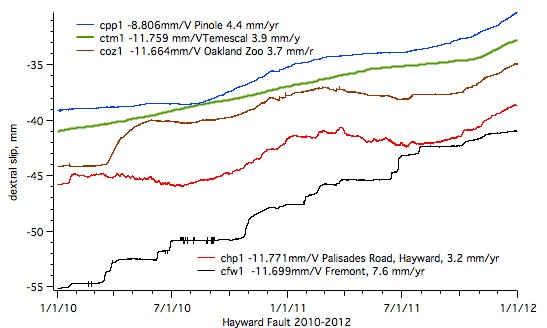
Creep 2010-2012 jpg pdf data*

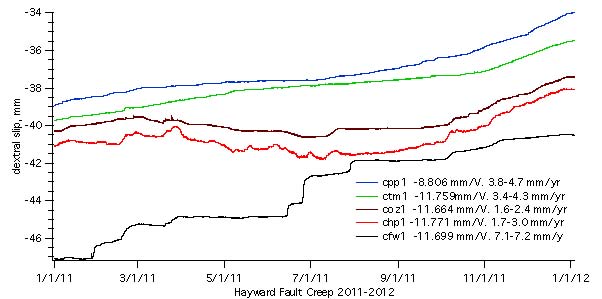
Creep 2011-2012 jpg pdf

Creep 2010-2011 jpg pdf

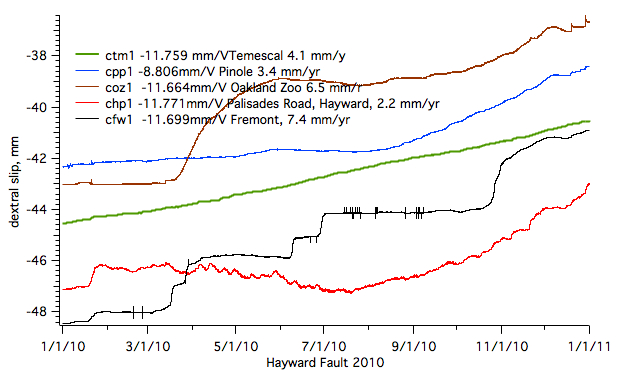
The 4 mm creep event at Oakland Zoo in 2010 is similar in ampliude and duration to one that occurred 2004/5.