Origin Time 03:16 GMT Location 23.399N 70.316E Magnitude7.6Ms Depth 17 km
26 January 2001 Bhuj earthquake, Gujarat, India
Geodetic data from the epicentral region acquired in February were remeasured by CMMACS, Bangalore and CU Boulder, in July 2001 to reveal postseismic displacements of roughly 1 mm/month. Coseismic displacements at a dozen historical monuments of the Great Trigonometrical Survey of India have been interpreted in terms of subsurface rupture geometry and slip (SriDevi et al, 2003). Aftershock data suggest a 45-50° south-dipping fault at depth (9-40 km).
The Mw7.6 Bhuj earthquake that shook the Indian Province of Gujarat on the morning of January 26, 2001 (Republic Day) is one of the two most deadly earthquakes to strike India in its recorded history. One month after the earthquake official Government of India figures place the death toll at 19,727 and the number of injured at 166,000. Indications are that 600,000 people were left homeless, with 348,000 houses destroyed and an additional 844,000 damaged. The Indian State Department estimates that the earthquake affected, directly or indirectly, 15.9 million people out of a total population of 37.8 million. More than 20,000 cattle are reported killed. Government estimates place direct economic losses at $1.3 billion. Other estimates indicate losses may be as high as $5 billion.
An informative assesment of damage has been assembled by the Indian Institute of Technology, Kanpur, and EERI. Some historical structures that survived the 1819 earthquake have been destroyed in the 2001 earthquake. Despite the complete collapse of some multistory concrete buildings in moderately shaken regions many structures remain intact, indicating that poor quality construction has aggravated the damage during this event. Within one week of the earthquake Ahmedabad police had registered 37 cases of culpable homicide and criminal conspiracy against builders, architects and engineers of buildings that collapsed in the earthquake.
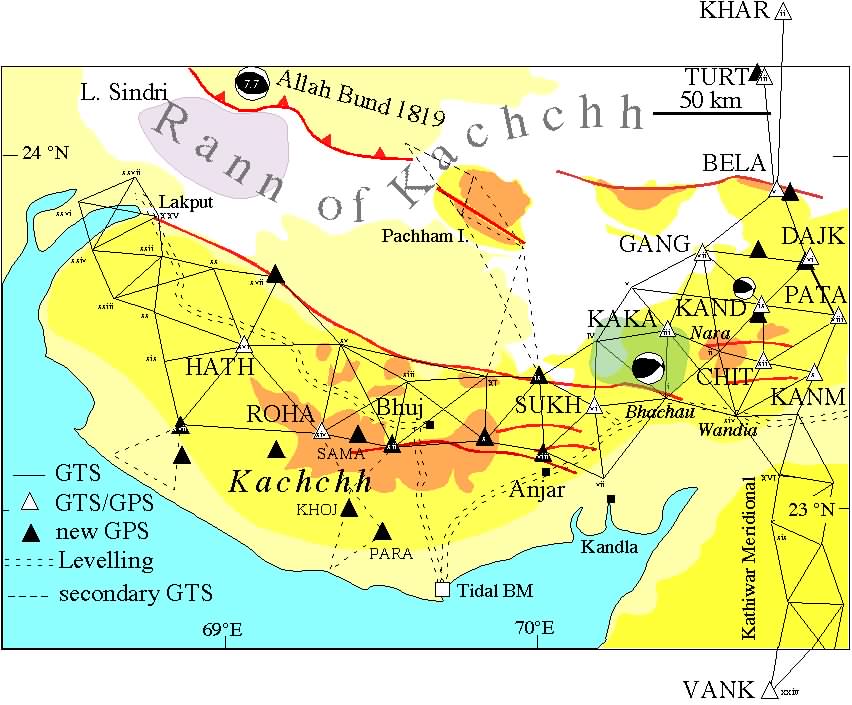
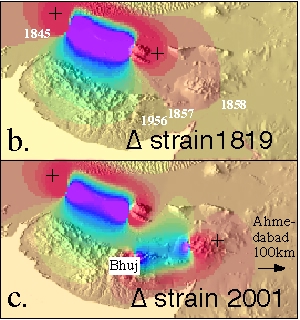
The above figure shows some of the faults mapped by Malik et al. (2000) and by Rajendran and Rajendran (2001) with mainshock and one large aftershock mechanism from USGS/NEIC. In 1819 a lake was formed south of the Allah Bund that remains a depression (Lake Sindri) that is flooded during the summer monsoon. The region has experienced above normal levels of microseismicity throughout the past 200 years, and probably for many millenia. Damaging earthquakes occurred in 1845, 1846, 1856, 1857, 1869 and 1956 in the same general region as the 1819 and 2001 earthquakes. Vertical deformation in 1819 reached 6 m and in 1956 , 1 m. The figure below (b) shows how dilatational (volume) strain accompanying the 1819 earthquake may have loaded contiguous regions resulting in subsequent earthquakes, including the 2001 event, and how the region of loading (+)has now moved eastward.
The earthquake occurred far from the edge of the Indian Plate and quite close to a M=7.7 earthquake that occurred in 1819 . The 2001 felt region extends from Madras to Kathmandu, just as it did in the 1819 earthquake (see isoseismal section below). Damage reports from Bhuj and Anjar are distressingly similar to the damage reports of the 1819 earthquake when fewer than 2000 were killed. The population of Kachchh is now many times greater than in 1819 but the percentage of the local population killed is roughly the same, despite the implementaion of a seismic resistant building code.
FIELD REPORTS Power was disrupted on the night of the earthquake extinguishing city lights in the epicentral region.
Preliminary seismic data from an aftershock array suggest a south dipping thrust with a surface projection near 23.8°N near the central Rann of Kachchh. Aftershocks are unusually deep (up to30 km). It would appear that the earthquake may have severed the lithosphere.
No surface rupture -- A neotectonics team (Seeber, Rockwell and Wesnousky) report a number of minor en-echelon cracks but no significant scarp. EERI investigators report an east-west belt of intense surface cracking presumably associated with a subsurface rupture. A 2 km long approximately east-west zone of intense deformation reported at N 23° 20' 30.4" E 70 11' 40.1" to N 23 20' 30" E 70 11' 53.9" by Oyo scientists, corresponds to the zone of catastrophic lateral spreading reported by the EERI team These observations are reconciled in an explanation by Bill Lettis. The bulge-like deformation near this feature may be similar in structure to that which occurred in the 1819 event. An alleged 1.3 m scarp previously reported north of Bhuj is interpreted as a slump feature in river alluvium.
Liquefaction -- On 4 February liquefaction phenomenon were reported by hydrologists and by local villagers, with an indication that the flow was sufficient in some cases to activate desert rivers that have been dry for more than a century. Widespread liquefaction was confirmed by SPOT imagery and by field observation (5 Feb.). Many mud-volcanoes in the Rann of Kachchh have dimensions of hundreds of meters: one covers a 5 km diameter stretch of the southern Rann with dark sand and mud. Numerous ancient river channels have been illuminated by a pock mark pattern of sand vents, and some have clearly flowed, and breached their old channels.
Isoseismal Intensities are being investigated by several groups of scientists in India. The importance of these data is that it will be possible to estimate the attenuation of acceleration across the Indian craton for the first time from a large well-calibrated earthquake. These data may then be used to examine data from historic Indian earthquakes (see, for example, Ambraseys and Bilham, 2000) and to revise their estimated magnitudes. Sue Hough (USGS, Pasadena) and Stacey Martin have compiled perceived intensity data from the 1819 and 2001 earthquakes which will be refined as further data are reported. These intensity maps already show several interesting features. The distribution of strong-motion accelerometers in India is not as dense as one would like for this exceptional earthquake, but is probably adequate to to calibrate the FSK or Modified Mercalli scale relative to physical ground accelerations.
Aftershocks were frequent in 1819 and in 1844-45 attaining intensities sufficient to cause alarm for 1 month after these earthquakes, and sufficent to be felt for several years. Numerous aftershocks exceeding Ms=5 have been reported by Indian seismologists, and one aftershock approached Ms=6. A subset of these aftershocks are plotted on the map above. It is likely that aftershocks will occur throughout 2001 in Gujarat with diminishing intensity. Aftershocks currently outline an ENE trending south-dipping thrust (45°-50° dip) to great depths (20-30 km).
The neotectonic GEOLOGY of Kachchh (Malik et al. 2000) consists of a series of folds and faults with a general WNW/ ESE trend. A morphological analysis suggests that the entire Kachchh system may be an thrust and fold belt. An early geological map of Kachchh (Wynne 1872) shows most of the significant faults. The fault that ruptured on 26 January appears to lie on the southern edge of the Rann of Kachchh north of Bhuj. Several mapped faults follow the low hills that are bordered by this salt waste. The figure below illustrates a series of ancient grabens in the Kachchh region. The locations of the 1819 and 1956 ruptures are reasonably well located, but the location of the 2001 rupture is currently approximate. The strike of the 1819 event parallels fold axes within the Kutch Graben which is currently in a state of compression from India/Asian collisional stresses (arrows below)
GEODESY The first order Survey of India Cutch Coast Series and Kathiwar Meridional Series were first measured in 1856. Some of these points were occupied by first order leveling in 1880 . The leveling line was remeasured in the 70's to reveal uplift of 1 m associated with the Anjar 1956 earthquake. Two immediate targets are to estimate the co-seismic strain-field by occupying these historic points, and to measure the viscous response of the lower crust and upper mantle over the next decade.
Preliminary mechanisms from Tokyo suggest that the fault that slipped may have been the southern boundary fault system to the Kutch Graben with a strike N30E rather than N30W as depicted below. Maximum slip is estimated to be 6.2 m. These solutions have similar strike to those in the UNIVERSITY OF TOKYO special event page
USGS solutions and Harvard CMT solutions, however, favor a N30W strike, parallel to the mapped faults in the southern Rann of Kachchh.
Kanpur IIT Dept of Engineering
Damage to historical monuments