CIRES and Dept. of Geol. Sciences, Campus Box 216, University of Colorado at Boulder, Boulder Colorado, 80309-0216
Department of Geosciences, Princeton University, Princeton, NJ 08544-1003
Submitted, March, 1997
Revised, November, 1997
Published JGR v. 103, 10065-10090, 1998
N.B.: Clicking on images gets a larger version of the same figure
Over 100 teleseisms (30° to 100° distance) were recorded from July to October, 1993 by mixed broadband and short-period seismic arrays at Mineral King (MK) and Horseshoe Meadow (HM) in the southern Sierra Nevada and at Darwin Plateau (DP) between the Inyo and Argus ranges. These arrays permit identification and separation of direct P and S arrivals, reflections from topography, scattered energy, and arrivals from different backazimuths (multipath arrivals). P-to-S conversions can be identified from beamed broadband or short-period seismograms. Least-squares time-domain processing recovered single-event receiver functions from the radial component beam by deconvolving the vertical component beam for 21 well distributed events. Converted phases attributable to the Moho are generally clear and uncomplicated at DP; Ps-P times of 3.9-4.2 s correspond to crustal thicknesses of 31-33 km, assuming a mean P crustal velocity of 6.2 km/s and a Poisson's ratio (n) of 0.255. Ps-P times at HM (eastern Sierra) are 3.9-4.6 s (32-37 km) excepting some unusual seismograms from events at backazimuths of 225-239°. MK (western Sierra) times for Ps-P show a strong E-W asymmetry: 3.9-4.1 s (31-33 km) from the east, and 4.8-5.3 s (39-42 km) from the west. The MK arrivals from the east are multiple and substantially weaker by comparison with HM and DP. These results confirm the absence of a thick crust under the southern High Sierra inferred from both a refraction experiment coincident with this experiment and some earlier studies.
At DP the simple, strong Moho event is associated with an earlier intracrustal negative-polarity event defining the top of an S-wave low velocity zone. This feature dips west under the Sierran crest at HM, but is absent farther west at MK. This feature appears to be a manifestation of extensional strain and thus indicates that the surficially undeformed Sierra overlies a tectonized lower crust. Sub-Moho energy is absent under the Basin-and-Range (DP), but is conspicuous under the high Sierra at positive arrivals ~7.3 s (MK) and ~9 s (HM) after the P. These arrivals might be from the base of a low-velocity, low-density upper mantle body supporting the Sierra. Excellent Moho Ps arrivals demonstrate the general lack of large pods of crustal magma except under the Golden Trout volcanic field.
The seismic structure of the Sierra Nevada and the adjoining region has produced a basic puzzle. Gravity observations require the presence of a large low-density body-an isostatic root-in the crust or upper mantle to support the modern elevation of the range [e.g., Oliver and Robbins, 1982; Oliver, 1977]. Several previous seismic observations indicated that the Sierra might have a thick crustal root that supports the >2800m average elevation of the range [Byerly, 1938; 1939; Eaton, 1966; Pakiser and Brune, 1980]. Because the last major crustal accretion event apparent at the surface is the Mesozoic volcanic arc that constructed the Sierra Nevada batholith [e.g., Bateman and Wahrhaftig, 1966; Bateman and Eaton, 1967; Bateman, 1992], a paradox developed that required reconciliation of the inferred late Cenozoic uplift of the range [e.g., Lindgren, 1911; Huber, 1981; 1990; Jones, 1987, and references therein; Unruh, 1991] with the presumed Mesozoic thickening of the Sierran crust. Two main solutions have been presented:
(1) a crustal root was formed in the Mesozoic and stayed out of isostatic equilibrium through most of Tertiary time due to the strength of the lithosphere in the vicinity of the Sierra [Chase and Wallace, 1986; Chase and Wallace, 1988], and
(2) the modern isostatic root was created in the late Cenozoic, perhaps in the crust or more likely in the mantle [Carder, 1973; Crough and Thompson, 1977; Jones, 1987; Jones et al., 1994], in connection with the extension of the southern Basin and Range. This interpretation arose in part from other seismic observations inconsistent with a thick crust [Carder et al., 1970; Carder, 1973; Jones et al., 1994].
A different geohistory proposed (with some minor differences) by Wernicke et al. [1996] and Small and Anderson [1995] suggests that the mean elevation of the Sierra has not increased in the past 10 m.y. as has commonly been inferred from geologic evidence; this solution demands a reexamination of the geologic evidence constraining the timing of the origin of the mass deficit presently under the Sierra. Structurally this could be compatible with the timing or placement of the isostatic root from either (1) or (2).
Associated with these hypotheses that explain the isostatic support of the range are different histories of deformation of the lowest crust and uppermost mantle. The older view was that the range lacked any internal Cenozoic deformation; the sub-Sierran Moho would simply be a relict of that produced by the great Mesozoic volcanic arc that created the Sierran batholith. Creation of buoyancy in the upper mantle might produce some changes in the Moho, though one earlier view did not require any real change in the lowest crust or Moho [Mavko and Thompson, 1983; Crough and Thompson, 1977]. Speculation on the association of the late Cenozoic history of the Sierra with the extensional deformation of the Death Valley region has suggested that the Moho under the Sierra might be a zone of pervasive shear with removal of lower crust and emplacement of magma [Wernicke, 1985; 1992; Walker and Coleman, 1991; Jones, 1987; Jones et al., 1992; 1994].
Other Cenozoic events not linked to the uplift of the Sierra could have had profound impacts on the deep structure of the range. Low-angle early Cenozoic subduction has been inferred from the cessation of activity in the Mesozoic volcanic arc in the Sierra Nevada, the presence of early Tertiary volcanism to the east, the Laramide orogeny east of the Mesozoic Sevier fold-and-thrust belt, and cooling of the crust in the Sierra and some areas to the east [e.g., Bird, 1984, and references therein; Bird, 1988; Dumitru, 1990; Dumitru et al., 1991]. It has been suggested that this slab was in contact with the base of the crust under the Sierra [Bird, 1984; 1988; Dumitru, 1990; Dumitru et al., 1991], although this view has been disputed [Perry and Livaccari, 1994; Bird, 1994; Livaccari and Perry, 1993]. If the modern Moho is the unmodified remains of an early Tertiary subduction zone, it should dip to the east. Changes through time in the bulk mineralogy of the upper mantle and lower crust could have shifted the Moho in response to changes in conditions in the lower lithosphere; Ducea and Saleeby [1996] have suggested that the seismic Moho shallowed during the early Tertiary as the mafic base of the Sierra batholith was converted to eclogite.
To address this problem, the Southern Sierra Nevada Continental Dynamics Project (SSCDP) was conducted in and around the southern Sierra during 1993 [Park et al., 1995; Wernicke et al., 1996]. This experiment included major wide-angle reflection/refraction profiling [Fliedner et al., 1996; Ruppert et al., 1994; Ruppert et al., 1998], new gravity measurements, petrologic and geochemical examination of xenoliths [Ducea and Saleeby, 1996] and magnetotelluric measurements [Park et al., 1996] as well as the deployment of 3 arrays of seismometers across the Sierra for four months in 1993 (this paper) (Figure 1).
Figure 1. (a) Location map of the passive arrays deployed in 1993 in the southern Sierra Nevada and vicinity as part of the SSCD project.
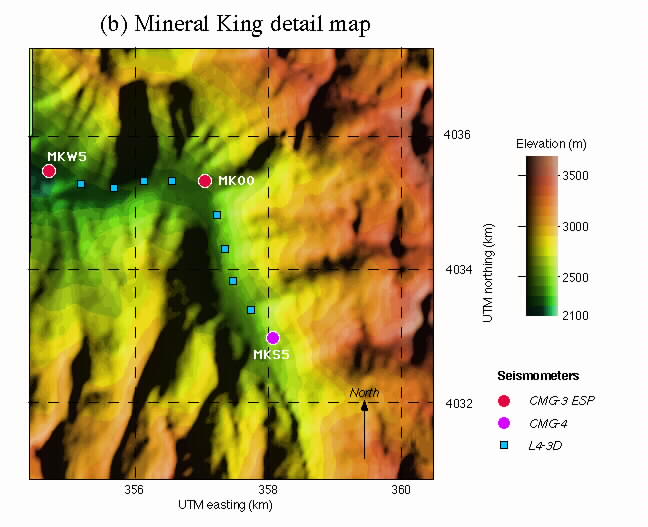

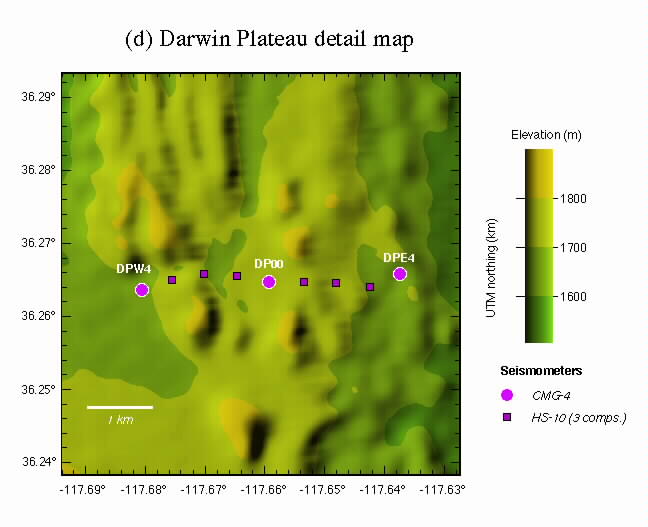
Figure 1 (b-d). Detail maps of the three arrays illustrating the relative locations of the seismometers and their position in relation to local topography shaded with illumination from the WNW.
We present results from the passive seismic array deployment in 1993 in the southern Sierra. These arrays recorded data continuously, recording teleseisms, regional, and local events. This paper describes results from analysis of the waveforms of teleseismic P arrivals. The sequence of mode conversions [Ps], from near-horizontal interfaces in the top ~100 km yields a pseudo-depth section below the array. Deconvolution of the radial component seismogram produces the so-called "receiver function" [Langston, 1977], an approximation to this section. The use of 3-component arrays permits the use of short period sensors to obtain short-period (~1 Hz) receiver functions by beamforming; additionally, it is possible to obtain useful information about the polarization and backazimuth of the signals which form the P-coda, thus providing additional empirical justification for the identification and interpretation of these signals.
Passive array teleseismic data complement traditional, more expensive wide-angle reflection/refraction profiling in several ways. Structures produced from teleseismic data are quite local to the array; refraction and wide-angle data entail much greater lateral ambiguity. Near-vertical incidence angles from teleseisms preclude shadowing of arrivals by low-velocity zones. The two methods provide a cross-check on the identification and localization of the Moho and other crustal interfaces. Receiver functions yield information primarily about S-wave velocity contrasts, thus leading to the possibility of inferring models of the crustal Poisson's ratio when combined with wide-angle reflection/refraction surveys. We do not attempt to infer Poisson's ratio from reverberations such as PpPms [e.g, Zandt and Ammon, 1995], because these phases are weak or inconsistent, due to the extreme surface topography.
The use of mode conversions, particularly the Ps conversion of teleseismic first arrivals, has been described in great detail elsewhere for use with single-station 3-component data [Phinney, 1964; Langston, 1977; 1979; 1989; Owens et al., 1984; 1987]. The most basic aspect of this phenomenon is that a P-wave incident to a discontinuity (such as the Moho) will produce a P and S wave (both transmitted (Pp, Ps) and reflected). Because the S-wave will travel more slowly than the P, the time difference in the arrival of the two phases Pp and Ps is a direct measure of the depth of the original interface.
In general, additional crustal multiple and converted phases are present. For horizontal interfaces, these arrive roughly three times later than the direct conversion (e.g., ~12 s after direct P when the Moho Ps arrives at about 4 s). However, for this experiment, these are not considered because (1) the time interval being analyzed, from 0 to 6 seconds after P, is too early have Moho to surface reverberations; (2) bedrock is in every case a Mesozoic granitic pluton, and no strong upper crustal reverberation is expected; (3) the arrays with the most energetic P-codas are situated in extreme topography, where local scattering is important, but coherent reflection from the surface is minimized. The array processing specifically discriminates against this kind of undesirable signal.
This section describes briefly the processing scheme which proved most satisfactory. A more complete discussion of receiver function processing of data from small arrays is presented by Phinney and Jones [1997]. The processing adopted is quite similar to the processing used in multichannel reflection seismology. This similarity is not accidental, for the Ps conversions bear a close theoretical relationship with the back-reflected P signals observed in reflection seismology.
Arrays: The three arrays deployed across the Sierra and adjacent Basin and Range (Figure 1; Table 1) combined short period (1 s free period) and broadband (20 or 30 s) three-component seismometers with a nominal interstation spacing of 500 m. Both the Mineral King (MK) and Horseshoe Meadow (HM) arrays used 3 broadband and 8 short period seismometers in an "L" shaped array (Figure 1c,d). The Darwin Plateau (DP) array combined 3 CMG-4 broadband sensors with 6 three-component HS-10 1 s seismometers (Figure 1b). Each instrument recorded ground motion continuously at a sampling rate of 20 samples per second. Instruments were deployed from July to October of 1993. The archive of continuous data from these arrays has been deposited with the IRIS Data Management Center.
Response equalization: Owing to variations in the actual response of each instrument (particularly several underdamped L4 seismometers), an estimate of the true instrument response (parameterized as a damping constant and free period) was made from calibration pulses recorded in the field for each component of the L4 seismometers at HM and MK (Table A1[1]). Although no calibration signals could be obtained from the HS-10 instruments, these instruments seem well matched based on recordings made in a huddle test. To compare and stack seismograms from different instruments, the empirical instrument response was transformed to the nominal response for an L4 seismometer (damping of 0.7 and free period of 1.0 s). Trace amplitudes were balanced before stack using the RMS of the first 15 s after the P arrival.
Events analyzed: During the course of the experiment about 128 teleseisms with mb >= 5.0 were recorded by stations of these arrays. Of these, 21 were selected to be analyzed based upon the number of stations recording the event, the clarity of the signal, and the need for a broad geographic distribution (Figure 2; Table 2).
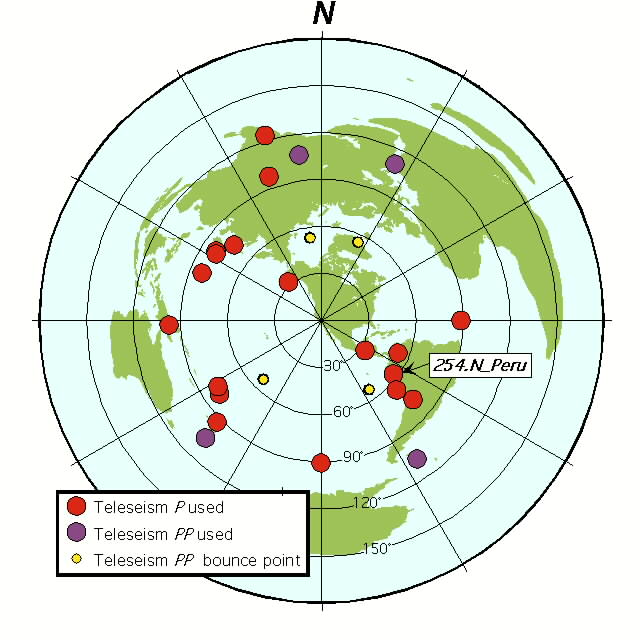 |
| Figure 2. Map of teleseisms used in this study (azimuthal equidistant projection); location information in Table 2. |
The short-period array records, when stacked into a beam, retain coherent mode conversions and suppress incoherent (locally scattered) energy. (Figure 3). Randall and Owens [1994], using a sparser array of broadband sensors, had concluded that coherent Ps could only be found at longer periods.
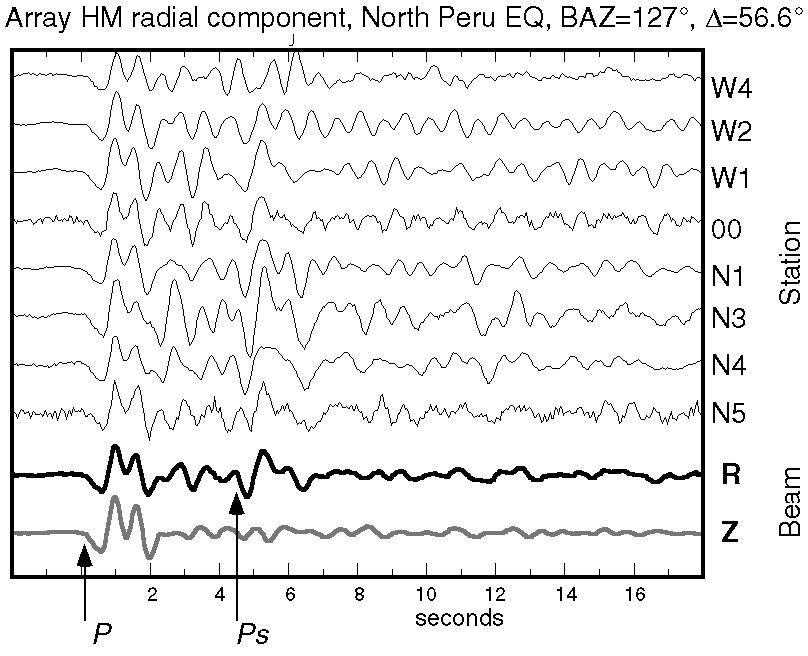
Figure 3. An example of the great improvement in coherent signal at short-period stations achieved by forming a beam (second trace from bottom) from the array of short-period stations at Horseshoe Meadow (HM) on the Sierran crest. This process enhances the desired signal from mode conversions relative to noise from scattering, local reflections and reverberations. The bottom beam is of the vertical components showing the simple nature of the direct P arrival. The only filtering of the short-period instruments is from the FIR anti-aliasing filter used in REFTEK dataloggers. Event 254_NPeru, BAZ 127°, [Delta]=56.6° (Fig. 2). Small bump between main Moho Ps and direct P is from the MCN (Mid-Crustal Negative) conversion.
The most prevalent method in use today for the analysis of mode conversions from the lithosphere utilizes "receiver functions" [Langston, 1977; 1979; 1989; Owens et al., 1984; 1987]. These are manipulations of original 3-component seismograms designed to emphasize the presence of P-to-S mode conversions. Deconvolving the vertical seismogram from the radial ideally produces a series of spikes, each representing the arrival of a mode conversion; this is the radial receiver function. A similar deconvolution of the vertical from the transverse component provides a measure of the adherence of the data to the assumptions of a laterally homogeneous, isotropic Earth; the presence of large signals on this transverse receiver function could be caused by a dip on interfaces at depth, by the presence of scattered energy, by seismic anisotropy, or by arrivals from out of the vertical plane connecting source and receiver. A mild variation also used here rotates the seismograms into L and H components [Vinnik, 1977], parallel to and perpendicular to the incident P motion, respectively, and lying within the vertical-radial plane.
Much work to date uses a deconvolution in the frequency domain; this has certain theoretical advantages but in practice tends to be somewhat unstable numerically [Ammon, 1992; Gurrola et al., 1995; but see comment by Sacchi and Ulrych, 1996]. For this work we use a modified version of the least-squares time-domain deconvolution developed by Abers et al. [1995] and similar to that employed by Gurrola et al. [1995]. As described in the Appendix, this formulation permits stable deconvolution of noisy short-period data and the propagation of uncertainties to the final receiver function, even through a 10 point (0.5 s) triangle-shaped smoothing operator applied to the final traces. The resulting uncertainties are used to evaluate the significance of arrivals on the receiver functions.
The radial receiver functions at a given array from various teleseisms must be compatible with a single unique subsurface structure. Since the structure normally has azimuthal and lateral variability under the array, and since the data from a single earthquake are carriers of scattered energy (noise) from unresolvable structure, it is necessary to work with a collection of teleseisms at each array, and to establish a convention for comparing and combining the receiver functions. This step falls into the class of transformations known as "migration" in reflection seismology. Because amplitudes of Ps conversions depend in a simple way on incidence angle [e.g., Ammon, 1991], the most basic conversion is to make a geometrical correction of each receiver function to a standard incidence angle. This correction is based on a horizontally layered model; in practice it will deal adequately with small dips, which produce the best-behaved signals.
The amplitude of the Ps conversion is nearly linear with the incidence angle of the P-wave at the interface for teleseismic incidence angles. To eliminate variations introduced by using earthquakes at different incidence angle, the Ps amplitude may be rescaled by multiplying by ir/i, where i is the true incidence angle and ir is a fixed, depth-invariant reference angle (taken to be 20° in this paper). The angle i is estimated by tracing the converted S-wave back down through the Earth within a reference structure approximating the seismic structure under the Sierra (Table 3). The depth of a boundary corresponding to a point in the receiver function is also determined during this backtracing of the Ps ray. Thus this processing maps receiver functions from measured amplitude versus time into functions of corrected amplitude versus depth; we term these later functions "migrated receiver functions"; they are identifiable through the replacement of the time axis with a depth or pseudodepth axis[2]. The corrected amplitude will be directly proportional to the S-wave impedance contrast at depth, assuming that the energy observed is a mode conversion from a planar interface.
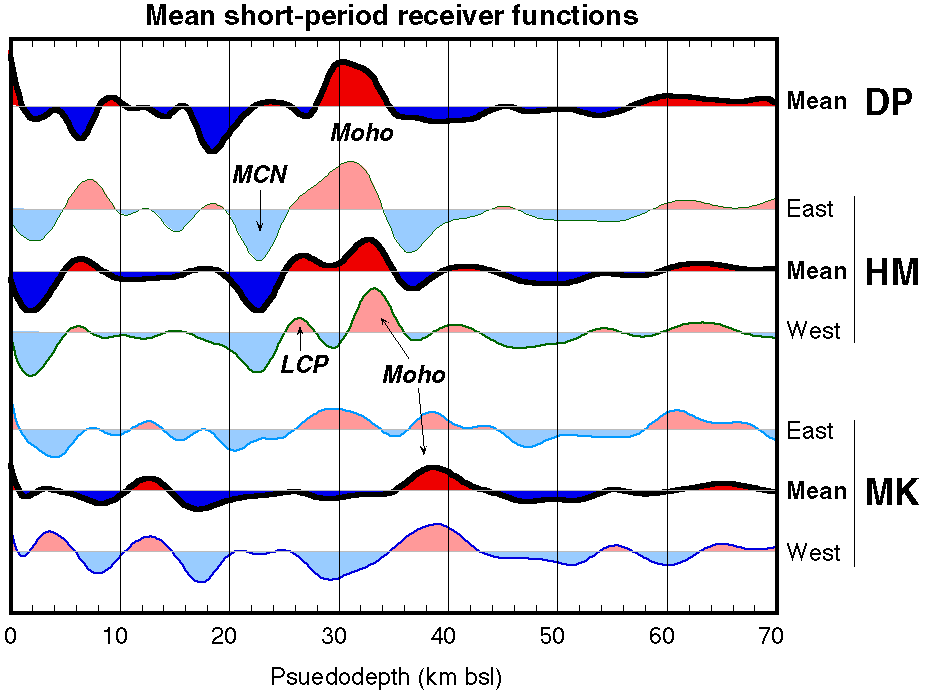
Interpreting these receiver functions (both migrated and unmigrated) is aided by using uncertainties propagated from the original beamed seismograms (Appendix). These uncertainties in turn are part of our evaluation of the likelihood that the receiver function accurately represents seismic structure along the raypath; this evaluation is formalized in our calculation of a Blunder Index (BI, Table 4) that provides some relative measure of the possibility that the receiver function has been contaminated with noise from a number of causes. We have used the BI in weighting individual receiver functions when generating means by site or backazimuth (Figure 4).
Figure 4. Mean short-period migrated receiver functions for all receiver functions at each array plus stacks separated into eastern and western backazimuths for MK and HM, all arranged from easternmost (top) to westernmost (bottom). Intracrustal conversions from inferred mid-crustal negative (MCN) and lower-crustal positive (LCP) velocity contrasts are indicated. Depths are determined assuming a simple 1-D velocity structure (Table 3). Amplitudes were normalized using this structure prior to summation. Each receiver function was weighted using the inverse square of the blunder index (BI, Table 4). Note depths are below sea level; thus the direct P is off the left edge of the plot.
Errors in the assumption of a laterally homogeneous, isotropic Earth will also distort the corrected receiver functions. The amplitudes from dipping interfaces will be improperly corrected and thus can overestimate, underestimate, or even incorrectly determine the polarity of the impedance contrast at a dipping interface. The presence of dipping interfaces or anisotropy always complicates the interpretation of receiver functions [Cassidy, 1992; Vinnik and Montagner, 1996]; by removing the differences in receiver functions caused by variations in incidence angle, we have made it easier to identify other differences that reflect dipping or anisotropic structure.
A single dipping interface yields timing and amplitude variations which are roughly sinusoidal in the backazimuth ([theta]) (Figure 5) [Cassidy, 1992; Langston, 1977]. The arrival is latest for rays from the down-dip direction and earliest for those from the up-dip direction; for dips exceeding the incidence angle to the interface, the radial component of the pulse can even reverse polarity. The polarization of the Ps wave remains linear although not remaining polarized along the great circle backazimuth. Assuming a positive (upwards) motion, the radial component displays greatest positive (away from source) motion for arrivals from the downdip direction .
Figure 5. Schematic illustration of the effects of different phenomena on amplitude and arrival times of converted arrivals. Diagrams show horizontal particle motions (bold lines) above the block diagram illustrating ray geometry. Note the difference in mean amplitude (zero vs. non-zero), differences in periodicity with backazimuth ([theta]), and the relatively small effect of crustal anisotropy on Ps arrival time variations. More complex patterns of amplitudes are possible with non-horizontal axes of anisotropy, including a 1-[theta] variation in amplitude [e.g., Levin and Park, 1997a]. The separation of effects of anisotropy into layer effects (splitting of the shear wave) and interface effects (P-SH conversions) is artificial but illustrates the relative role of thick anisotropic layers versus sharp boundaries of anisotropic material.
The tangential component receiver function is potentially a diagnostic of either of these effects or of less easily interpreted complications such as near-receiver scattering [e.g., Bannister et al., 1990; Gupta et al., 1990; Langston, 1989; Wagner and Langston, 1992] or multipathing/ray-bending [e.g., Steck and Prothero, 1993; Hu and Menke, 1992]. In general, we have found few azimuthally coherent signals on the transverse data and signal power which is usually less than on the radial. What signals are present and unattributable to scattering might be generated by plunging anisotropy [e.g., Levin and Park, 1997a]. In general it appears that the most robust discriminant for dipping structure is variation in timing of the radial Ps [Figure 5, Levin and Park, 1997b]; thus, as this paper focuses on the isotropic structure, we will defer examination of the tangential receiver functions to a later work (Jones et al., ms in preparation).
Ideally we would search for these patterns on individual seismograms, but the duration of the primary signal from most teleseisms causes the direct P to overlap with the conversions from within the lithosphere. Therefore we focus on using the receiver functions as though they were horizontal components of a seismogram. This interpretation is limited by artifacts associated with generation of the receiver functions, such as sidelobes from large pulses, but is probably superior to limiting ourselves to the few earthquakes with direct arrivals compact enough to permit direct examination of the converted arrivals.
Phinney and Jones [1997] present a more detailed discussion of the utility of the short-period arrays to isolate the converted phases interpreted below. Here we present the observations grouped by array, then the seismological parameters inferred from these observations, grouped by feature, and finally a geological integration of these inferences.
Simple weighted stacks of corrected receiver functions reveal the most robust aspects of lithospheric conversions (Figure 4). Weights are assigned by combining an estimate of S/N with an estimate of the presence or absence of energy discordant with transmission through a layered halfspace (BI; Table 4). The significant conversions observed are a positive conversion between 30 and 40 km psuedodepth interpreted as the Moho, a positive conversion near 26 km we call the lower crustal positive (LCP) conversion, and a negative conversion between about 16 and 24 km psuedodepth we term the mid-crustal negative (MCN) conversion. A less significant negative conversion near or above 6 km psuedodepth is termed the upper-crustal negative (UCN).
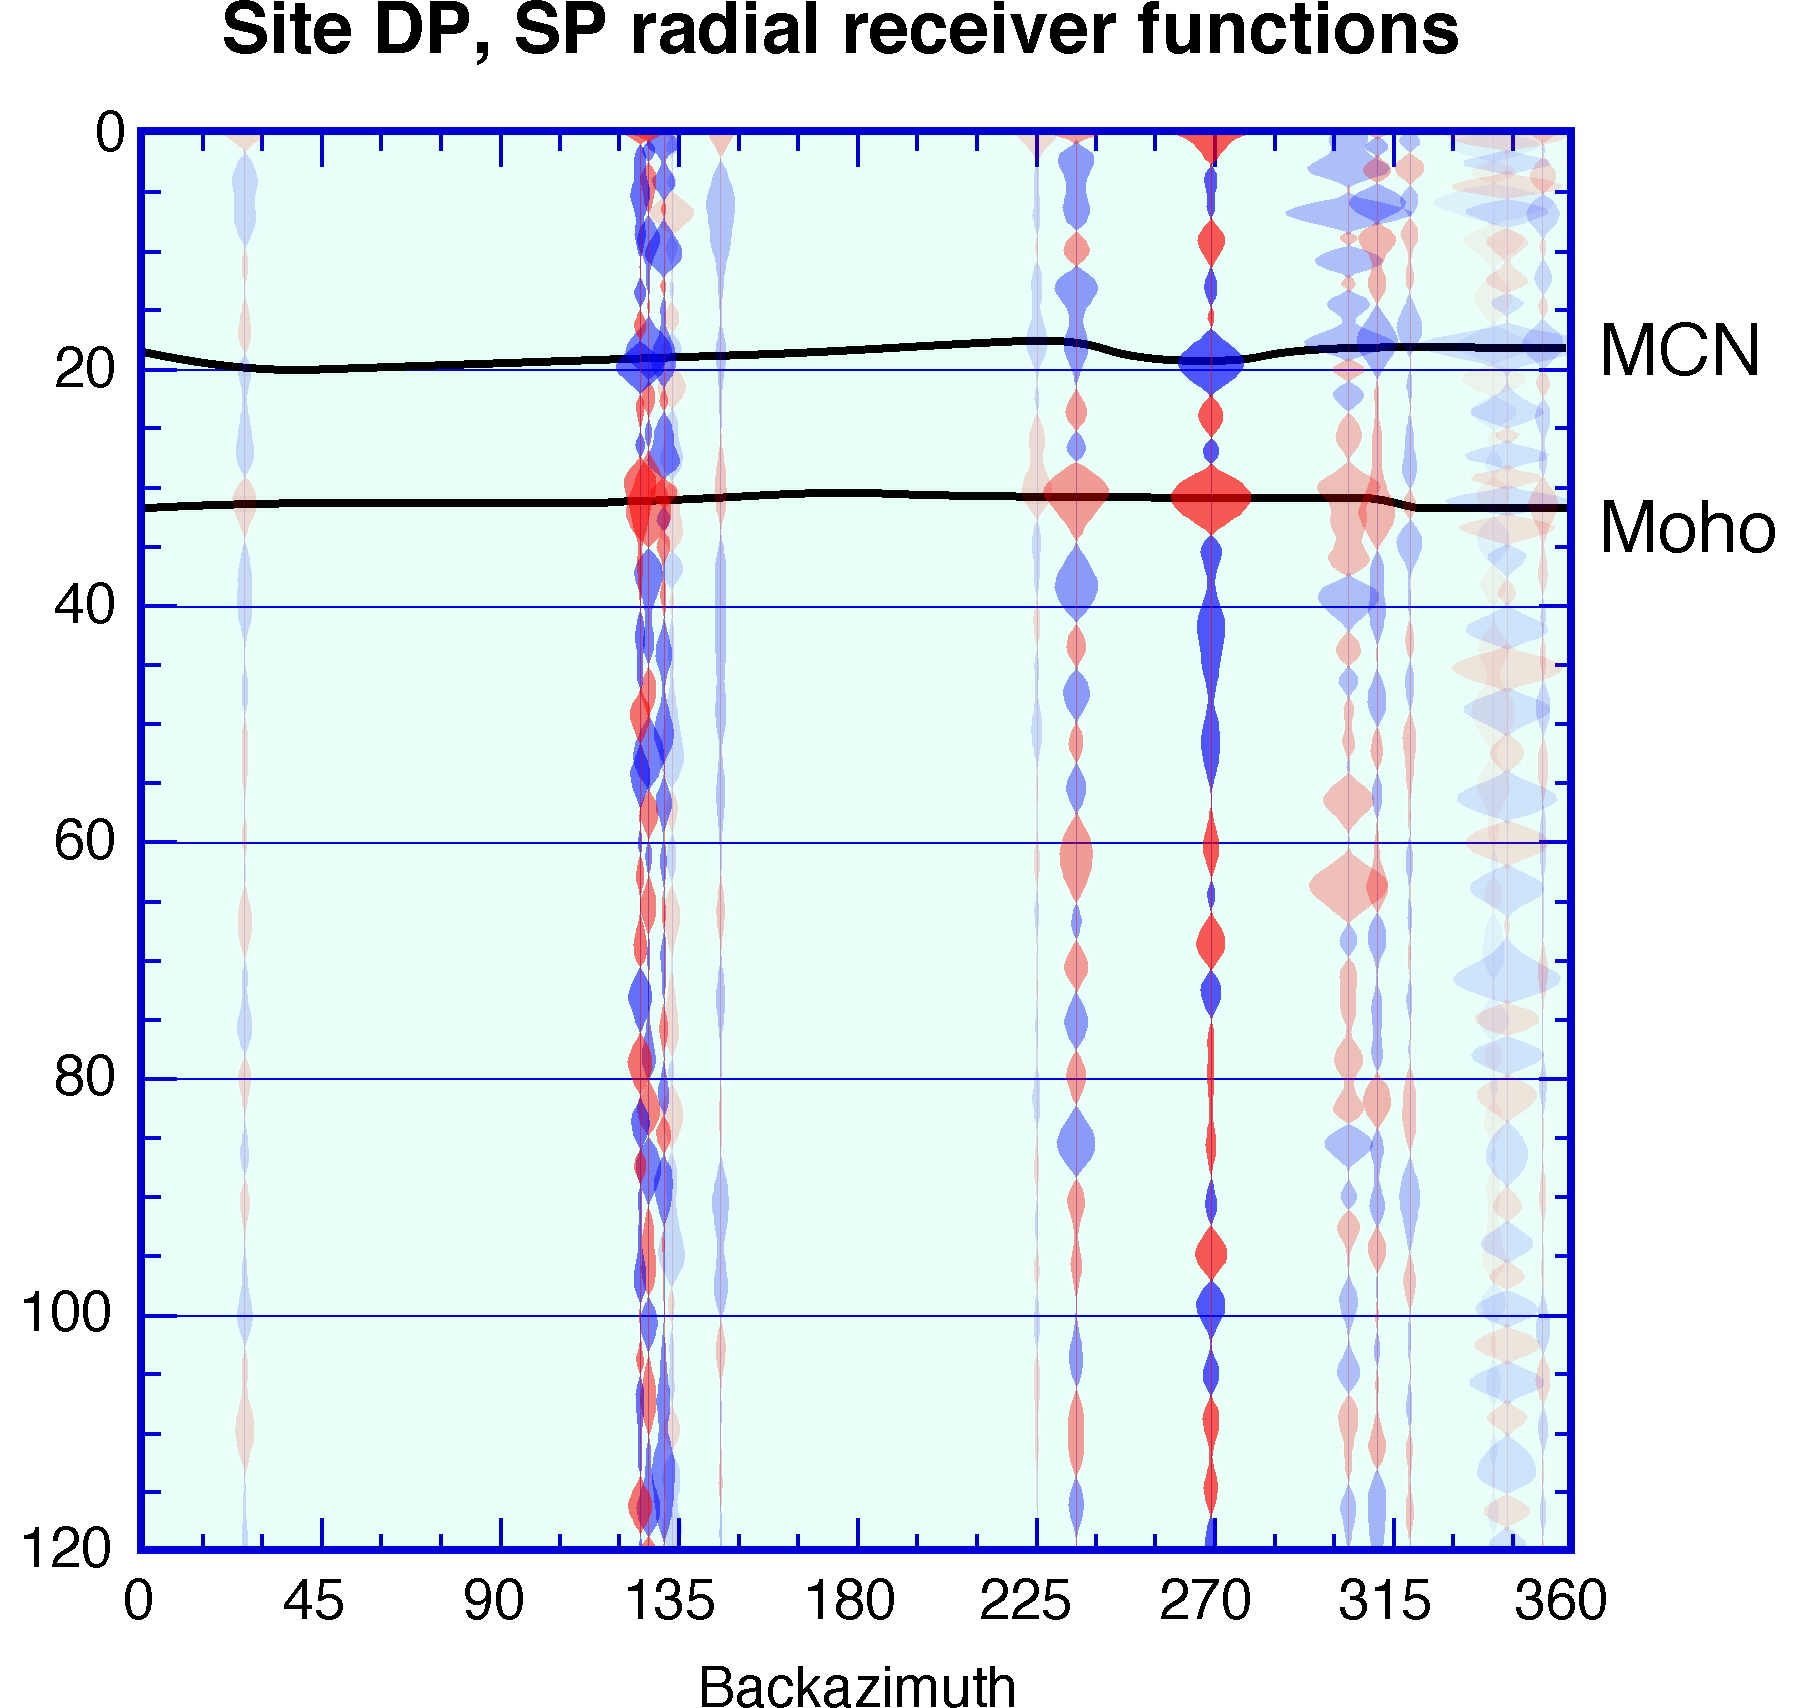
The easternmost array, DP, shows little variation with backazimuth. The mean receiver function has a single significant upward pulse at about 30 km depth below sea level (b.s.l.) preceded by a noticeable downward pulse about 18 km deep and a smaller downward pulse near 6 km depth. The Moho is thus unambiguously the large positive pulse near 30 km depth.
A prominent arrival nearly equal in amplitude to that of the Moho conversion but of reversed polarity arrives 2.5 s after the P (~18 km depth; MCN conversion, Figures 4 and 6). A variation in travel time consistent with about 1 km of relief on the MCN converter is observed, with a dip to the SE. Amplitudes at array DP are difficult to interpret because strong azimuthal patterns in amplitude are matched by equally strong azimuthal variations in the radial component of the direct P arrival. A second, smaller negative conversion ("UCN" conversion) is just under 1 s (about 6 km psuedodepth) after the direct P.
Figure 6. Migrated receiver functions arranged by backazimuth plotted against depth below sea level (km). Scale mapping depth to time after direct P for different distances ([Delta]) shown on left side. Amplitudes of radial components (a-c) have been corrected to a uniform P incidence angle of 20°; thus amplitudes of direct Ps conversions should be proportional to impedance contrast. Amplitudes of tangential receiver functions (d-f) are uncorrected. Dark parts of waveforms (which are mirrored about zero) are positive parts of the receiver function; lighter-than-background parts are negative parts of the receiver function. Highest contrast traces have a BI < 3 (Table 4a), intermediate grays are from receiver functions with a BI between 3 and 4, and lowest contrast traces are for BI > 4. Note that any reverberations present in the receiver functions will be assigned an incorrect depth. Picks of prominent conversions made on radial traces and shown for reference on the tangential plots.
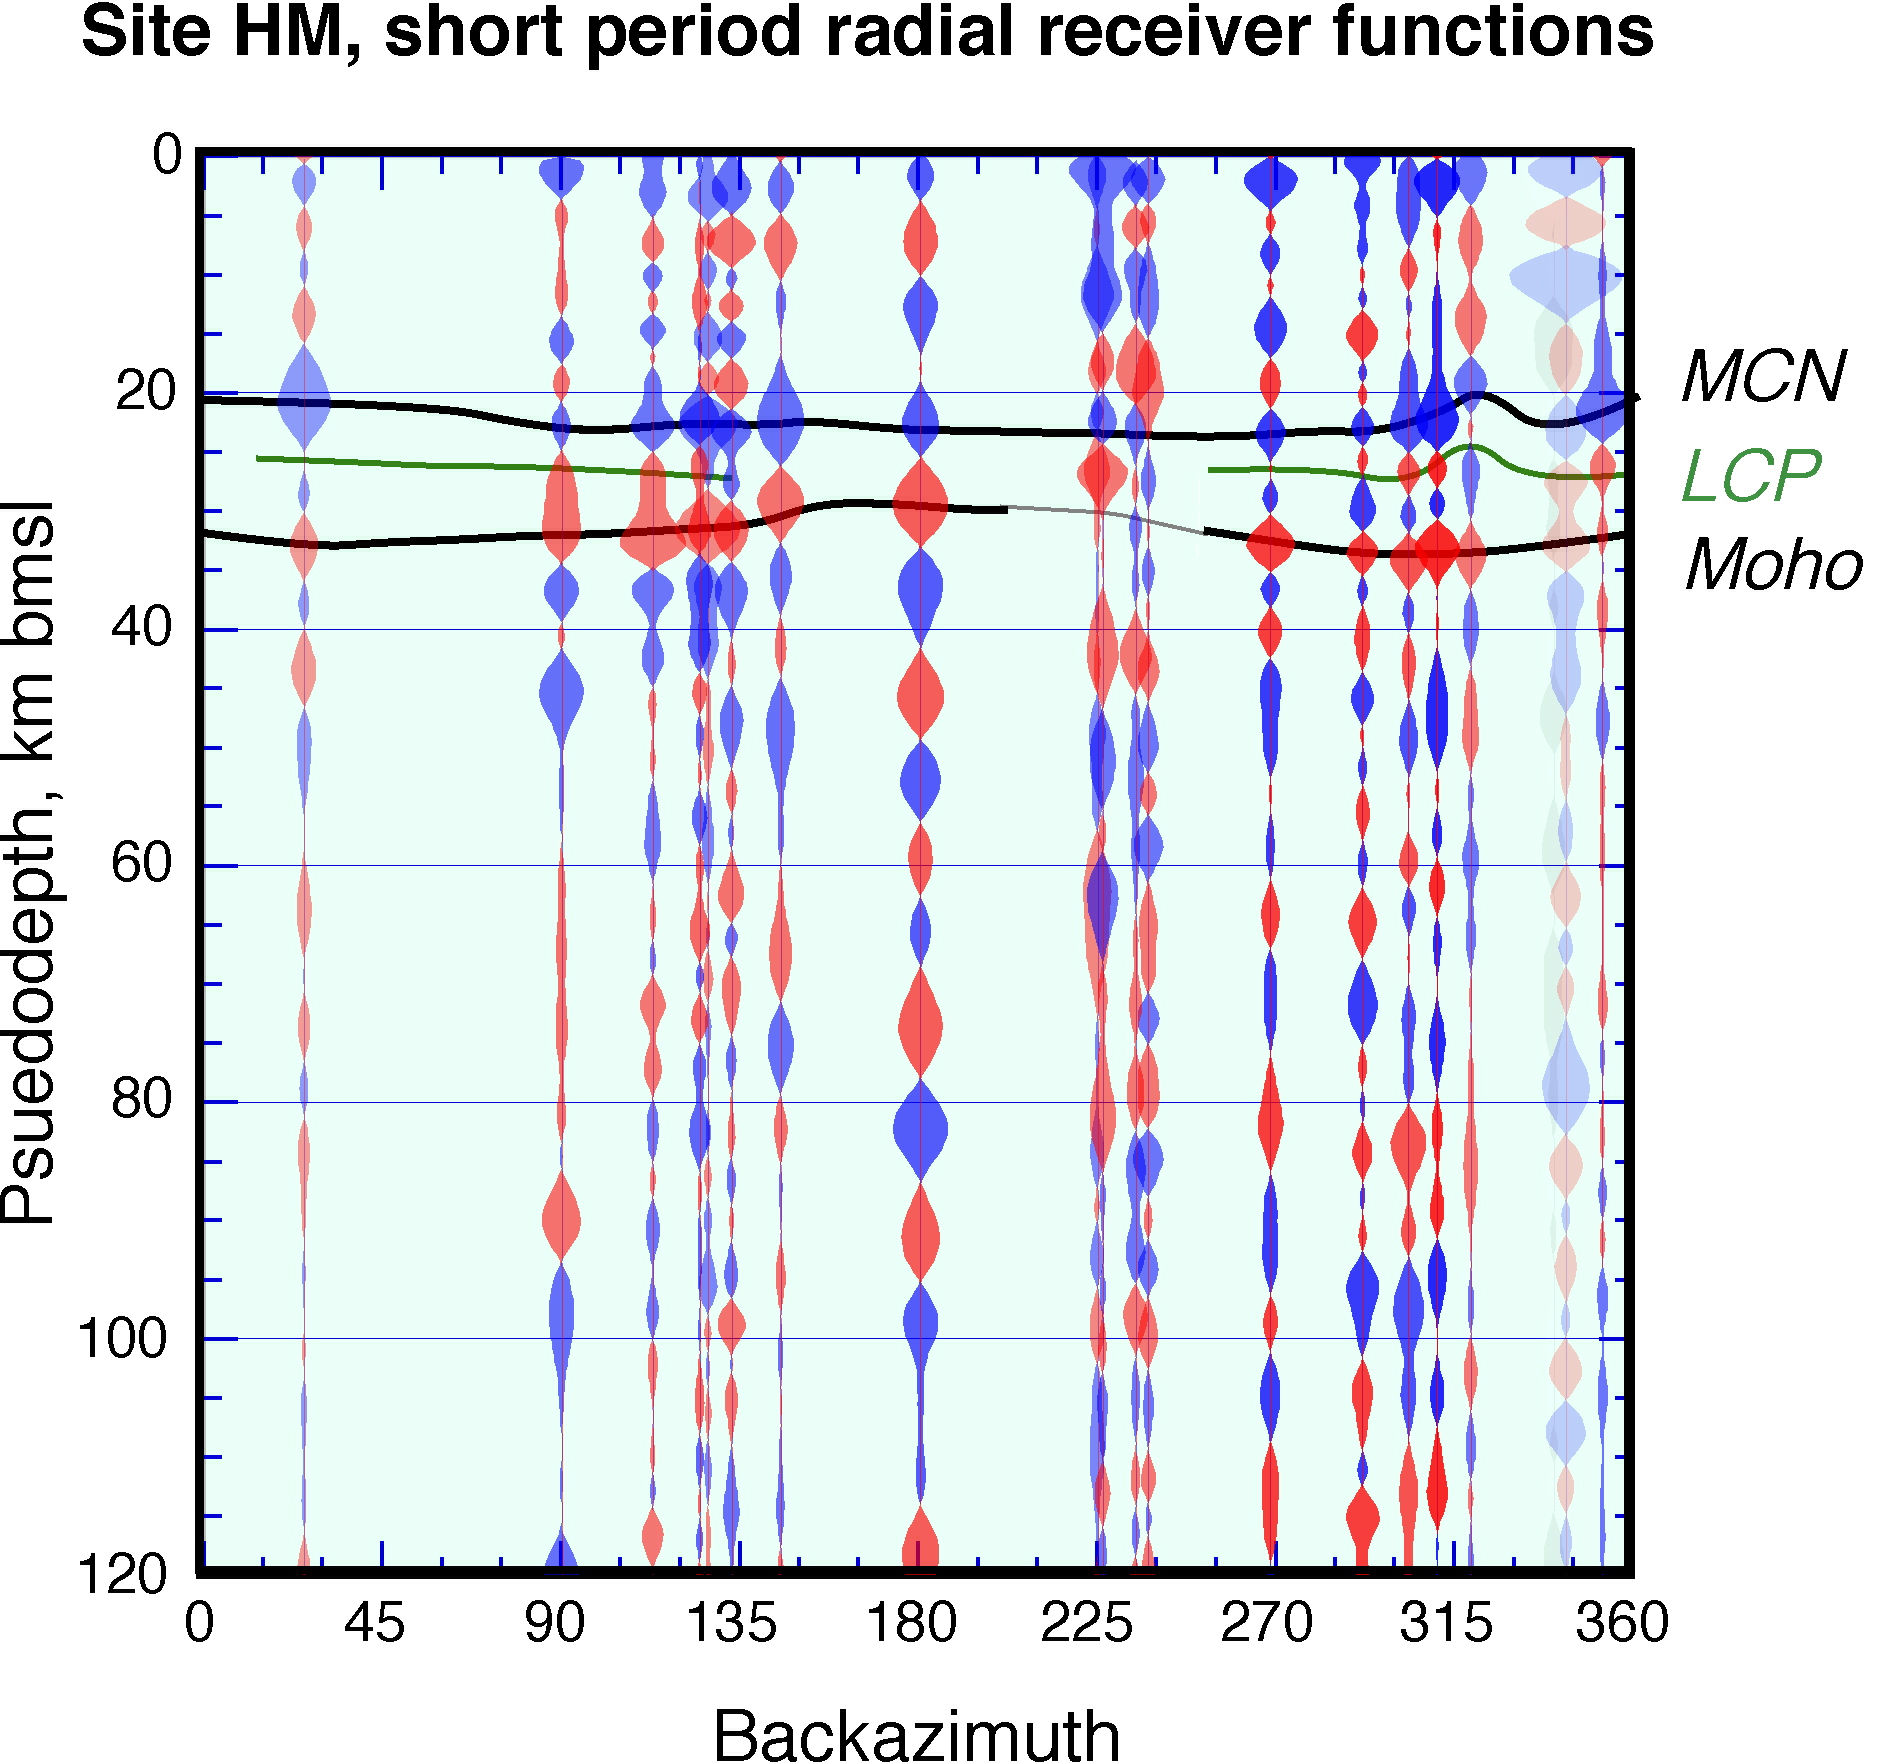
At HM, 40 km west of DP in the easternmost high Sierra, the receiver functions display considerably more structure. The mean receiver function (Figure 4) has two upward pulses straddling 30 km depth preceded by a large downward pulse near 23 km depth. When the mean is taken separately for events to the SE and NW, some azimuthal information appears. To the southeast, a single broad pulse peaking near 31 km depth is flanked by downward pulses at 23 and 36 km depth; to the west (dominantly northwest) there are the two upward pulses at about 26 and 33 km depth following a large down near 23 km depth. No comparably large upswings follow these pulses in the upper 70 km of the lithosphere, though a small upswing is seen near 60-65 km depth. The depth to Moho based on Ps appears to vary with backazimuth (Figures 6 and 7, Tables 5 and 6); this is addressed in a later paragraph.
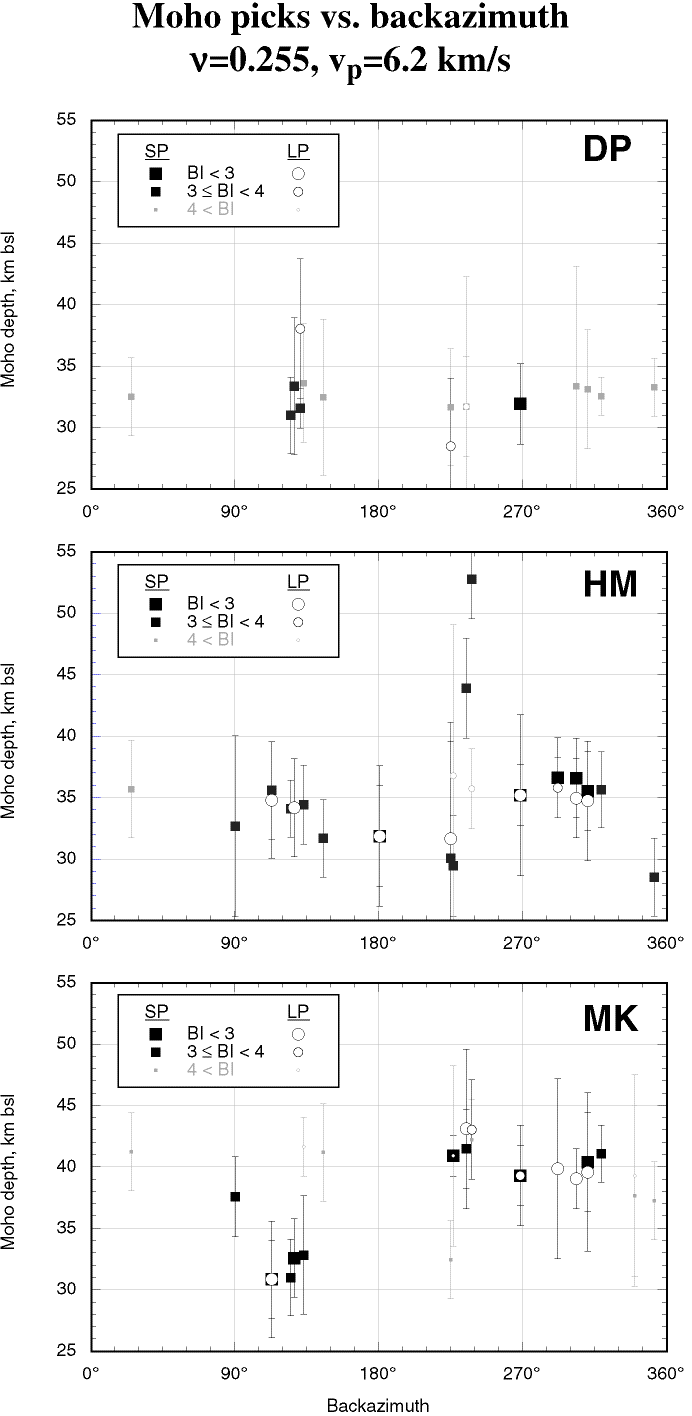 |
Figure 7. Picks of the Moho Ps conversion from the radial receiver functions, converted to depth assuming a uniform crust with a 6.2 km/s P velocity and a Poisson's ratio of 0.255. Error bars reflect width of the Ps pulse (Tables 4 and 5). Picks from both short-period (SP) and broadband (LP) beams shown. |
* initial P wave particle motions indicate a more shallow incidence angle
than expected for those source distances.
* short period and broadband beams show large (>1 km) differences in
picks
* picks made from radial and total particle motion do not agree
* apparent slowness across the array corresponds to conversion at
near-surface scatterers
* little or no coherent energy near 1 Hz traversing the array with
backazimuth and slowness remotely consistent with the great-circle path at
times plausible for a Ps conversion
* signals a little after 5 s, which might be from Moho, have a slowness
across the array indicating a source to the SSE or directly below the station
We exclude these four events from further discussion of the Moho, and take them up later in the discussion of crustal melting.
Above (or before) the Moho conversion is the weaker, positive "LCP" conversion (Figures 4 and 6b). In addition to being sandwiched between two stronger conversions, this conversion arrives for many backazimuths at about the same time as energy scattered from the Sierran front to the NE as identified by coherence analysis of the radial waveforms. Despite this observation, the general coherence of this arrival over nearly all backazimuths along with its consistent polarity reduces the chances that this arrival is an artifact of scattering. There is no noticeable variation in arrival time with backazimuth attributable to dip, but there is a striking variation in amplitude with backazimuth, with the lowest amplitudes to the SW and one measurement due east. This pattern appears to be caused by anisotropy at the converter and is discussed in greater detail by Jones et al. (manuscript in preparation).
Below the Moho at HM are some variations suggesting that some structures accompany the changes in character of the Moho. East from HM there is a large downswing at a depth of about 36 km (Figures 4 and 6b), but events from the west have a very limited downswing (but a lower amplitude Moho conversion) and a small upswing at 40 km depth. This pattern is more pronounced on the broadband receiver functions, which are more sensitive to smaller gradients than the short-period beams. This variation has similarities to variations seen at MK discussed below that might reflect a wholesale imbrication of crust and mantle between about 30 and 40 km depth under the High Sierra.
At MK, west of the Kern Canyon axis, the receiver functions are even more complex (Figure 6c,f). The overall mean receiver function is deceptively simple, with a single notable (Moho) upswing near 38 km depth (Figure 4). Its amplitude is only about half of that at DP. When partitioned by backazimuth, the 38 km depth event is present both to the east and west but is substantially weaker to the east. Other pulses show stronger variation with backazimuth. To the east, a positive pulse at 30 km depth is somewhat larger than the Moho conversion; the roughly 8 km difference between these two peaks is similar to that between the Moho and LCP peaks to the NW of HM (26 and 33 km). A deeper upswing of nearly the same amplitude is found at about 61 km depth. In contrast, the receiver function for events to the west has large downswings near 30 and 60 km depth as well as considerable energy in the upper 20 km of the crust.
Considerable energy occurs prior to the conversion near 30 km depth, but unlike arrays DP and HM, this energy does not stack over all azimuths. We do not infer the presence at MK of the MCN conversion; indeed, above about 30 km, most of the energy present appears to be from scattering, as will be discussed in detail below.
We have picked the largest positive swing on (uncorrected) radial receiver functions from individual events between about 3 and 8 s after the P arrival and measured the width of the swing from zero-crossing to zero-crossing (Table 4). Only upswings exceeding in amplitude the standard error from the deconvolution were included (with 2 marked exceptions). Moho depths calculated assuming a uniform crustal velocity above the Moho of 6.2 km/s and a Poisson's ratio (n) of 0.255 (Table 4) reveal an increase in Moho depth from DP to MK of 5.6 km, with an uncertainty of about 1 km (Table 6). This increases to 7.3 km if we consider the ~40 km deep converter at MK to be the true Moho, coming into better agreement with the stacked receiver functions (Figure 4).
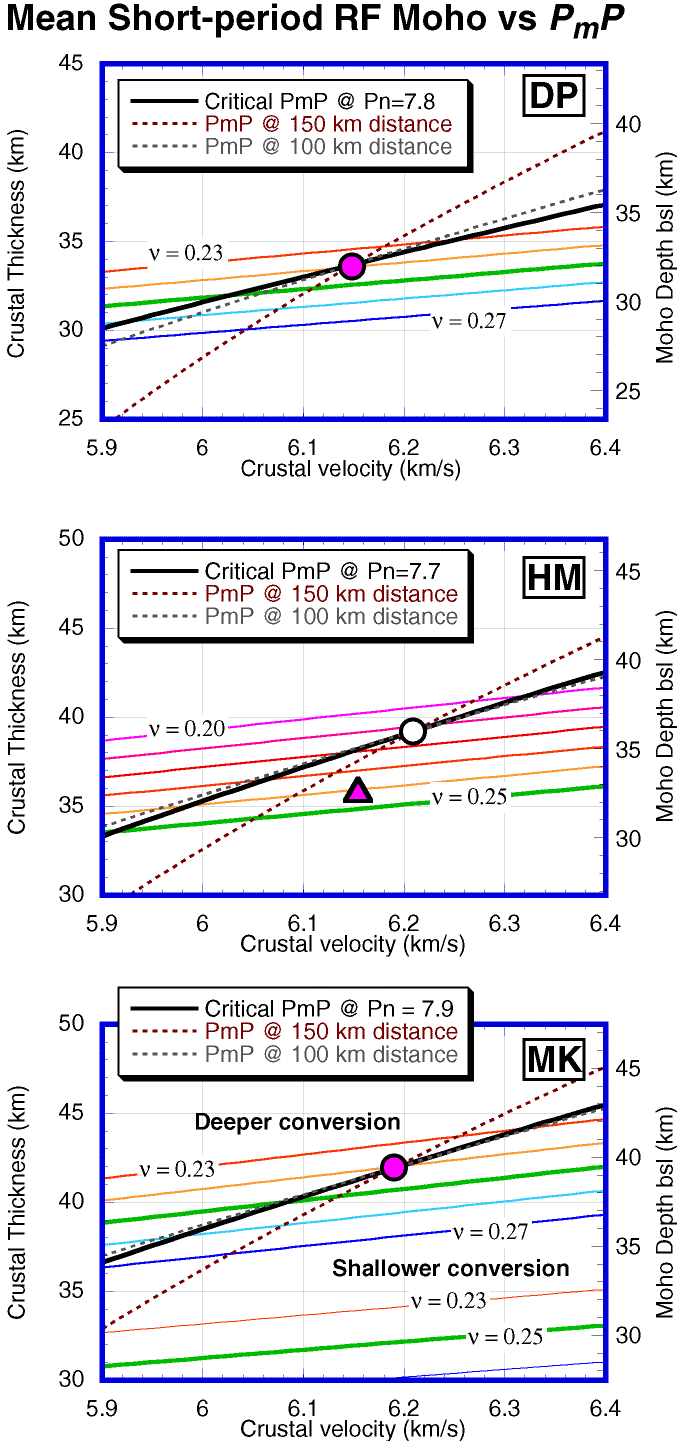
Thus the receiver functions reveals a Moho that is deepening to the west. The highest topography is found at array HM, yet the Moho is deeper to the west at MK where the elevations are about 1000 m lower. This pattern is very similar to the topography on the Moho from wide-angle reflection/refraction profiling described by Fliedner et al. [1996] and Ruppert et al. [1998] (Figure 8). For a Poisson's ratio of about 0.24, the Fliedner et al. [1996] thickness estimates and our estimates are in perfect agreement at DP and for the deeper conversion at MK. At HM, however, the Fliedner et al. estimate disagrees by 4 km with ours and cannot be reconciled using a plausible (>= 0.24) value for Poisson's ratio without a low (~6.0 km/s) mean P velocity for the crust (Figure 8b). HM is 20 km from the nearest control point of Fliedner et al. [1996] and abuts a 60 km diameter hole in their bouncepoint coverage; thus it seems likely that the difference reflects a somewhat thinner crust than they show with, perhaps, a somewhat lower mean P velocity (open triangle in Figure 8b). This reconciliation seems warranted by the interpretation of Ruppert et al. [1998], who obtain a Moho depth of 34 km b.s.l. at HM, which is only slightly deeper than our preferred Moho depth.
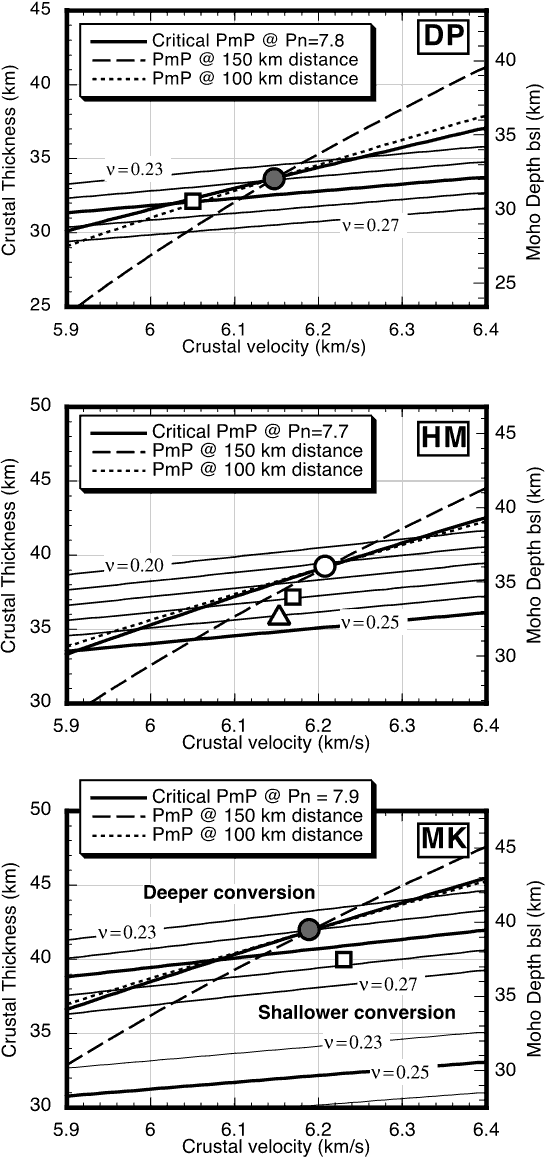 |
Figure 8. Crustal thickness tradeoffs for both teleseismic Ps conversions (this paper), PmP reflections, which were used by Fliedner et al. [1996] near the PmP critical distance. Thinner curves (labeled with mean crustal Poisson's ratio n) are the weighted (by BI, Table 5) mean of the teleseismic Ps picks, with the thicker parallel curve representing n=0.25. Thicker, steeper and dashed curves are for PmP reflections observed at and near critical distance in ranges used by Fliedner et al. for their interpretation. These tradeoffs are probably similar to those expected for the model of Ruppert et al. [1998], although precise tradeoffs more complex because of other phases used and lateral variations in velocity. Preferred thickness and mean velocity of Fliedner et al. [1996] is at the circle at the intercept of the three thicker lines; preferred values of Ruppert et al. [1998] are the open squares. The Fliedner et al. [1996] estimates agree with our observations for n = 0.24 at MK and DP (solid circles). At HM, the value consistent with our observations (n >= 0.24), closest to the Fliedner et al. estimate (open circle) and Ruppert et al. estimate (open square), and within the estimated uncertainties of the PmP picks is shown at the open triangle. Uncertainties on the teleseismic curves are about +/- 1 km (see Table 6) and are about +/-2-2.5 km on the PmP curves. Note the different range for n in (b). The thinner curves in the lower part of the plot for MK (c) are for the strong shallower conversions to the east of MK. Also note Moho depths on right side of plots. |
Both the absence of direct correlation of Moho depth to topography and lateral changes in the character of the converted arrivals from near the Moho direct us to a closer examination of the converted energy from near the Moho. Variations with backazimuth in the shape and timing of the Moho Ps arrival indicate that significant lateral variations in the Moho exist within a radius of 10-15 km of the arrays at HM and MK. We seek to use these as clues to the tectonic history and processes in the region. As in the previous section and Table 6, we report depths assuming a uniform P velocity of 6.2 km/s and n of 0.255.
DP: A simple story. Rather curiously, the region with the most surface evidence of Cenozoic deformation is the site with the simplest structure. Following the clear Moho conversion, the receiver function trace shows very little energy. The topography near array DP is subdued (Figure 1), greatly reducing the likelihood of scattered energy, but the linear geometry of this array and frequent instrument problems make this array the most susceptible to problems from scattering and focusing. These greatly limit our ability to interpret any variations with backazimuth, especially of amplitude. What little variation in timing of the Ps arrival exists suggests a NNE dip on the Moho, opposite the sense anticipated from amplitudes of the Moho conversion. Lateral variations and interface dips of a few degrees are possible here but not required by our data. Thus we interpret the Moho here to be nearly flat and with no distinct S-wave impedance contrasts in the upper 80 km.
HM: Multiple Mohos? As noted above, two positive conversions originate between about 25 and 38 km depth; the smaller, shallower LCP and the larger positive Moho conversion near 33 km depth. The mean depth of the LCP conversion is 26.4 +/- 0.5 km b.s.l. Slight azimuthal variation in the LCP arrival times may indicate an interface dipping ~2° south.. This would be compatible with the amplitude variations, but the matter must remain speculative in light of the paucity of good signals.
The Moho Ps phase at HM arrives later for events from the northwest than other backazimuths. We interpret this by a planar Moho dipping north at ~6° (Figure 7 and Table 6), having dropped the anomalous arrivals from the SW and a visually discrepant PP pick from BAZ=352[ring]. The latter is probably an LCP conversion (see later, smaller Moho? arrival on Figure 6b). This dipping Moho halves the weighted variance of the depths inferred from the 13 SP and 7 BB picks used (Table 4) from 1.8 km2 to 0.92 km2. The standard error of the mean that would be calculated from such a variance is under half that propagated from the "standard errors" that represent the widths of the Ps peaks (and used in the dipping plane error in Table 6), thus confirming our earlier suggestion that the pulse widths were very conservative estimates of uncertainty.
Such a dipping planar Moho should produce observable variations in amplitudes of the radial and transverse components [Cassidy, 1992] (Figure 5). Such a variation is observed on the amplitude of the radial Ps, which is greatest to the SSE, consistent with that being the down-dip direction. While the transverse component (Figure 6e) should show effects of the dipping Moho, it is dominated by incoherent energy which, although reduced somewhat in stacking, we cannot use in this analysis.
MK: Complexity at the Moho. Complications in the Moho conversion detected at HM suggest that the sub-Sierran Moho is more complex than that to the east (array DP); array MK provides some estimate of the western extent of this unusual Moho.
As was noted above, MK's receiver functions from events to the east are distinctly different than those from events to the west. To the east, a strong positive event usually lies at ~30 km b.s.l. while at the same depth range to the west the receiver functions usually show a large downswing (Figures 4, 6c). The same pattern is seen in the broadband receiver functions. The deeper conversion near 40 km depth appears on all the receiver functions but is fairly weak to the east and relatively strong to the west. The 40 km event we consider to be probable Moho; it agrees well with the results from the refraction experiment [Fliedner et al., 1996; Ruppert et al., 1998]. The 30 km event is coherent and repeatable, yet its behavior is somewhat cryptic. We consider the possibilities. The 30 km event might be due to a laterally changing, but authentic, impedance transition at the appropriate point under MK, or to coherent scattering from shallower structure.
Mineral King is within one of the most rugged locales possible for deployment of an array of seismometers (Figure 1). Strong, coherent scattered waves were detected early in our analysis and no doubt are caused in large part by the topography of the area. Separating signals from below the array from those traveling in from the sides is important in trying to interpret variations in the receiver function with backazimuth; the difficulty in doing this ultimately limits our interpretation. While a larger, denser array could readily manage to separate out scattered signals, our field parameters permit only a limited degree of directional sensitivity. For this reason we discuss in detail our logic in choosing which elements of the MK receiver functions we assign to structure at depth and which are probably scattered from surface topography.
Consider first how energy scattered in the near surface might enter the beamed seismograms and subsequent receiver functions. One particularly prominent package of scattered energy ~2 s after the direct P provides helpful clues. This 2 s scatterer is to the NNE, on a backazimuth nearly perpendicular to the east-west leg of the MK array; thus, the scattered energy arrives with a high apparent velocity across the east-west leg and typically will stack up on these stations for a teleseismic beam. The north-south leg reveals this energy to be scattered, traveling with an apparent velocity of 4-5 km/s, and it does not stack up on this leg for a teleseismic beam. Thus the part of the scattered energy that stacks coherently is ~1/2 the size of the wave on any individual seismogram if the entire array is operating. Unfortunately, the seismometers of the north-south leg suffered frequent power outages due to shadowing in the deep valley (Figure 1). Thus, on occasion, we get even larger stacks of this scattered energy; for this reason, we tend to discount some of the bumps on the receiver function near 10-15 km pseudodepth (Figures 4 and 6c).
The energy at about 30 km pseudodepth (about 4.0 s after the P arrival) has several characteristics arguing against stacking of energy scattered from topography. First, the opposite polarities from events to the east and west suggest that the scatterer (assuming it produces energy dominantly in the P-SV system) is to the west or east. The outages on the north-south leg that tended to exaggerate the 2 s scattering work to destroy any scattering from these backazimuths. For events with a compact source pulse, we looked at the radial signals using the array processing package dbap (D. Harvey and D. Quinlan, Univ. of Colorado). While the ~2 s energy is clearly visible coming from the north, no east- or west-traveling signals are seen around 4 s.
The other information that makes more plausible a deep crustal origin for the energy projected to ~30 km depth is the similar set of conversions from HM. By extrapolation from HM, we might expect to see positive conversions above or below the Moho conversion eastward from Mineral King. Comparing the traces from events west of HM (mostly NW) with those eastward from MK (Figures 4 and 6) illustrates the similarity in relative timing of these two phases. The MK conversions are noticeably lower in amplitude and later (deeper) than their HM counterparts but seem to imply a package of lower crustal rocks of somewhat higher velocity than the crust above.
The problem is that the conversion at ~30 km depth appears to reverse polarity for events from the west. This cannot be caused by horizontal anisotropy because the receiver functions from SE and NW backazimuths have opposite polarities--horizontal anisotropy would predict the same polarity for arrivals from these two backazimuths. If the converter dipped strongly (>~20°) to the east or southeast, a reversal of polarity is possible but we would expect to see significantly earlier arrivals from the west than from the east. A serrated boundary, with gentle elements dipping east and steeper connections dipping steeply east or vertically could possibly produce this effect. Some strong scatterer at about the depth inferred from our analysis might produce this pattern without enough of a moveout to separate it from the normally converted energy. Alternatively, a simple interpretation of the structures to the east and west is possible, and the positive conversion to the east either merges to the west with the Moho conversion to make the stronger Moho Ps seen to the west or simply pinches out in the lower crust to the west. The negative conversion above the Moho to the west could reflect some structural element not seen in any of the receiver functions to the east.
We conclude that the Moho west of MK is about 40 km b.s.l. and that this interface continues eastward from MK, though with a lower impedance contrast. At about 30 km below MK lies a cryptic feature that indicates a major laterally variable structure, which we possess insufficient information to resolve. Although anisotropy by itself cannot explain these observations, it may play a role.
Both HM and DP arrays recorded reversed conversions from a structure in the mid-crust. Because of the similar character of this arrival at both arrays, we suggest it originates with a single structure. At DP the MCN is 16.7 +/- 0.4 km b.s.l. (Figures 4, 6a). At HM it arrives just over 3 s after the direct P, mapping to a converter depth of 22.6 +/- 0.6 km b.s.l. (Figures 4, 6b) Such a structure would then dip about 3° to the west with little direct control on any north-south dip. As we have observed azimuthal variations in converter amplitude that we attribute to anisotropy (Jones et al, manuscript in preparation), our discussion of amplitudes below refers to isotropic amplitudes averaged over backazimuth.
This reversed arrival requires an S-wave low-velocity zone within the crust whose top generates the MCN. The amplitude of the observed conversion at either DP or HM requires a downward decrease of about 20% in the S-wave velocity across this discontinuity. No equivalent P-wave low-velocity zone was found in the analysis of the SSCD refraction profile right through this area, though a small (~1%) P-wave LVZ was inferred under HM at this depth [Ruppert et al., 1998], and a small LVZ is easily masked in a wide angle experiment. Assuming a constant Poisson's ratio, synthetic receiver functions derived from the P-wave refraction model of Ruppert et al. [1998] show no downward arrival at the time of the MCN conversion. A P-wave low-velocity zone (LVZ) can only be avoided if the S-wave LVZ is the product of severe variations in Poisson's ratio (n=0.24 over n=0.36, corresponding to the range from granite to serpentinite [Christensen, 1996]). Such variations are well beyond those measured on crystalline rocks likely to exist at such depths [Christensen, 1996]. The S-wave variations are also difficult to accommodate solely with anisotropy, especially considering that considerable transverse anisotropy already has been averaged out (Jones et al., manuscript in preparation).
The most plausible explanation of the MCN is that it tops a P-wave low-velocity zone less intense than the S-wave LVZ (only ~9% decrease across the MCN). Thus the MCN coincides with an increase in Poisson's ratio from 0.24 to about 0.32 (Figure 9). Below this, P velocities increase steadily to the Moho, reducing the discrepancy with the refraction interpretation without violating the receiver function constraints. Poisson's ratio is allowed to decrease with depth below the MCN to 0.28 at the LCP (alternatively Poisson's ratio can stay high to the Moho, decreasing further the size of the P-wave low-velocity zone). The best constrained elements of this interpretation are the S-wave velocity contrasts across each discontinuity and the spacing of the discontinuities (i.e., S-P time from there to the surface); the least constrained are velocity gradients below about 1-1.5%/km, which tend to produce small, long-wavelength signals difficult to isolate with the receiver function technique (compare the two synthetics in Figure 9).
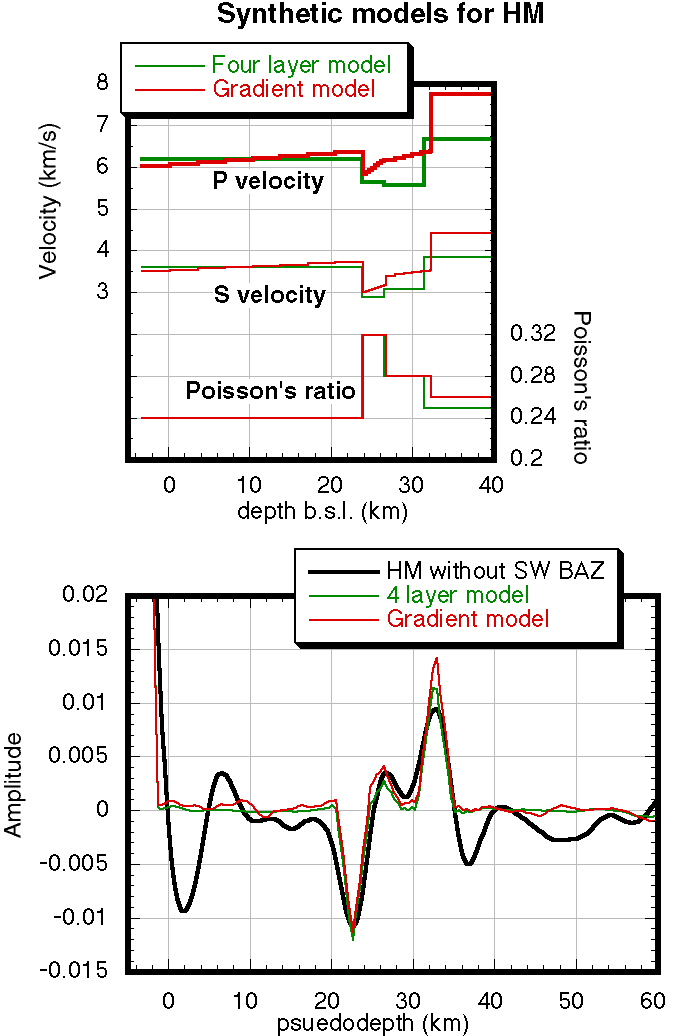 |
Figure 9. Synthetic receiver functions compared with the mean receiver function from HM over all but the southwestern backazimuths. Synthetic receiver functions were processed from synthetic seismograms the same as raw data. Velocity structures (top) used in generating the two synthetic receiver functions illustrate the important and unresolvable elements from receiver functions. Note that the amplitude of the S-wave velocity step remains constant and that depths must be adjusted to reflect interval velocities between discontinuities, but that velocity gradients produce small changes in the receiver function. Note that the use of gradients changes the P velocity in the upper mantle from ~6.8 km/s (4 layer model) to a more realistic ~7.8 km/s while maintaining a mean upper crustal P-velocity of 6.2 km/s. |
The overall image from the three arrays is of a Moho that varies from simple in the Basin and Range to quite complex under the Sierra. This complexity might reflect a stepping down to the west of the Moho rather than a simple structural dip on a single surface. At array HM it appears that a pod of higher velocity crust exists at the base of the crust below the LCP converter; this pod might extend to the vicinity of MK before petering out. The crust-mantle S-velocity contrast seems to be lower at and especially west from array HM relative to points east, becoming quite weak under (and especially east of) array MK. This change suggests that the Moho is a large velocity contrast to the east and becomes somewhat smaller to the west, consistent with the presence of relatively higher velocity material at the base of the crust and lower velocity material below the Moho. The arrivals from the west of MK suggest a return to higher velocity contrasts and a simpler Moho but at greater depth than to the east.
Our location of the Moho further removes a crustal Airy root from the realm of possibility for supporting the Sierran topography at this latitude, thus supporting other analyses [Carder et al., 1970; Carder, 1973; Jones et al., 1994; Fliedner et al., 1996; Ruppert et al., 1998]. Although crustal sources for the isostatic support of the range are difficult to disprove, several approaches to examining the gravity anomaly associated with the Sierra consistent with the Moho depths inferred here suggest that about half of the support for the range originates in the upper mantle [Fliedner et al., 1996; Jones et al., 1994; Park et al., 1996]; these suggestions are reinforced by observations of anomalous mantle electrical conductivities [Park et al., 1996] and sub-Moho xenoliths [Ducea and Saleeby, 1996]. Thus additional constraints on the nature of the buoyant upper mantle underlying the Sierra are important in understanding the source and history of the range's support.
The change in polarity with backazimuth of the LCP(?) or shallow Moho converter at MK is similar to that seen a few km below the Moho at HM. Although the deeper change at HM has a lower amplitude and appears more in the lower frequencies, it too has a negative polarity in one direction at the same depth as a positive polarity in the opposite direction. The variations together bookend an area with a low amplitude Moho Ps conversion and somewhat ambiguous Moho. It seems likely that these polarity changes with backazimuth are directly related to some complex structure at and near the Moho under the High Sierra; perhaps we are seeing some focusing effects or scattering at depth related to this structure. Further detailed study or complementary data will be needed to determine what structural geometries are consistent with these observations. Although the details of how the observed energy is generated are murky, the overall sense is that a packet of material exists under the Sierran crest between about 30 and 40 km b.s.l. with seismic velocities grading from crustal velocities in the west to (low?) mantle velocities in the east (dashed lines in Figure 10b; schematically shown in Figure 10c). This then shifts the seismic Moho from about 30 km under HM at the top of the packet to 40 km just west of MK, at the base of the packet.
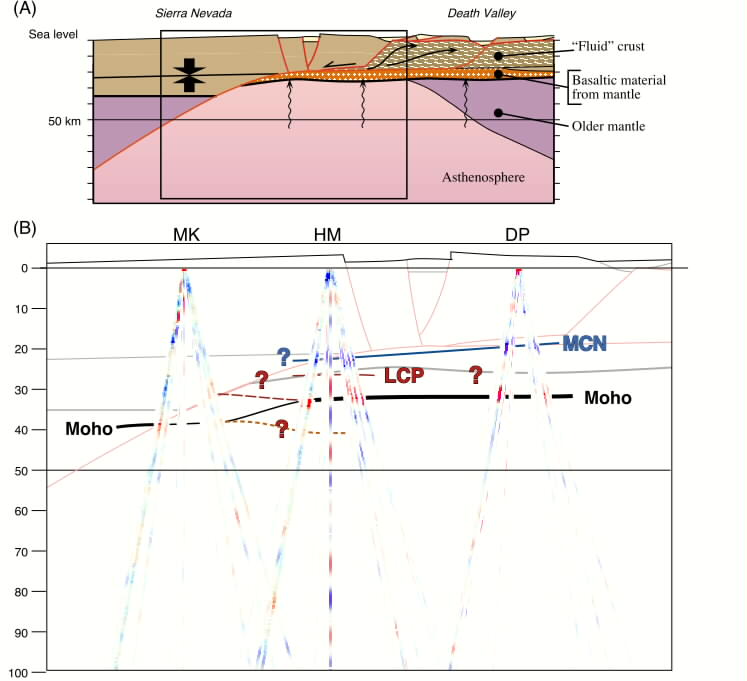 |
| Figure 10. (A) A pre-experiment east-west
geologic cross-section of the region by Wernicke [1992].
The opposing arrows on the left denote an occlusion zone which was the
source of the "fluid" crust (wavy line pattern) now under the Basin and
Range. The extent of asthenosphere was consistent with mass-balancing
assuming a pre-extensional lithosphere 120 km thick. No vertical exaggeration.
(B) East-west cross section of migrated short-period receiver functions backprojected along the Ps raypath within the structure of Table 3; amplitudes have been corrected for incidence angle within this structure. Red (blue) conversions are positive (negative) conversions. Faults (pink lines), Moho (thick gray line), and other contacts (thin gray lines) of the Wernicke [1992] interpretation from (A) are shown as are the Moho (black line), LCP (solid red line) and MCN (solid blue line) of this study. Thickness of the Moho line is roughly proportional to the intensity of the S-wave velocity contrast. Dashed lines show possible extensions of the LCP converter and possible intertonguing relations along the Moho under the Sierra. Note the close coincidence of the major west dipping fault of Wernicke [1992] with the MCN conversion and the similar shape of the Moho. |
Figure 10 (C) Summary cartoon of one possible interpretation of this paper's results. Key points are labeled with observations suggesting the interpretation in italics. More mafic crust with some melt lies below the MCN; melt is inferred to largely be derived from the upper mantle under the High Sierra where the Moho conversions are weak and possible multiple. An intertonguing of mantle and crust might explain the observations east from MK and be consistent with the refraction interpretation of Ruppert et al. [1998].
Through integration of our results with the those of the active-source component of the SSCD [Fliedner et al., 1996; Ruppert et al., 1998], we have found the bulk Poisson's ratio (n) of the crust to be rather low through this area (Figure 8). The values of n near and below 0.25 suggest that the Sierran crust remains highly silicic most of the way to the Moho; this is in agreement with the low P-wave velocities inferred by Fliedner et al. [1996] and Ruppert et al. [1998]. Such low values suggest that substantial melt does not pervade the crust under any array.
Melt in the form of magma chambers also appears generally absent because the Ps conversion from the Moho is strong for most event-array pairs and differs little in amplitude or timing between short-period and broadband records. The exception is to the southwest from HM, where we described substantial disruption of the Moho Ps (Figure 6b, 7). The shallower LCP and MCN conversions, especially the MCN conversion, do appear on three of these records, suggesting that the disruption of the Moho conversion in this backazimuth is caused by structural complications near the Moho. These rays project through the Moho directly under the Golden Trout volcanic field, a Late Quaternary-Holocene collection of basalt flows [Moore and Sisson, 1985; Moore and Dodge, 1980]. We thus suggest that a magma body near the Moho associated with this volcanism has disrupted the Ps conversion from the Moho.
The inferred increase in Poisson's ratio downward across the MCN from 0.24 to 0.32 would be consistent with a change from a very quartz-rich rheology to a more mafic lower-crustal rheology [Christensen, 1996]; it is also possible that melt below the MCN could increase Poisson's ratio but also decrease both P- and S-velocities [e.g., Schmeling, 1985]. We suggest that a combination of effects is most likely, allowing a smaller P-wave LVZ below the MCN that is most probably compatible with the refraction results while producing the necessary S-wave contrasts and, most likely, conductivity anomalies for the magnetotelluric observations [Park et al., 1996].
At both HM and DP, the MCN conversion separates relatively low-velocity upper crust (<6.4 km/s P velocity) from the higher velocity mafic lower crust present in the region (>6.4 km/s) [Ruppert et al., 1998]. The regional dip of the 6.3 km/s contour inferred by Ruppert et al. [1998] is about 4° from Death Valley to the Sierra, insignificantly different from the ~3° dip on the MCN we infer between HM and DP. This geometry is quite striking when compared with geologically-based inferences of the crustal structure along this line (Figure 10). The presence of a shear zone (as indicated by the azimuthal amplitude variations of MCN and LCP conversions; Jones et al., manuscript in preparation) capping generally higher-velocity lower crust is precisely what was predicted by Wernicke [1992] and is quite similar to earlier structures proposed for this area which would juxtapose upper and lower crustal sections across a gently west-dipping shear zone [Wernicke, 1985; Jones, 1987; Jones et al., 1992]. The MCN conversion is at exactly the depth predicted for this shear zone by Wernicke [1992] (Figure 10b).
There is other direct evidence of a major crustal feature at the depth of the MCN east of the Sierran crest. P-wave reflection profiling within the China Lake Naval Weapons Station (CLNWS) south of array DP reveals major crustal reflectors at two-way travel times of 2.4 s and 6.2 s (about 5 and 17 km b.s.l., respectively) [Malin, 1994, C. W. Caruso et al., unpublished manuscript, "A seismic transect of the western Coso Range, eastern-central California"]. The deeper conversion is interpreted to be reversed, indicating that it tops a velocity reversal. Each reflector coincides with a negative conversion in the receiver function stack at array DP (Figure 4). Magnetotelluric results place a boundary between extremely resistive Sierran crust and some more conductive body at about 10-20 km b.s.l. [Park et al., 1996]; the conductive body is inferred to be caused by partial melt. The SSCD refraction profile across the Sierra is interpreted to have a small (~1%) P-wave low-velocity zone from ~22 to 27 km b.s.l. under array HM but no equivalent feature under array DP [Ruppert et al., 1998].
The material below the MCN requires greater examination before Wernicke's [1992] model can be fully accepted. If the change in Poisson's ratio requires a more mafic lower crust, is this material a late Cenozoic igneous addition to the crust or is it part of the Mesozoic structure of the Sierran batholith? If the former, the profile agrees nicely with Wernicke's model, although the igneous addition to the crust is more substantial than originally envisioned, which would alter some of the mass balance estimates of Wernicke et al. [1996] and Wernicke [1992]. If the latter, then the underlying tenets of the crustal extrusion model require reexamination, because these hypotheses depend upon extreme weakness of the extruding material [e.g., Wernicke, 1990; Kruse et al., 1991; Block and Royden, 1990; Buck, 1988; Kaufman and Royden, 1994]. More felsic or mafic material is presently inferred to be more viscous than more silica-rich rocks [e.g., Kusznir and Park, 1987; Smith and Bruhn, 1984] and thus unlikely to flow as an intracrustal asthenosphere. Key tests are to determine how mafic (vs. how fluid-rich) the lower crust is, and to see what material forms the bulk of the crust farther to the east, where the extruded crust should now form most of the crust (Figure 10a).
The observations described above can be integrated into a reasonably consistent interpretation of the structure of the crust and uppermost mantle under the southern Sierra (Figure 10c). We especially emphasize elements of the interpretation common to more than one array. The most prominent conversion is that from the Moho; its intensity decreases east to west from DP to MK, suggesting a reduction in the contrast between crust and mantle from Basin and Range into the Sierra. We again emphasize that the depth of the Moho is fairly well constrained from our observations; with the exception of arrivals from events southeast of MK, there are no deeper conversions with amplitudes large enough to qualify as conversions from the Moho. The very different shapes of the Moho versus the topography reinforce the point made in other works that an Airy root does not exist to support the Sierra [Carder, 1973; Jones et al., 1994; Fliedner et al., 1996; Wernicke et al., 1996]. Because our results are in general similar to these other works, we direct the reader to these papers for discussions of the discrepancies of the shallow Moho interpretation with older refraction-based interpretations. The greatest difference between the just-cited papers and the SSCD results presented by us and Fliedner et al. [1996] is the presence of somewhat thicker crust under the western Sierra. This deeper Moho actually has support from the Pn observations of Jones et al. [1994] which had somewhat later arrivals at the westernmost stations (stations ccr, mnk (near our MKW2), and wmd in Fig. 9a of Jones et al. [1994]).
The absence of an Airy root associated with the highest topography requires that we locate the density anomaly that must be that supporting the Sierra and generating the large (~200 mgal) gravity low of the highest part of the range. This was discussed at length in Jones et al. [1994], who concluded that the combination of a low Pn velocity with the absence of a discernible teleseismic travel-time anomaly required the presence of a paired low- and high-velocity anomaly in the upper mantle under the range with both anomalies being low density. A similar assignment of a large part of the density anomaly to the upper mantle was also made by Park et al. [1996], Fliedner et al. [1996], and Wernicke et al. [1996]. The present study places the Moho at an indistinguishably different depth under the Sierran crest and offers some support for the kind of conclusions advocated by Jones et al. [1994]. The Moho contrast appears to be lowest between MK and HM, under the High Sierra, in the same region Jones et al. [1994] inferred low Pn velocities (~7.65 km/s). Detection of the proposed deeper high-velocity part of the paired velocity anomalies has proven difficult, but it is possible that the conversions from about 60 km depth east of MK and west of HM are from the top of this body. The eastern edge of the low-amplitude Moho and the backazimuth-dependent conversion polarities at HM coincide with the boundary seen by Jones et al. [1994] between low and more normal Pn velocities.
An unanticipated result was the identification of intra-crustal conversions, especially the MCN conversion at DP and HM and the LCP conversion at HM. This is all the more surprising in view of the fairly featureless crust inferred from the coincident refraction profile [Ruppert et al., 1998; Fliedner et al., 1996]. Although some previous refraction interpretations have included a low-velocity zone [Prodehl, 1979], these are all much higher in the crust than that inferred here. Because those earlier LVZs were inferred using a 1-D interpretation applied to sparsely recorded profiles in heterogeneous terrain, it seems likely that those LVZs were not necessarily real velocity inversions in the crust but instead lateral variations effecting the 1-D interpretation. In contrast, the MCN conversion requires about a 20% downward decrease in the mean S-wave velocity (for vertically traveling S-waves), a difference so drastic that at least a small P-wave LVZ seems required as was discussed above.
The strong MCN conversion exactly overlies a previously inferred crustal-scale shear zone [Wernicke, 1992] that should separate silicic upper crustal rocks from more mafic lower crustal rocks (Figure 10a). The anisotropy of the MCN [Jones and Phinney, 1997] lends additional support to this correlation. Such a contrast should be accompanied by an increase in Poisson's ratio [Christensen, 1996], which is required by the seismic refraction data if we are to minimize the P-wave LVZ. Unless Poisson's ratio is extremely high (>0.36) below the MCN, at least a small P-wave LVZ seems to be required; a decrease in velocity would seem to suggest the presence of fluids or melt. This inference is consistent with that of magnetotelluric work of Park et al. [1996]. Thus joining all the available data implies that a more mafic lower crust containing fluids or melt is separated from an overlying silicic crust by a major shear zone. Because the studies to date of the refraction data have focused on the first arrivals and large, well-understood secondary arrivals such as Pg and PmP, additional examination of these records for energy from the MCN converter would greatly improve our understanding of this intriguing lower crustal feature.
Deployment of 3 short-period arrays of seismometers in the southern Sierra has produced seismic records quite useful in deciphering the structure of the crust and mantle in this region. Simple beam-forming of the seismograms yields stacks that have had scattered energy greatly reduced. The result is that we can obtain higher resolution images of structures within the crust than if we relied on longer-period seismograms. The structures observed reveal profound variations in the S-wave structure both vertically and horizontally; indications of anisotropy and possible crustal melt have been found that might have been inseparable from noise with other deployment strategies. The results obtained complement other experiments of the Southern Sierra Continental Dynamics Project. They also suggest that array deployments of this sort as a tool for looking at crustal structure are (1) substantially more economical than active-source experiments and (2) resolve lateral variations more effectively.
The largest signal on the receiver functions is the Ps conversion from the Moho. Assuming laterally constant crustal seismic velocities (vp = 6.2 km/s and n = 0.255), depths of the Moho vary only slightly from 30.5 to 31.5 km below sea level from DP in the Basin and Range to HM on the Sierran crest. The deepest Moho is ~38 km b.s.l. to the west of the MK array (Table 6), toward the Sierran foothills. These results confirm other studies' results: an Airy crustal root does not underlie the southern Sierra.
Variations in and about the Moho conversion suggest that a complex structure exists at depths between about 30 and 40 km between HM and MK. Judging from changes in the contrast at the Moho, this body appears to have higher velocities to the east than to the west but in either case has a lower velocity than the mantle under the Basin and Range or Sierran foothills. This body coincides spatially with lower Pn velocities [Jones et al., 1994; Ruppert et al., 1998], low lower-crustal and upper-mantle electrical resistivities [Park et al., 1996], and elevated surface heat flow [Saltus and Lachenbruch, 1991]; it also seems to match the region yielding sub-Moho xenoliths lacking garnet and having primarily peridotitic mineralogies [Ducea and Saleeby, 1996]. Taken together, this subcrustal body probably is hot and contains some melt; these are characteristics that should produce positive buoyancy. The absence of similar features under the Basin and Range to the east indicates that equally hot and buoyant mantle is not present towards Death Valley. A deeper high-velocity, low-density body inferred from an earlier study [Jones et al., 1994] did not produce any clear signal but might be responsible for some converted energy from about 60-80 km below the range. This supports the inference that the buoyancy supporting the high elevations of the Sierra originate in the upper mantle and are probably relatively young.
The use of short-period instruments permitted us to observe several intriguing features within the crust. Most noticeable was a major lower crustal downswing (MCN) requiring the top of a large (20% contrast) S-wave low-velocity zone at about 18-23 km b.s.l. at DP and HM. The magnitude of this feature requires both a downward increase in Poisson's ratio (n) and some downward decrease in the P-wave velocity. Variations of conversion amplitudes with backazimuth [Jones and Phinney, 1997] indicate that this conversion is anisotropic, most likely because of minerals elongated along a ENE-WSW orientation. When examined at a crustal scale with results of the refraction experiment [Fliedner et al., 1996; Ruppert et al., 1994; Ruppert et al., 1998], this converter is found to separate fluid-poor silicic (n ~ 0.24, vp ~ 6.1 km/s) rocks from a more uncertain material (n >= 0.28, vp >= 6.4 km/s) containing some combination of more mafic minerals and more fluids. Given that this material also appears to be electrically conductive [Park et al., 1996], that it exactly matches the position of a major crustal shear predicted from geologic reconstructions [Wernicke, 1992; Jones et al., 1992], and that it roots westward toward the hot melt-bearing upper mantle inferred above, we believe that it is melt-bearing mafic lower crust being displaced to the east relative to the upper crust. This system is consistent with earlier suggestions for the relationship between crustal and sub-crustal strains in this region [Wernicke, 1985; 1992; Jones, 1987; Jones et al., 1992]. These observations are the first direct observation of active, large-scale, gently-dipping extensional features continuing underneath adjacent unextended terrain. This strongly indicates that supra- and sub-crustal extension values can be different and that the locus of extensional strain can vary markedly with depth.
This research was supported by grant EAR9120689 from the NSF Continental Dynamics Program. Instruments were borrowed from the IRIS PASSCAL Instrument Centers at Lamont and Stanford, from the University of Nevada, Reno, from the DOE Yucca Mountain Project, from Lawrence Livermore National Laboratory, and from the Air Force Phillips Laboratory. Permits for field operations were obtained through the kind cooperation of Sequoia-Kings Canyon National Park, the United States Forest Service, Lone Pine, CA, and the Bureau of Land Management, Ridgecrest, CA. Chris Parker, Kevin Joyce, Holly Haefele, and Peter Kohn provided unstinting effort in the field. Help in a pinch was provided by S. Ozalaybey, L. Li, and others from the University of Nevada, Reno. Conversations with other members of the SSCD working group helped focus our interpretations. We are indebted to others who have provided computer codes and advice on data management and processing, including T. Owens, G. Abers, D. Harvey, K. Dueker, and D. Quinlan. P. Malin graciously provided copies of unpublished work. Comments of K. Dueker and A. Sheehan improved upon earlier versions of the manuscript. Reviews by an anonymous reviewer and associate editor improved the presentation of this paper.
In the formulation used here, the radial seismogram r is considered to be a product of a forward model matrix G and the receiver function m. The functional relation of r and m is a convolution of m with the vertical component v in the time domain; thus ri = Gij mj = vi-j mj (summing over common indices with i=0 corresponding to the P-arrival). With a damped least-squares inversion, the best-fit solution m is of the form
(1)
where Cdd is the a priori data covariance matrix and Cmm the a priori model covariance matrix [e.g., Tarantola, 1987]. Both a priori matrices are assumed to be diagonal here, and Cmm is assumed to be equal to sm2 I. Because of this formulation, we assign each point of the radial seismogram a meaningful uncertainty (the a priori data covariance). For a beamed seismogram, this is a combination of the noise preceding the P arrival and the standard deviation of the stack at that point. Thus scattered energy, which should vary greatly from trace to trace, should have a large associated variance and therefore will not be weighted so heavily as those portions of the seismogram that are coherent over the array and thus probably reflect large structures at depth. We could (but do not here) also include the size of the envelope of the transverse component as part of the error in the radial component if we wish to emphasize those features most closely matching the assumptions of a laterally uniform, isotropic Earth.
In principle, the a priori model covariance can be estimated from known constraints,
yielding a unique solution to (1). A maximum expected SV conversion equal
in amplitude to about 50% of the radial component of the P wave would
produce a receiver function amplitude of about 0.15. We then expect that the
standard error on our starting model of no converted energy to be less than
or about 0.15. It is unrealistic to expect perfect, single-sample spikes to
emerge from the deconvolution owing to the limited frequencies present in the
raw seismogram; we thus suggest that this estimate be divided by about a factor
of 10 (suggesting a pulse width of about 0.5 s) to be about 0.015. Alternatively
we can employ an empirical estimate: minimize the model length while not increasing
significantly the model misfit e. We choose to measure model length as
![]() and
e as the square root of the variance of the absolute difference between
the radial seismogram and the convolution of the vertical seismogram with the
model. We find from plotting L against e that values of sm
between about 0.01 and 0.05 bound the range where model length and misfit are
optimized, very much in line with our a priori estimate. We choose a value of
sm of 0.02 for receiver functions of single-event beams.
and
e as the square root of the variance of the absolute difference between
the radial seismogram and the convolution of the vertical seismogram with the
model. We find from plotting L against e that values of sm
between about 0.01 and 0.05 bound the range where model length and misfit are
optimized, very much in line with our a priori estimate. We choose a value of
sm of 0.02 for receiver functions of single-event beams.
We are generally uninterested in high-frequency signals in the resulting receiver function, so we filter the resulting receiver function by convolving it with a triangle function 10 points (0.5 s) wide at the base. We also apply this to the full a posteriori model covariance matrix, thus retaining the errors propagated through the inversion from the input uncertainty expressed in the a priori data covariance matrix. We have found that the standard error of the final receiver function is considerably lower than that expected through simple propagation of the standard errors in the unfiltered receiver function; this is because points within about 3-7 points (0.15-0.35 s) of one another have significant anticorrelations that collapse when the triangle filter is applied. We feel that this processing projects a realistic estimate of the uncertainty of the receiver function and emphasizes those features that most merit interpretation. Furthermore, use of the off-diagonal elements of the a posteriori covariance matrix permits identification of a filter that optimizes the temporal resolution of the receiver function while removing spurious higher-frequency signals.
Bateman, P. C., and J. P. Eaton, Sierra Nevada Batholith, Science, 158, 1407-1417, 1967.
Buck, W. R., Flexural rotation of normal faults, Tectonics, 7, 959-973, 1988.
Byerly, P., Near earthquakes in central California, Bull. Seismol. Soc. Am., 29, 427-462, 1939.
Christensen, N. I., Poisson's ratio and crustal seismology, J. Geophys. Res., 101, 3139-3156, 1996.
Tarantola, A., Inverse Problem Theory, Elsevier, New York, 1-613, 1987.
[2] The migrated receiver functions, interpolated to a common depth grid, are available as an electronic supplement to this paper.
C. H. Jones | CIRES | Dept. of Geological Sciences | Univ. of Colorado at Boulder
0 visits from