 |

|
| Home | Systems | Research | Publications | People | Contact |
| RESEARCH GROUPS @ CIRES > |
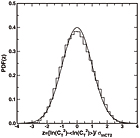
Turbulence Variability
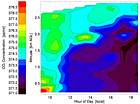 CO2 Concentrations
Trace Gases
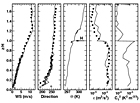
 NBL Structure |
Research Applications
|

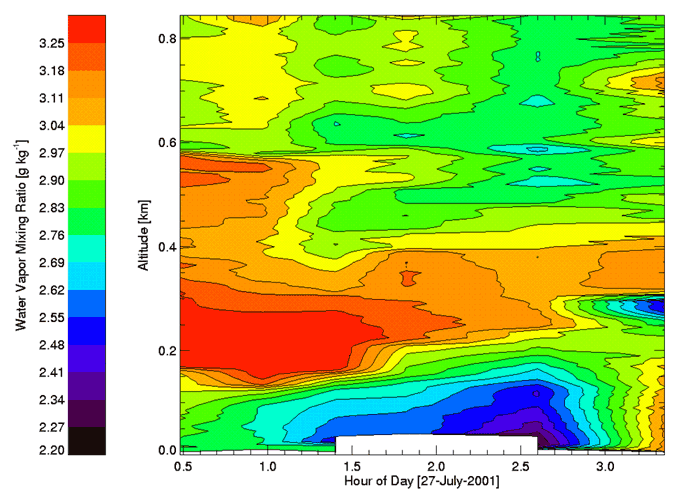
 Click on image for larger version. |
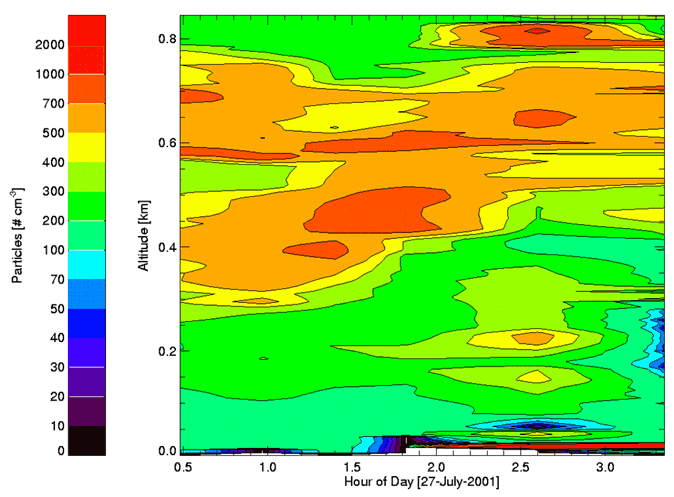
 Click on image for larger version. |
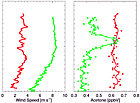
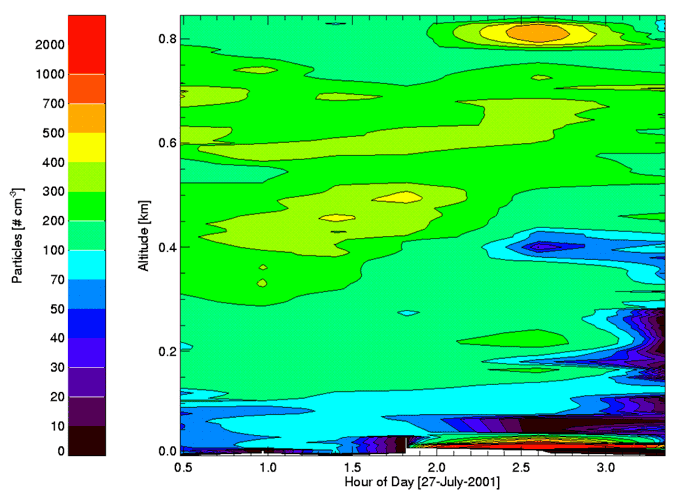
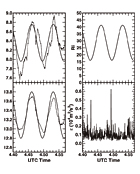
Total (i.e. all sizes) Aerosol Particle Count
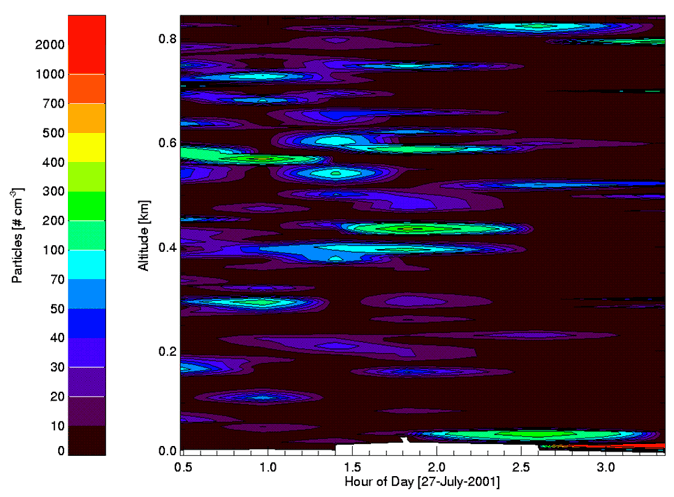
 Click on image for larger version. |
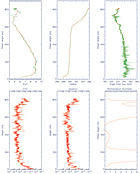
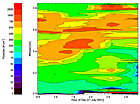
Aerosol Particle Count for Various Sizes
~20 nm:
 Click on image for larger version. |
~40 nm:
 Click on image for larger version. |
~100 nm:
 Click on image for larger version. |
~300 nm:
 Click on image for larger version. |
For more information, contact Mike Jensen at jensenm@cires.colorado.edu
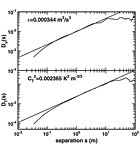
Turbulence Statistics
Aerosol Distribution
Field Verifications
Wave-Turbulence Inter