 |

|
| Home | Systems | Research | Publications | People | Contact |
| RESEARCH GROUPS @ CIRES > |
Turbulence Variability
 CO2 Concentrations
Trace Gases
 NBL Structure |
Research Applications
|
 Click on image for larger version. |
 Click on image for larger version. |
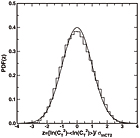
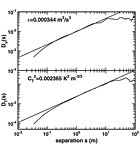
Note: The small amplitude altitude variations of the package have a negligible effect on the results as Taylor’s frozen hypothesis is valid for this 30 minutes-long time interval ( ![]() ). The estimation error for each measurement is less than 15% and the variability in ε and CT2 is from true atmospheric turbulence fluctuations.
). The estimation error for each measurement is less than 15% and the variability in ε and CT2 is from true atmospheric turbulence fluctuations.
For further details see the related publication:
2004 - Frehlich R, Meillier Y, Jensen ML, et al.: "A statistical description of small-scale turbulence in the low-level nocturnal jet". Journal of the Atmospheric Sciences 61 (9): 1079-1085 May 2004.
Turbulence Statistics
Aerosol Distribution
Field Verifications
Wave-Turbulence Inter