Research Applications
Turbulence Statistics
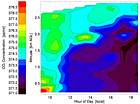
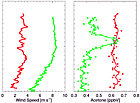
Accurate measurements of turbulence statistics require sufficiently long stationary time series. Such data were collected by the TLS while it was parked at constant altitude in the shear region below a ~6 m s-1 nocturnal jet.
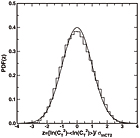
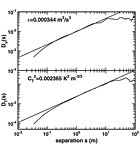
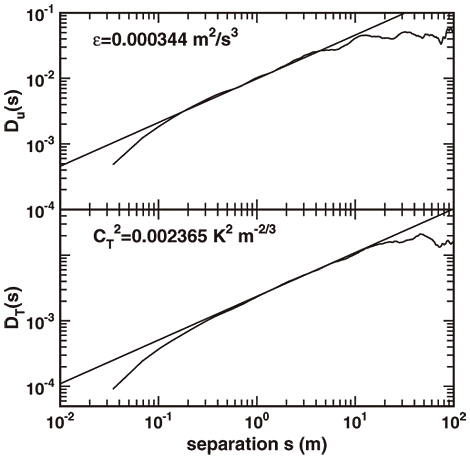
In general, the small-scale statistics of the velocity and temperature fields are well described by their structure functions DU(s) and DT(s) from which various statistics are computed: dissipation scales ηU and ηT, outer scales LU and LT, temperature structure constant CT2, energy dissipation rate ε, and temperature and velocity variances σU and σT.
The structure functions shown below were computed from 10 seconds-long time series of the 200 Hz TLS temperature and velocity signals. Each regime can be clearly identified on these plots:
- The s2/3 scaling in the inertial range (η < s < L):
Du(s) = CK ε2/3s2/3 ; DT(s) = CT2s2/3
- The s2 scaling in the dissipation range (s < η):
Du(s) = (ε / 15 υ) s2 ; DT(s) = (N / 3 χ) s2
- The flat region at large separations (L < s) where:
LU = σ U2 / ε ; LT = 23/2 σ T3 / CT3/2
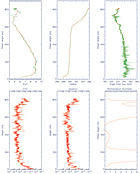
These structure functions provide estimates of key turbulence statistics: CT2, ε, ηU, ηT, LU, LT, l0 and lU. Note that estimates of the turbulent kinetic energy (TKE) can be deduced assuming isotropy from CT2, ε, LU, and LT, using:

Click on image for larger version.
For further details see the related publication:
2004 - Frehlich R, Meillier Y, Jensen ML, et al.: "A statistical description of small-scale turbulence in the low-level nocturnal jet". Journal of the Atmospheric Sciences 61 (9): 1079-1085 May 2004.
|