|
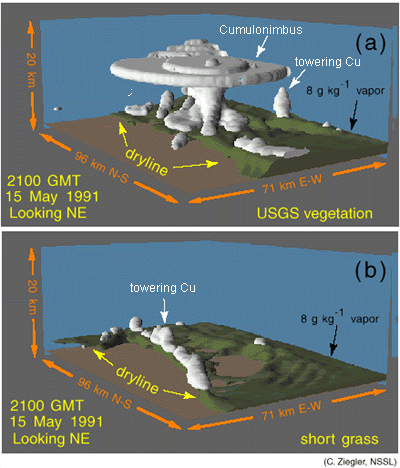
Figure 12: (a) and (b) Model output cloud and water vapor mixing ratio fields on the third nested grid (grid 4) at 21 GMT (Greenwich Mean Time) on 15 May 1991. The clouds are depicted by white surfaces with q_c = 0.01 g/kg, with the sun illuminating the clouds from the west. The vapor mixing ratio in the planetary boundary layer is depicted by the grey surface with q_v = 8 g/kg. The flat surface is the ground. Areas formed by the intersection of clouds or the vapor field with lateral boundaries are flat surfaces, and visible ground implies q_v < 8 g/kg. The vertical axis is height, and the backplanes are the north and east sides of the grid domain (from Pielke et al. 1997).
|