Indonesia/Nicobar/Andaman Earthquake (updated 6 May 2005)


Mw=9.0 NEIC Epicenter 3.32¡N, 95.85¡E Sunday, December 26, 2004 at 00:58:53 GMT (7:58:53 AM local time at epicenter)

Mw=8.7 2.08¡N 97.01¡E A shallow thrustearthquake occurred28 march 2005 between the 1861 rupture and the December 2004 rupture. The earthquake released about ten times less energy than the December earthquake. Within the first few hours aftershocks had occurred over a 200 km zone as far south as the equator. (see map below). Shaking was severe on offshore islands (Nias), but the tsunami amplitude was less than 1 m.


Kurz 1866- a difficult to find article on the Andaman Islands. Kurz pdf

HTML Article summarizing 26 December 2004 earthquake rupture in the Andaman and Nicobar Islands: pdf download (740k)

GPS sites measured Dec-March

Preliminary CESS GPS solutions

Rupture 1600 km to north, >130 km downdip . Preliminary rupture area 180,000 sq km.

Deathtoll 298,055 (Guardian 29 Jan 2005)

(228,948 Indonesia, 43,382 Sri Lanka, 16,389 India, 8.506 Thailand


Regional Setting

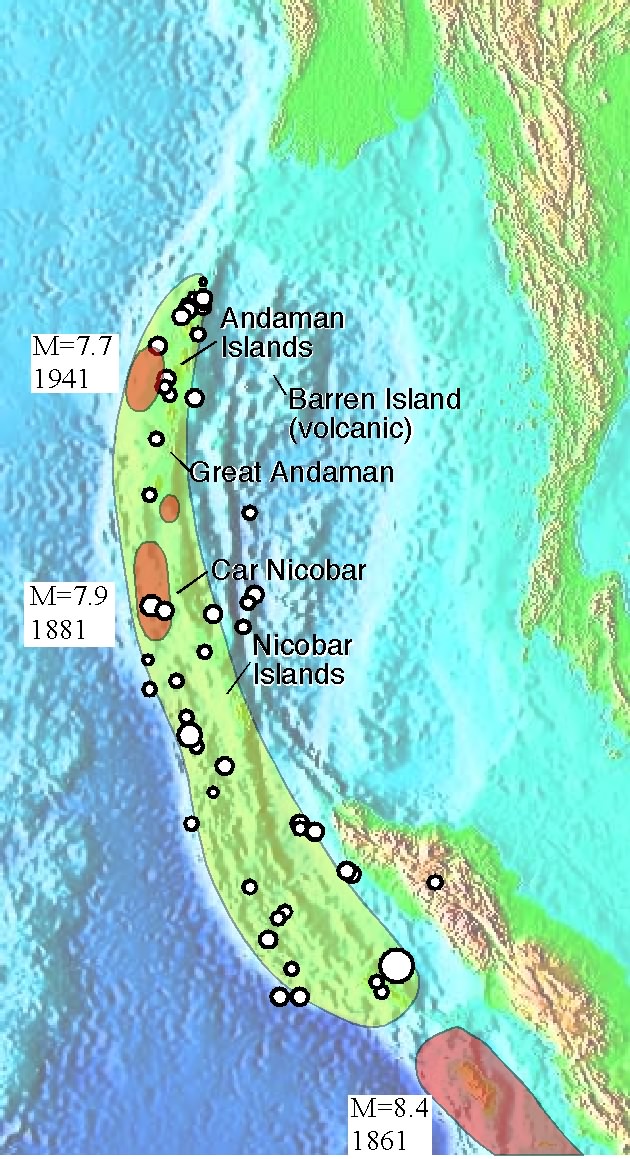
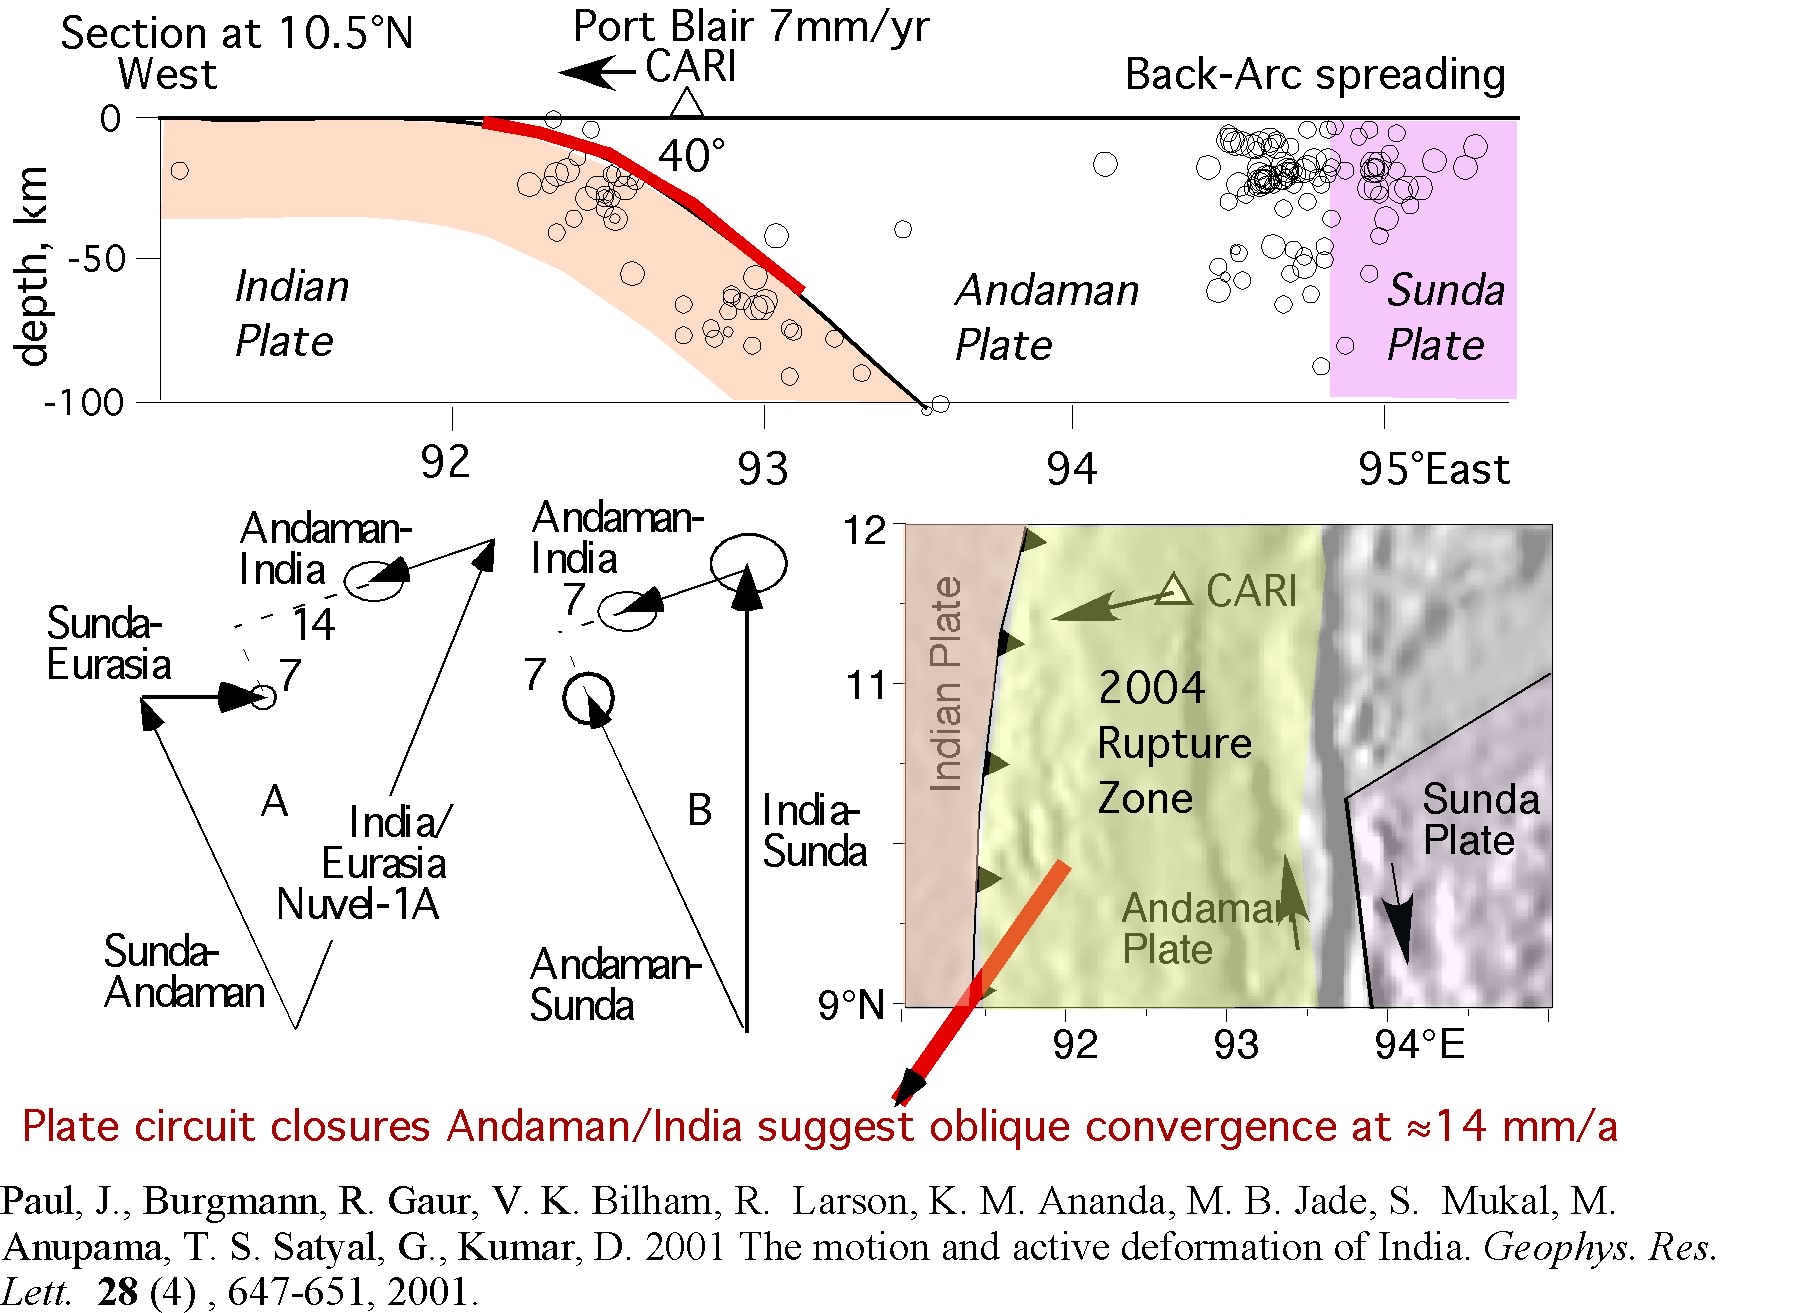
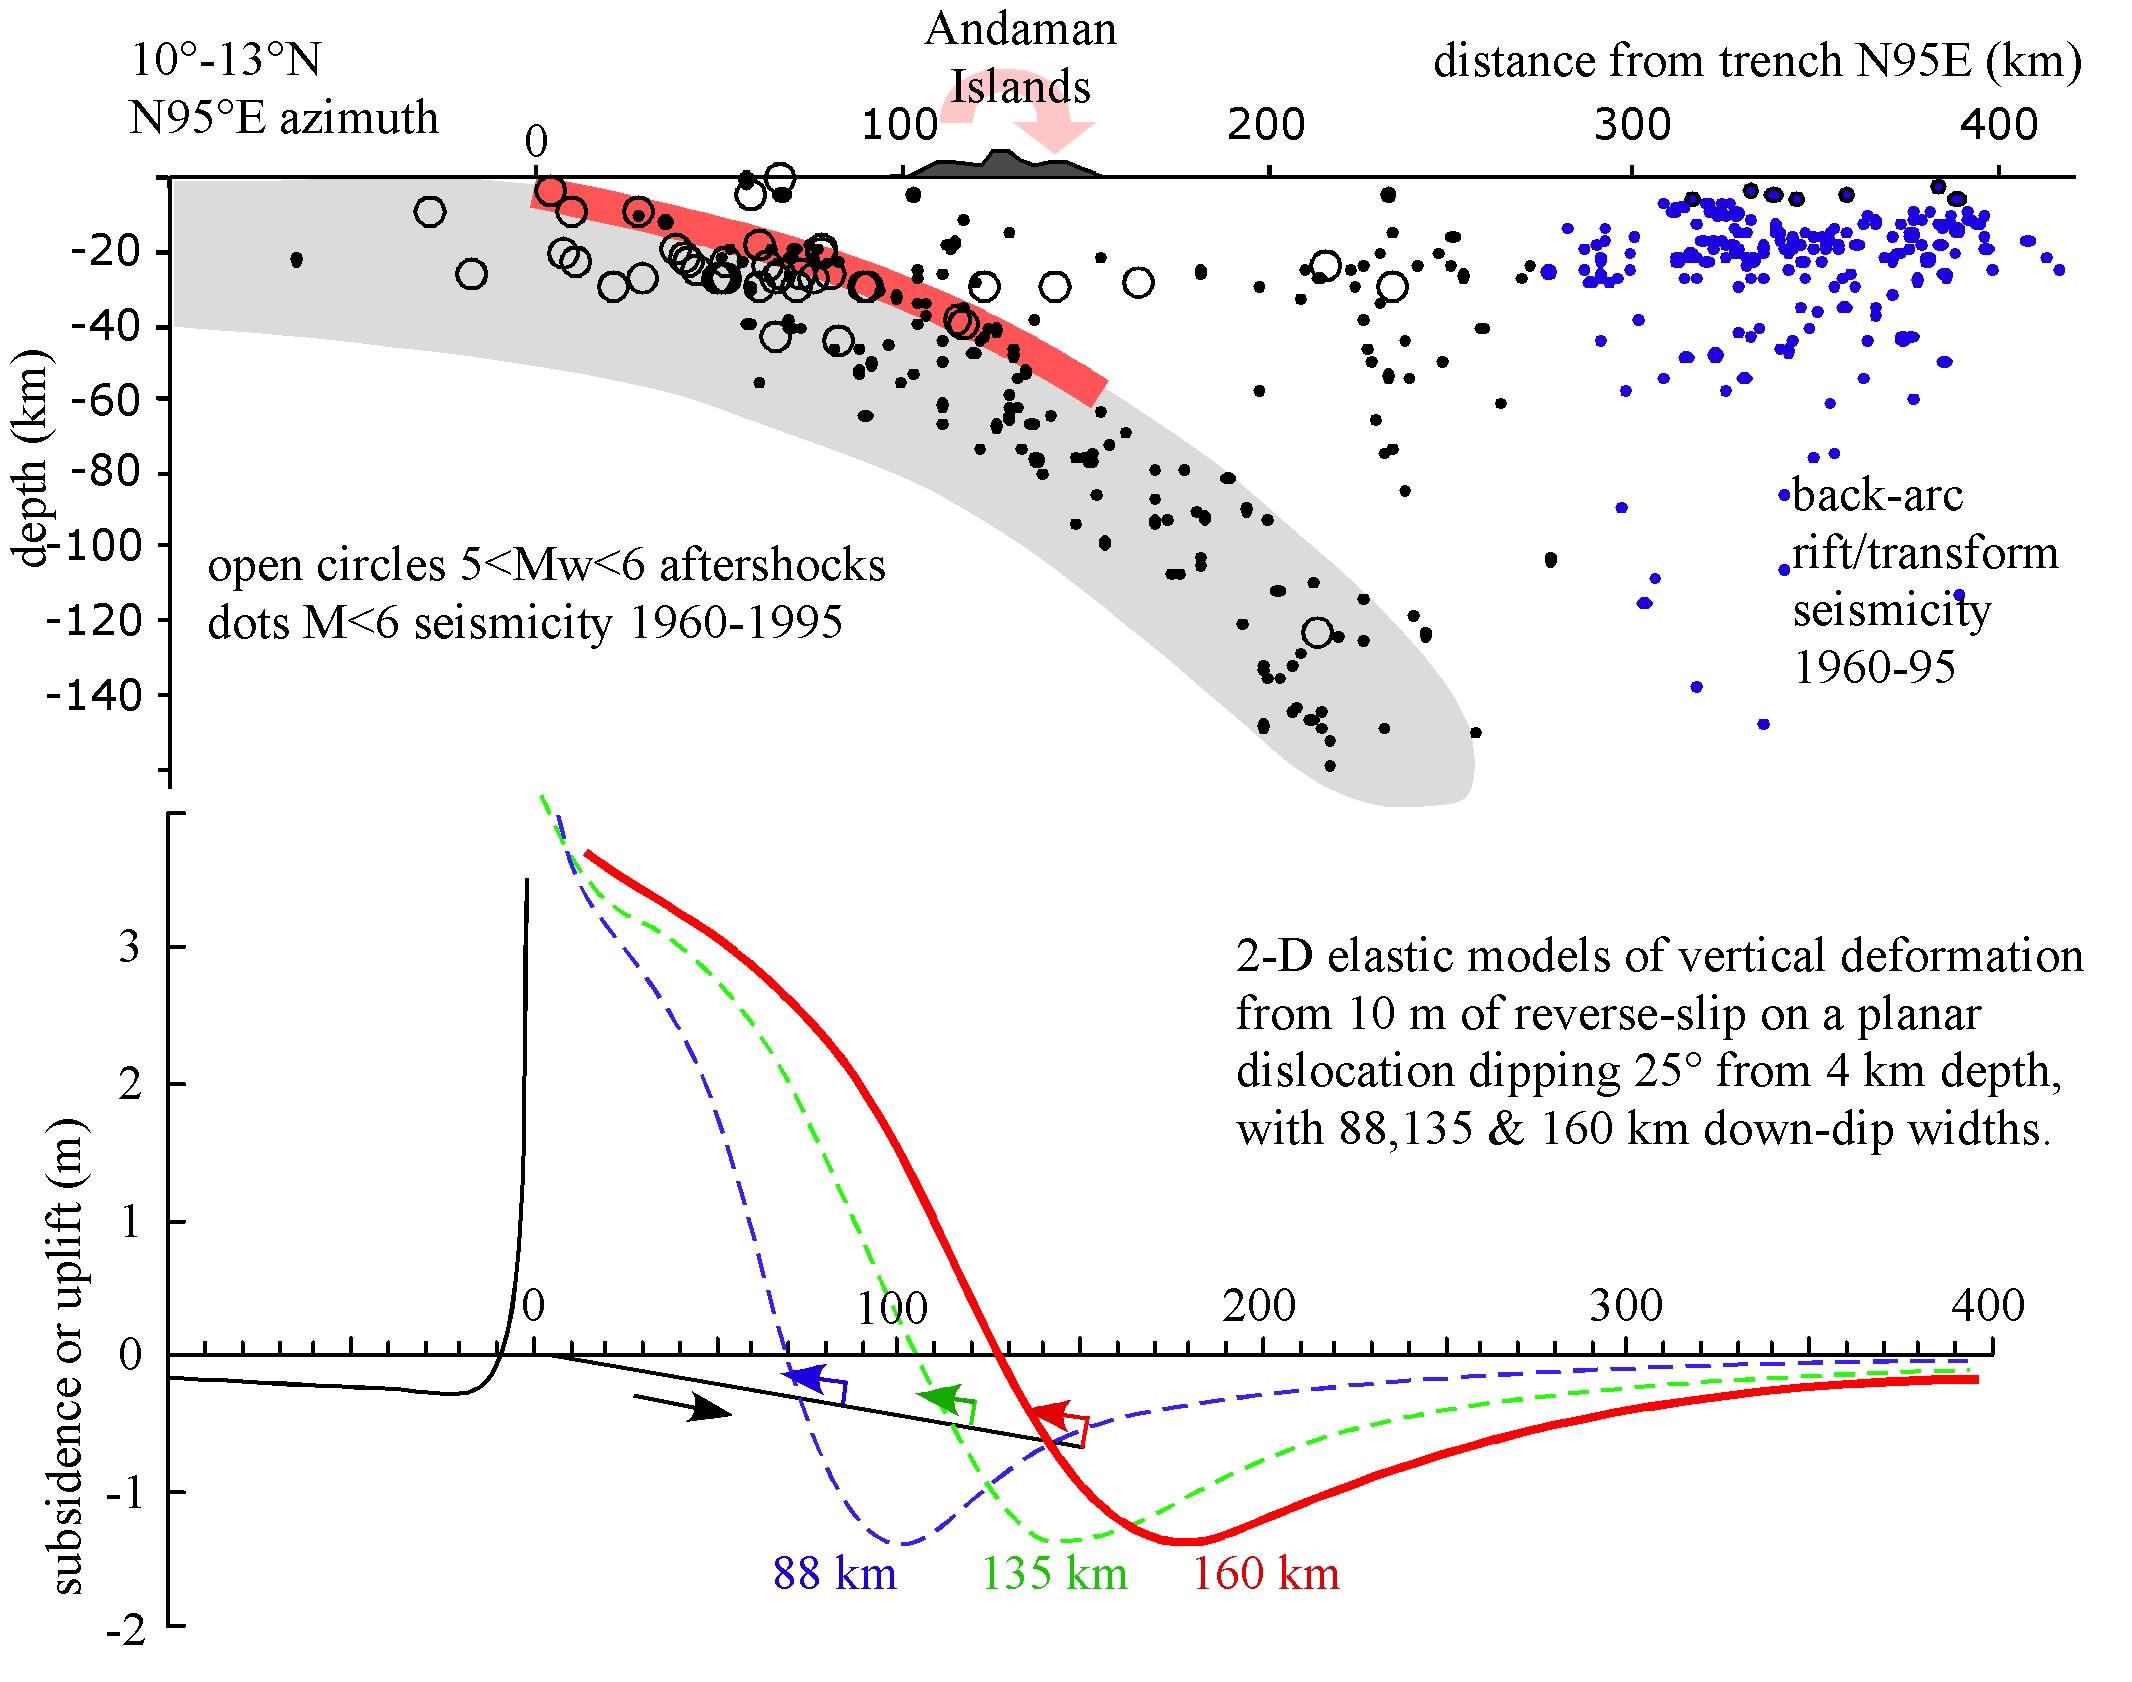
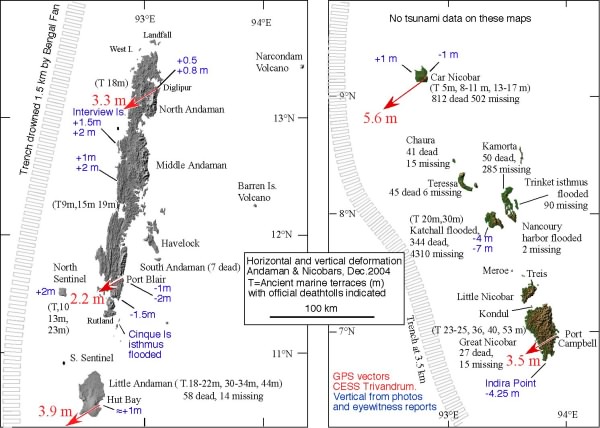
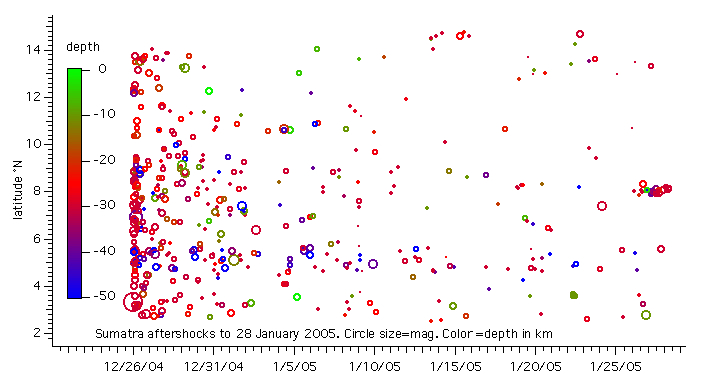
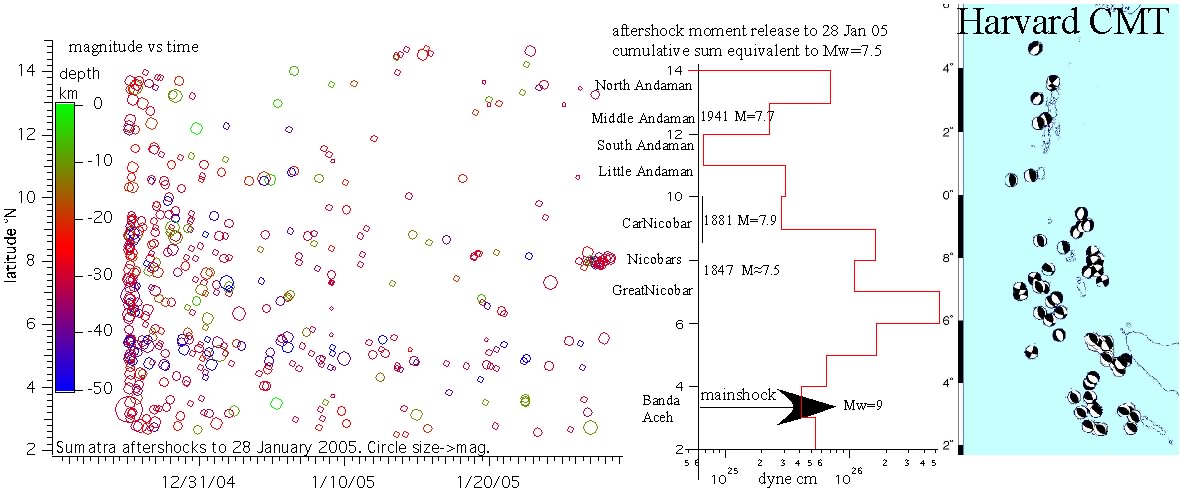
The earthquake ruptured >1300 km of India's eastern plate boundary, and although several MÅ8 earthquakes have occurred there, its M=9.3 magnitude has no historical precedent. The plate boundary separates the NE moving Indian plate from the Andaman Plate (also known as the Burma microplate).  Direct measurements of convergence in the Northern Andamans are imprecise but the relative velocity appears to be Å14 mm/year.  Some of this relative displacement is manifest as strike-slip motion on the submarine Andaman fault to the east, on which aftershocks have been occurring since 26 Dec. For general, and recent, seismic information consult Stacey Martin's ASC page. The map below shows the 2004 rupture and the approximate locations of ruptures in 1847, 1881 and 1941 (see relocated aftershocks and rupture zones in Bilham et al. (2005). Although the high frequency p-wave train, aftershocks, and surface deformation, indicate plate boundary slip occurred for almost 1300 km, the bulk of the plate-boundary displacement propagated much slower than the seismic rupture and was manifest as deep rapid afterslip. Click map for larger image showing the location of the 1861 Sumatra rupture. The main rupture exceeded 160 km in width and occurred on the shallowest part of the subduction zone from 4 km to approximately 50 km depth, largely to the west of interseismic seismicity in the past century .

IRIS special event page

KOSHIMURA tsunami info page

Kerry Sieh's reports from the epicenter

Geological Survey of India Field Report 12 Jan (1Mb pdf)


GPS data from the Andamans are scarce because most of the region is off-limits to visitors and especially to foreigners. Five pre-earthquake points have been recovered by CESS Trivandrum. These data indicate surface displacements of 3-6 m horizontally and +.6 to -1.5 m horizontally. The true slip on the subsurface plate may be estimated by resolving the trench parallel and trench normal components, and then by estimating downdip-displacements on a curved plate of specified geometry. With only one point every 130-170 km along the arc 2-D elastic -half-space solutions are adequate. The average slip in the Andamans is 7-8 m, while the average slip in the Nicobars is 15-19 m. The data are consistent with a hinge line (the line separating western uplift from eastern subsidence) running to the east of Diglipur and Hut Bay, but to the west of Port Blair, and the two Nicobar locations. Rupture parapmeters suggest widths of 123-150 km with a total moment release north of the Nicobar islands equivalent to Mw=9.01.

Ups & downs in the Andamans: map below shows regions uplift and subsidence caused by the earthquake, separated by neutral axis (dashed line). The contours are based on GPS constrained models of deformation above a flexed plate, and on observations of flooding and emergence of shorelines. The low near Teressa Island, where field constraints are sparse, is probably incorrect, but the map will improve as more data are gathered. Uplift is less than 2 m everywhere. Arrows indicate plate interface slip vectors (max 16 m). TRhe hatched region indicates the location of inferred rupture.

Andaman plate motion. Published data from Port Blair, the capital of the Andaman Islands indicate oblique interseismic convergence of 14±4 mm/year with India (Paul, J et al., Geophys. Res. Lett.  28 (4) , 647-651, 2001 ). Port Blair is within the deforming plate boundary and it has been possible to estimate an improved convergence rate with Inda assuming that the interseismic locking line is the same as the eastern edge of the 2004 rupture. The convergence rate depends on the precise curvature of the subducting Indian plate but preliminary estimates are that convergence may exceed 40 mm/year.

POST SEISMIC GPS .list of sites.


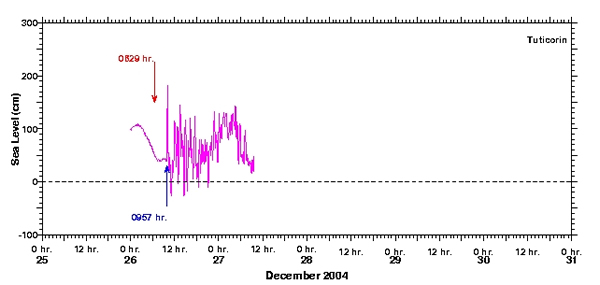
The tsunami was recorded at several Indian tide gauges and by a depth sounder operating near the Thai coast. Serendipitously, the tsunami wave was monitored by NOAA, Nasa and French satellites providing strong constraints on its source parameters.Tsunami damage was aggravated on the east cost of India because the main surge occurred near high tide. The 1.5 m surge that occurred at low tide at Tuticorin (southernmost India) had it occurred at high tide would have resulted in more severe damage there. Synthetic models of the ocean wave been calculated by Kenji Satake and by scientists at NOAA. A model computed by Modesto Ortiz (CICESE) constrained by the Vishakaptnan tide-gage record indicates that the first tsunami broadside propagated from a 600-650 km rupture, slowing south of Car Nicobar, the location of the 1881 rupture. Models of the rupture developed by Hirata et al suggest slow uniform rupture, consistent with deformation at Port Blair delayed by at least 45 minutes,i.e. later than the arrival time of the tsunami there. The 1881 tsunami is modelled by Ortiz & Bilham, (2002 pdf).


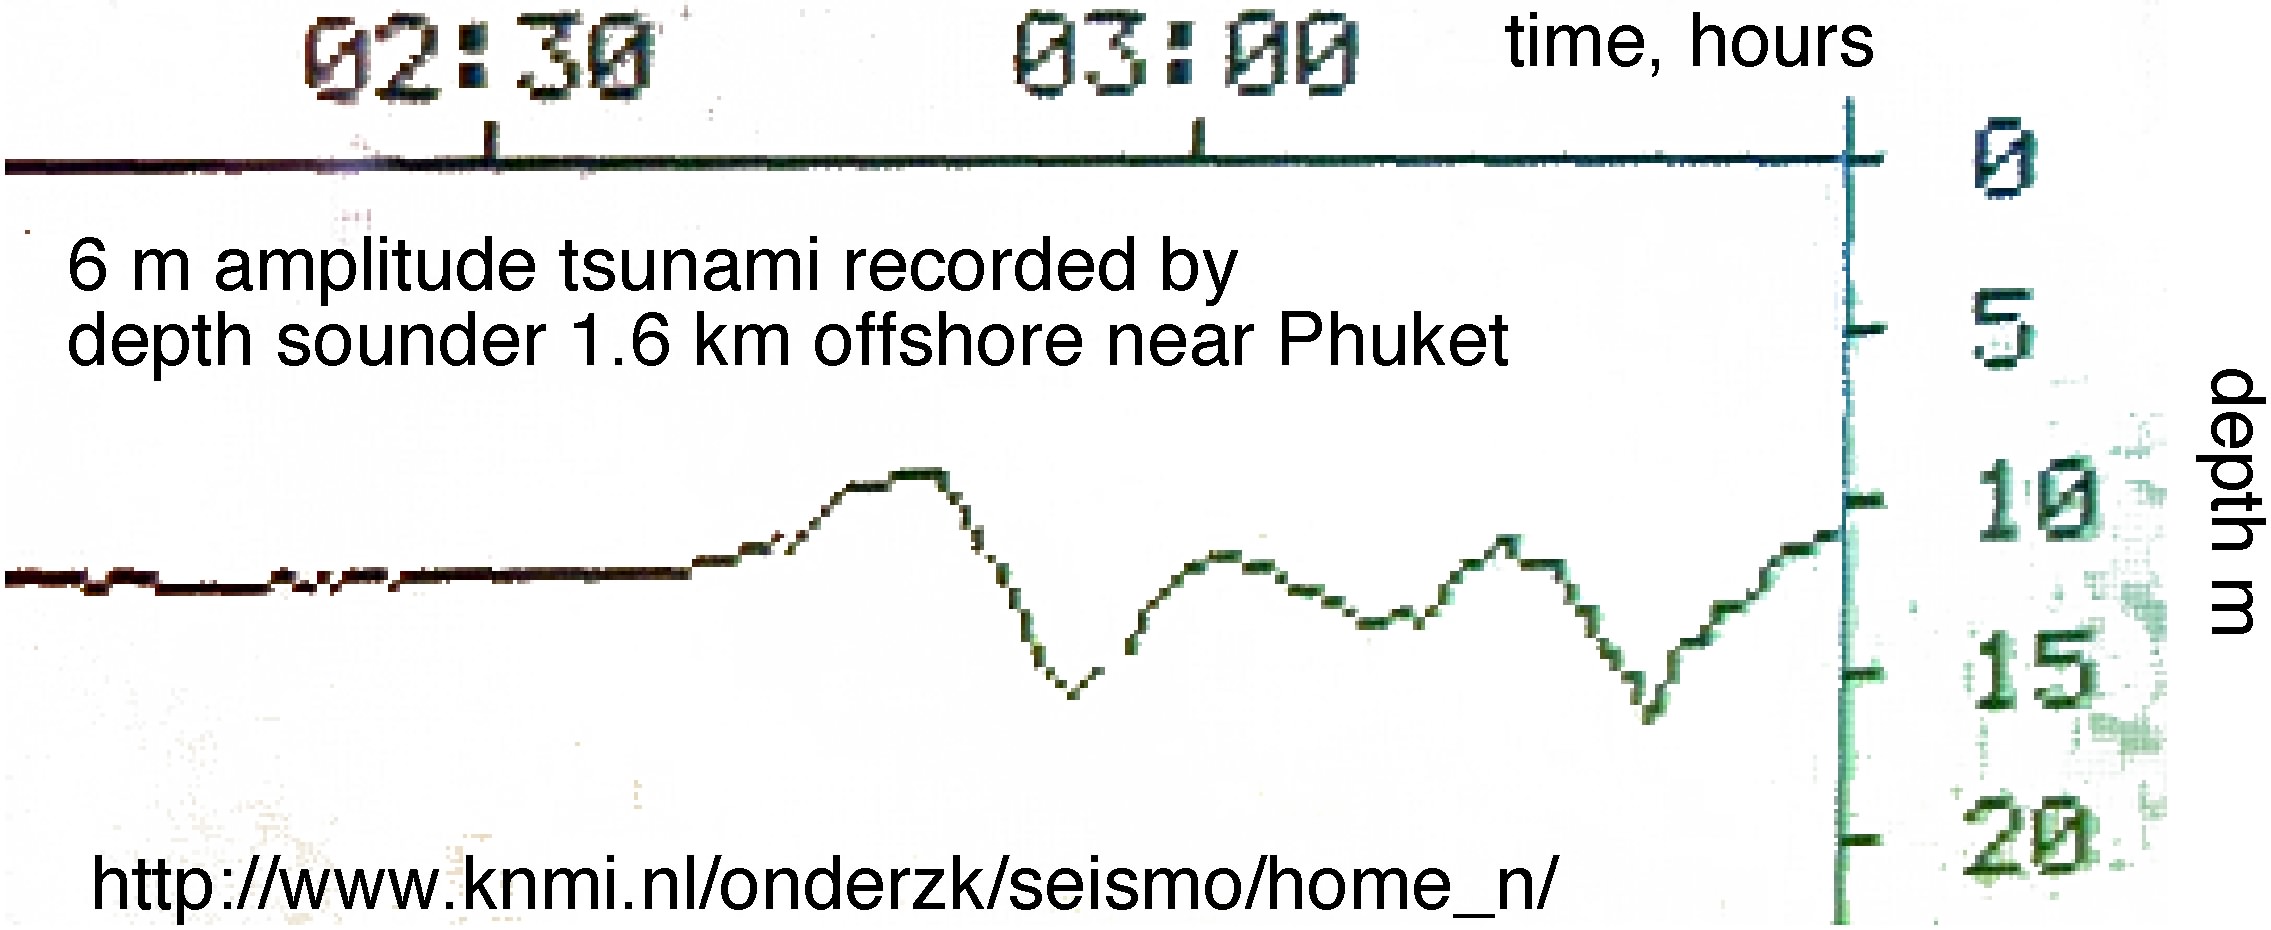
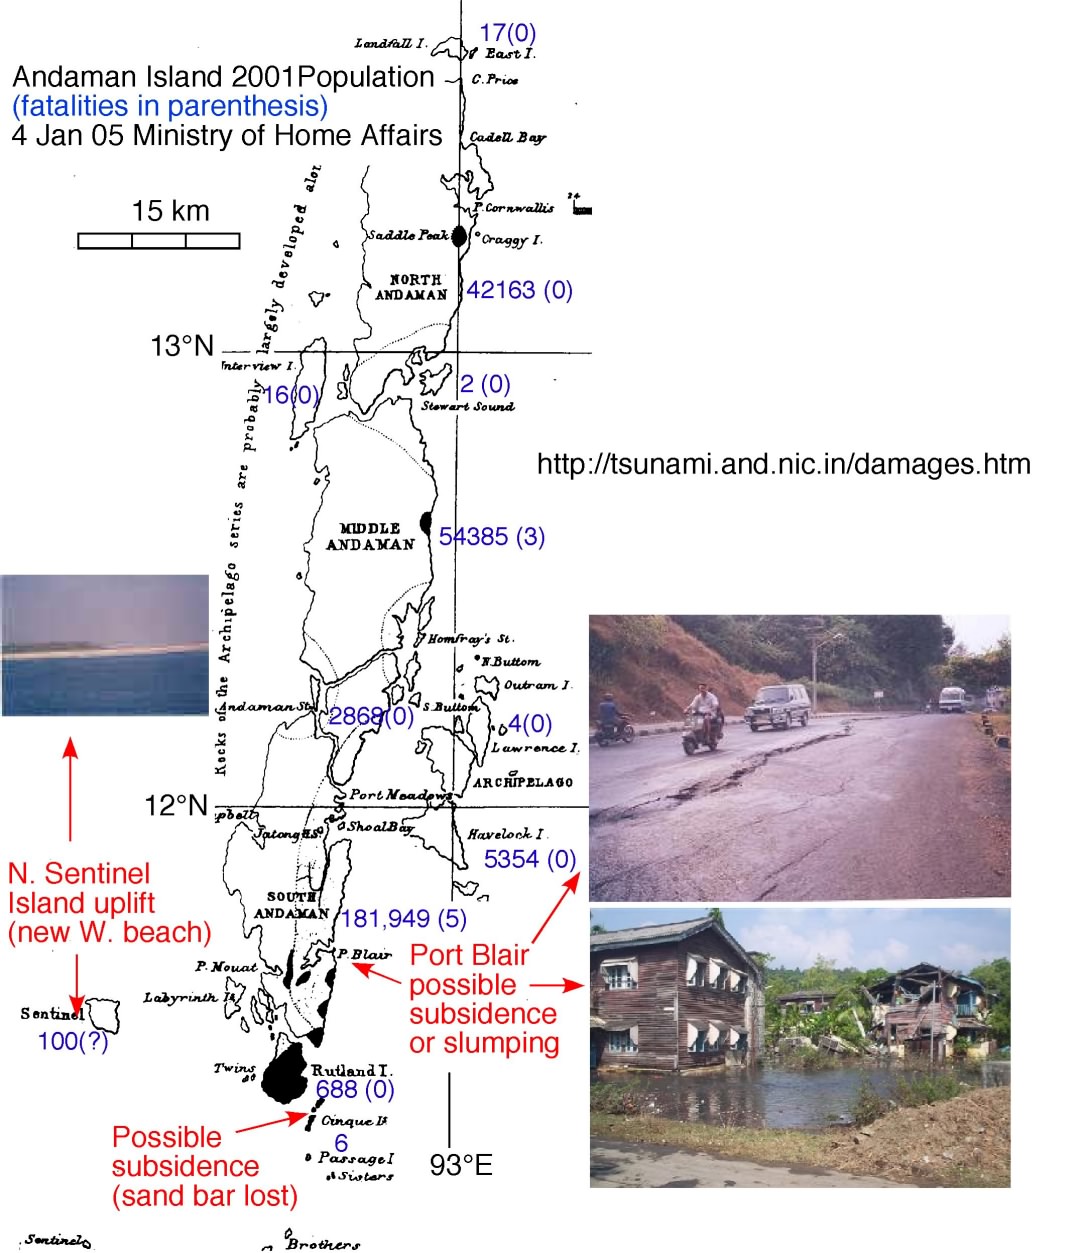
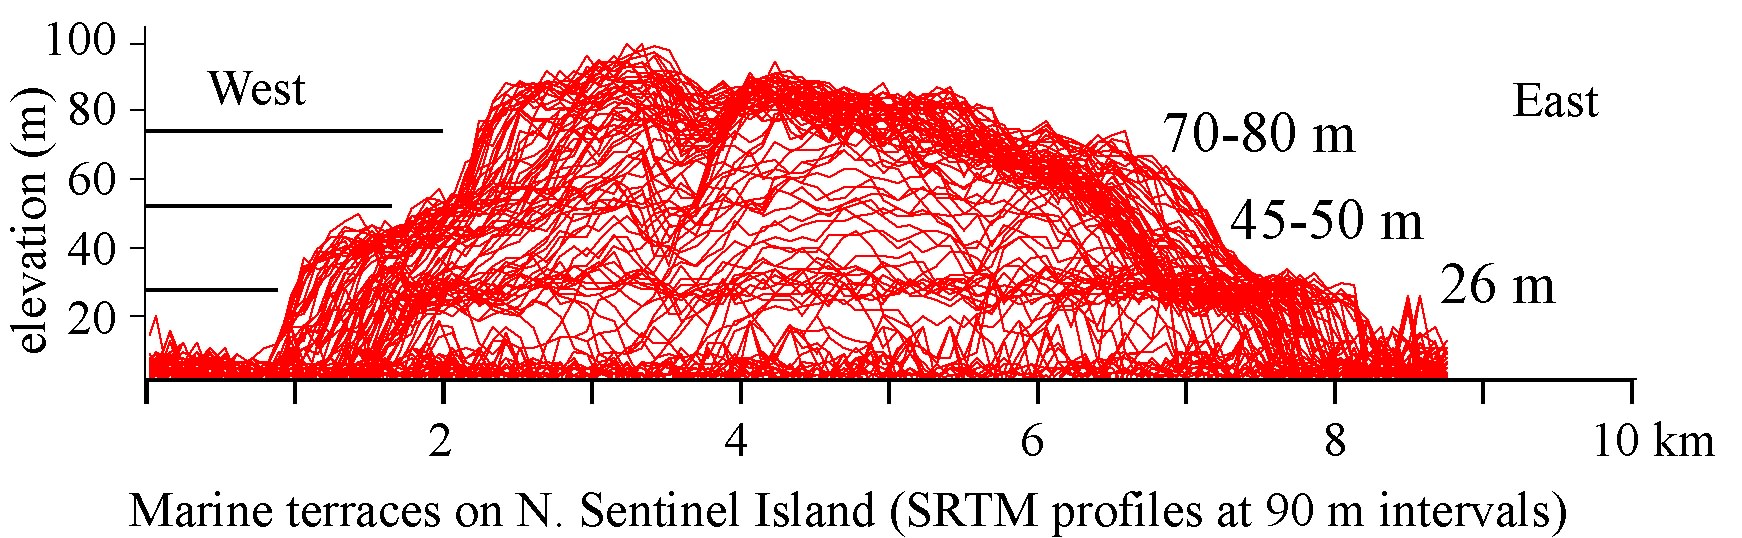
Intensity data from the islands remain sparse, and although shaking intensities on the whole appear to have been low, reports from Rutland island (John Paul) indicate that people had difficulty standing, that grass roots were pulled from the ground by people trying to stabilize themselves, and that they incurred a feeling of nausea. This suggests local Intensities greater than VIII.

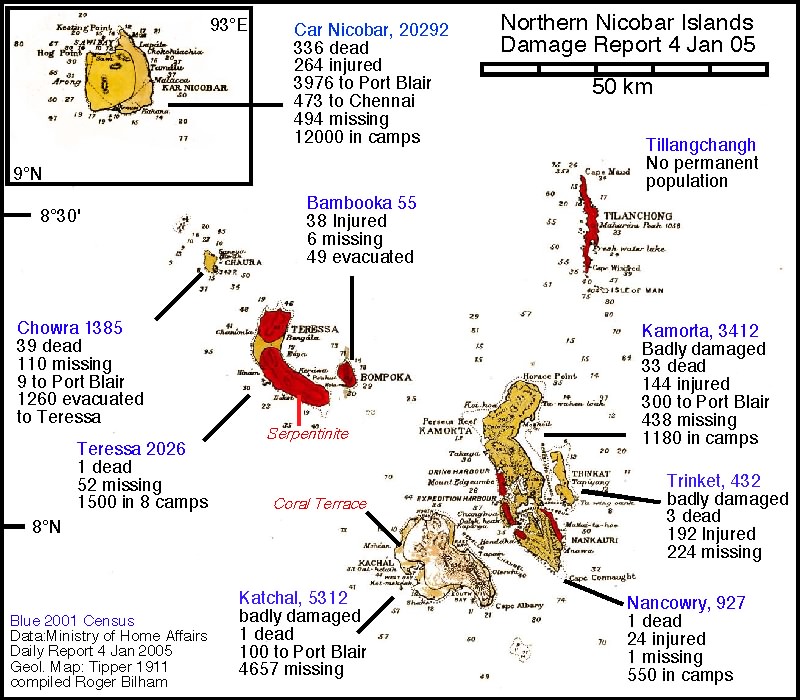
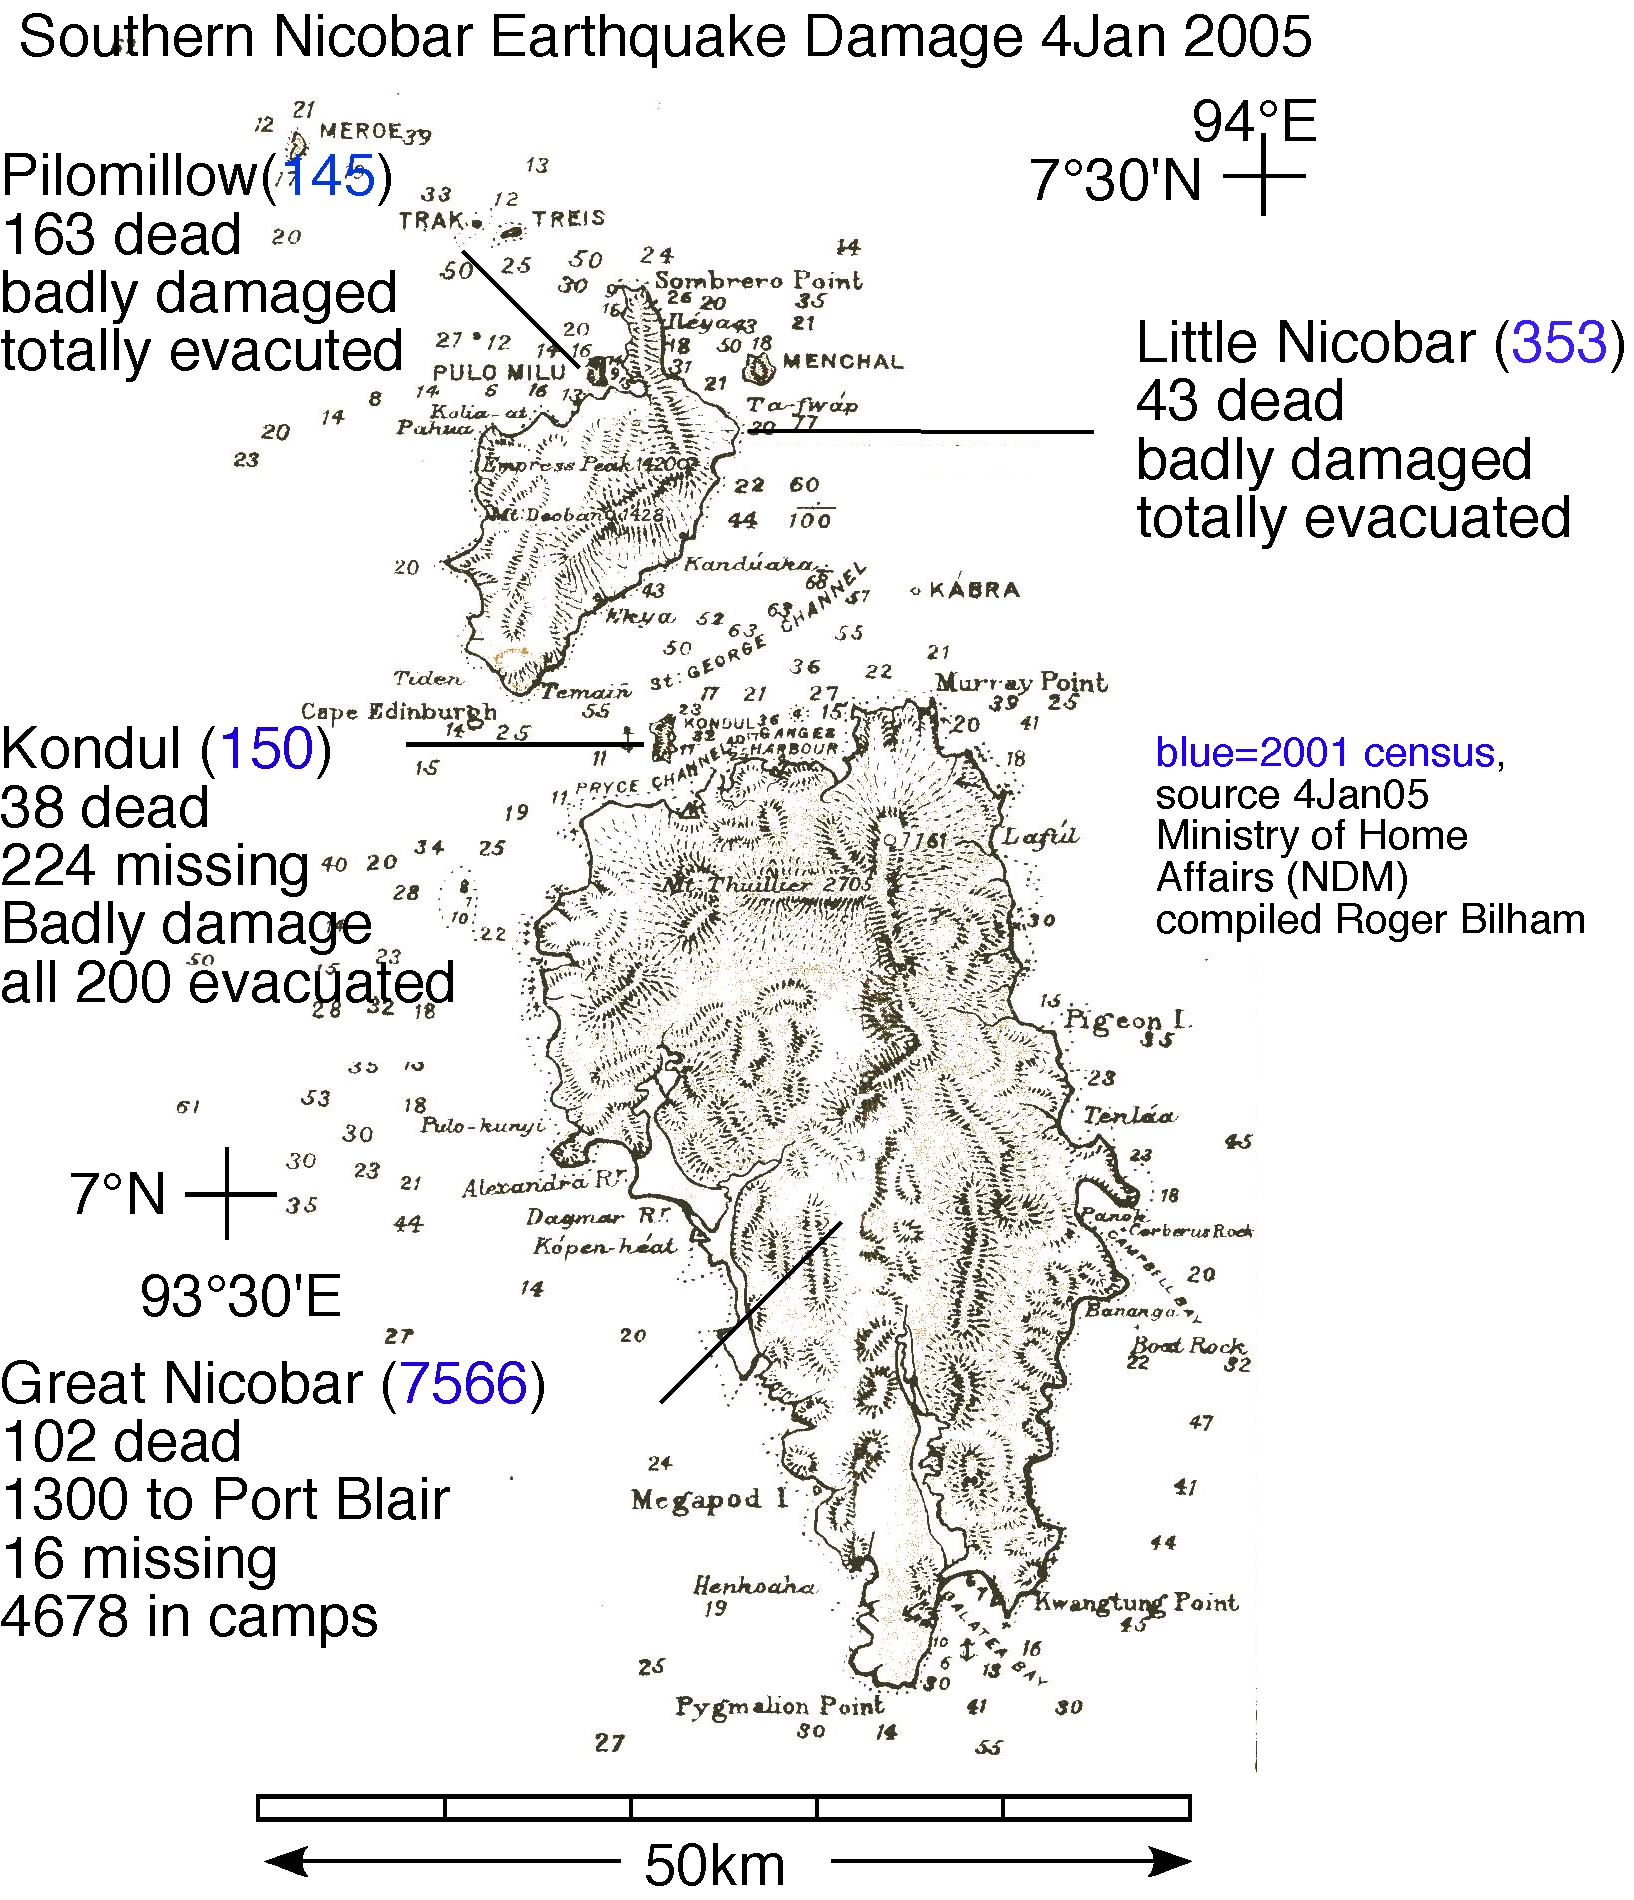
DAMAGE REPORTS http://tsunami.and.nic.in/damages.htm: 16 Jan 5625 missing,Andaman casualties & Nicobar casualties

Great Nicobar casualty map Early map of Pilomillow, heavily damaged small island on NE coast of Little Nicobar, now totally evacuated. USGS Intensity Reports and Preliminary Intensity Map based on local reports (ASC) .


  2004 Rupture Zone and re-rupture of Historical Ruptures.Aftershocks following the 2004 rupture suggest that the rupture zones of the 1847, 1881 and 1941 earthquakes have re-ruptured during the recent earthquake. A recurrence interval for 1881-sized earthquakes of 157±43 years (AD 1995 to 2081)was considered possible, and partial slip was thus not unexpected. The revised convergence rate derived above (>40 mm/year means that almost 5 m of potential slip existed near Car Nicobar prior to the earthquake. Uplift of the western shores of the Andaman Islands and Car Nicobar, and subsidence of their eastern shorelines indicates that the main rupture was 140-160 km wide (down-dip). Tilt of of Car Nicobars by approximately 1 m is consistent with >10 m of reverse slip. Uniform slip of 10 m on a patch 1300km x160km corresponds to Mw=9.2. Slip was larger in the south (up to 23 m), and this preliminary result is consistent with a Mw=9.3 earthquake. The calculated subsidence signal is independent of any strike-slip component, which, unlike in the Nicobar Islands, is inefficiently partitioned in the northern Andamans. GPS data in the Andamans (CESS) suggest up to 30% of strike-slip motion occurred along the arc.

The above figure illustrates the importance of the line separating uplift and subsidence in determining the width of the rupture zone. In fact the planar model shown doesnot accurately depict uplift and subsidence above the curved plate interface that slipped in 2004.

The next figure illustrates the entire earthquake cycle on a curved plate with a locking line at 40 km depth. The displacement vectors are calculated on a 10 km grid using Coulomb 2 (Toda Stein and King). The upper panel shows interseismic convergence and uplift (slip on the red line), and the center panel shows the deformation field during the earthquake (slip on the shallow red line). The same slip is shown in each case indicating that interseismic subsidence is half that of cosesimic uplift in the western islands, and interseismic uplift far exceeds coseismic subsidence in the east. The red triangle is Port Blair, and the axis separating coseismic uplift and subsidence passes close to Havelock Island that was not shifted vertically in the earthquake. The neutral axis defining maximum tilt (500 nanorad/year interseismic) passes to the east of Port Blair in the interseismic period, explaining why kitchen middens on the shore 20 km east of Port Blair remained undisturbed for hundreds of years. Note the axis of cumulative uplift for the entire cycle (lower panel) should result in uplift of all the islands, as is observed.


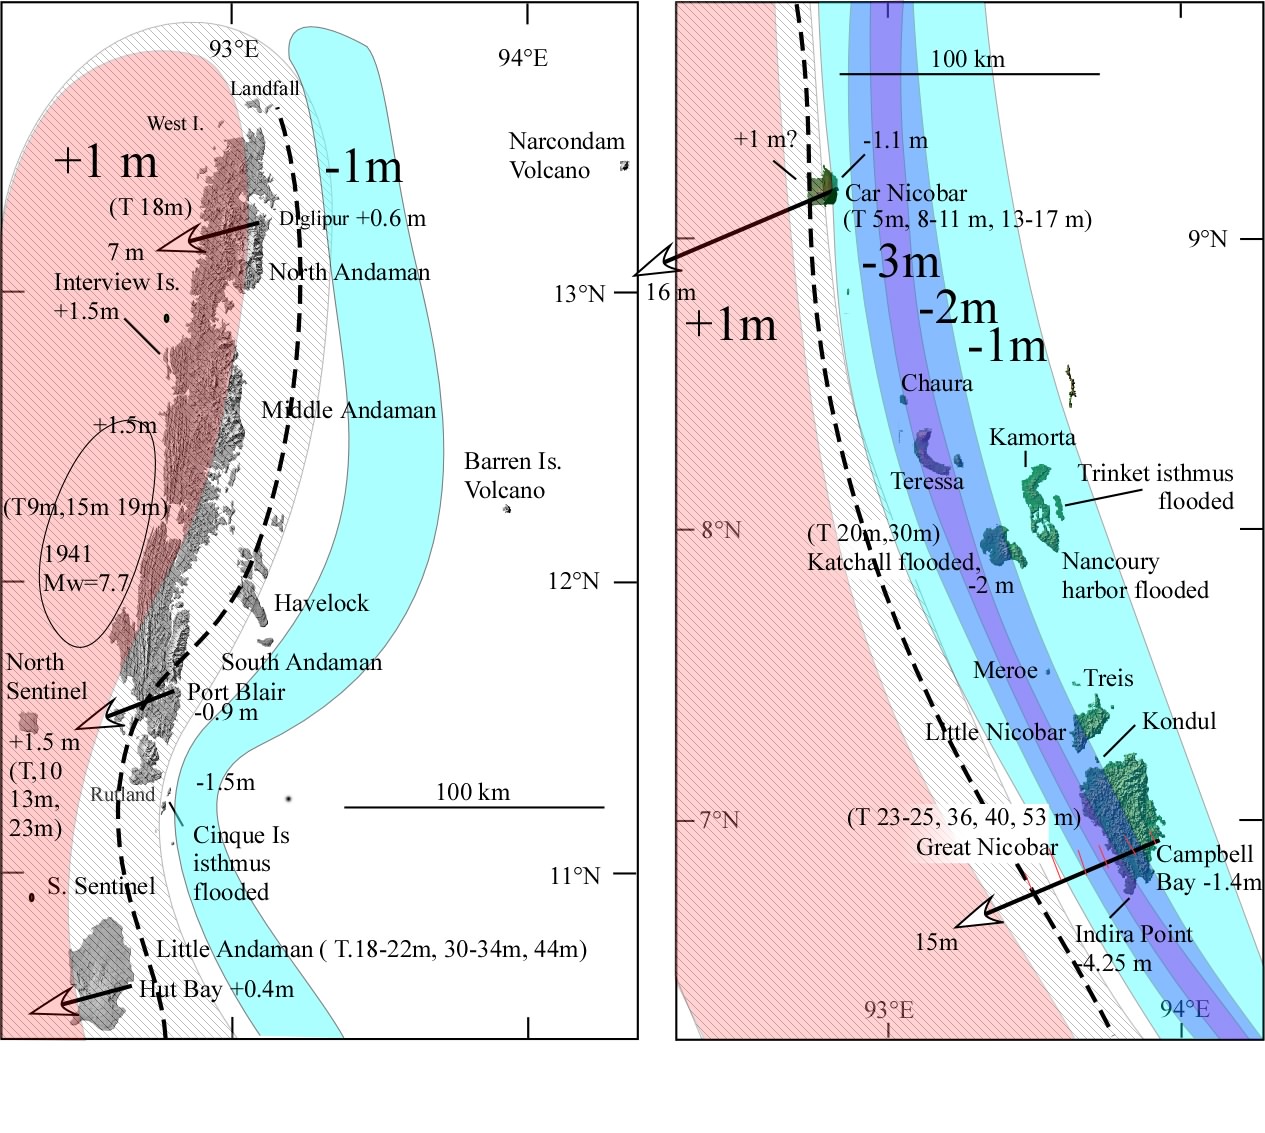
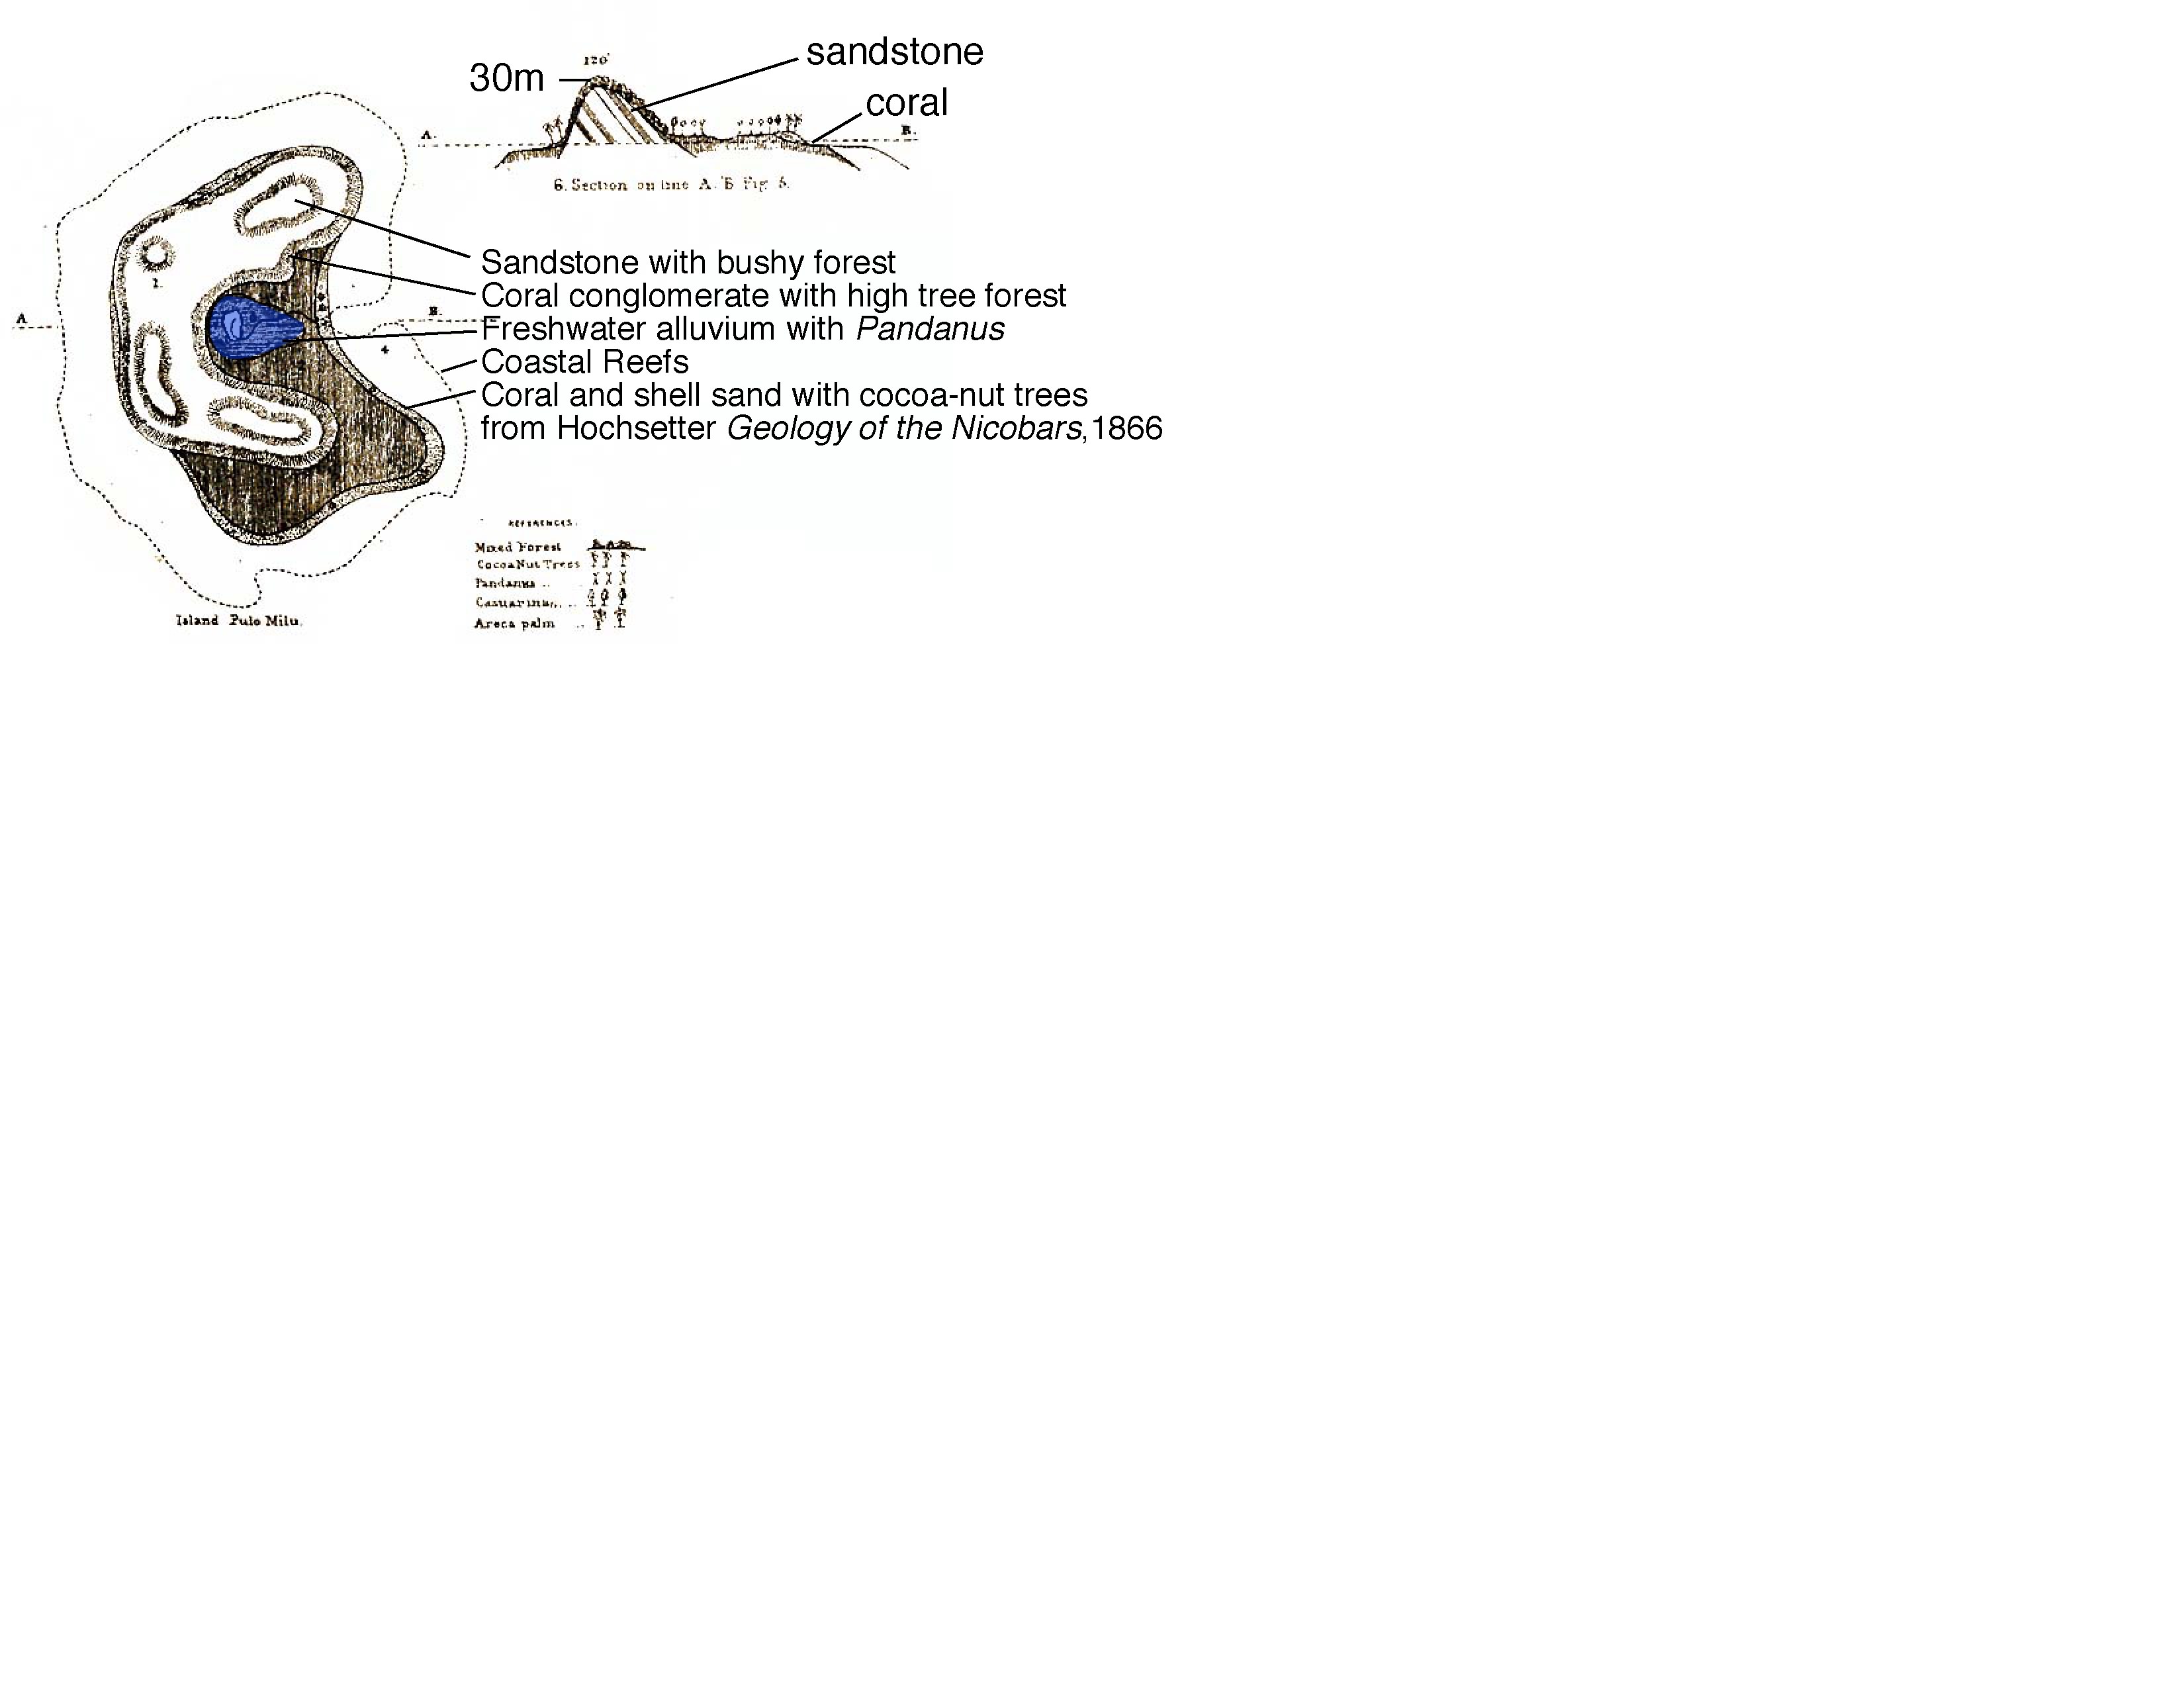
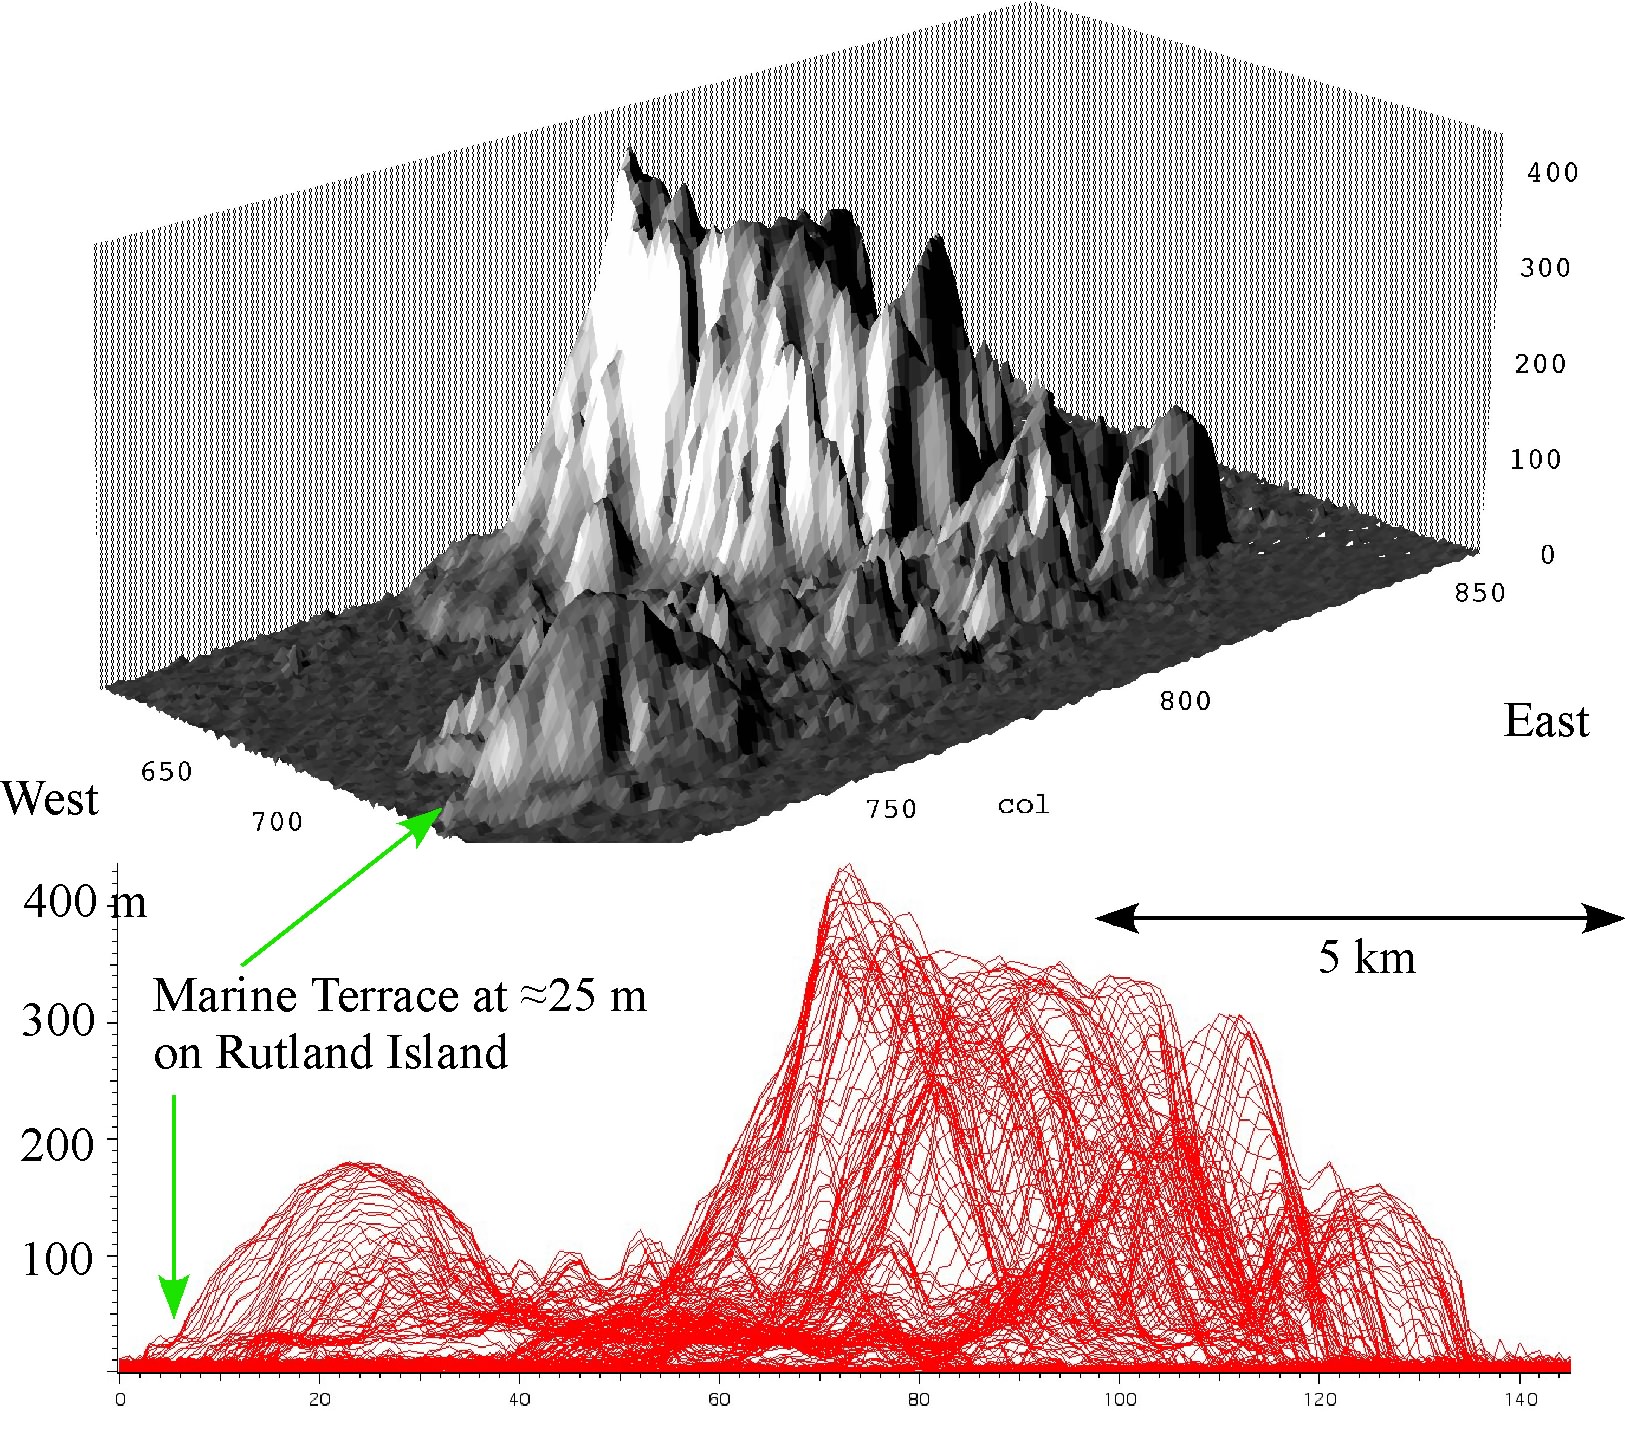
Geological studies in the Andaman and Nicobar Islands since 1830 report marine terraces, uplifted coral reefs and submerged forests along the east and west coasts (T=height marine terraces on SRTM imagery) respectively, but few geologists considered earthquakes as a probable cause. Oldham describes extensive marine terraces present on several of the Andaman group ,: examples are visible on SRTM imagery from Sentinel Island and Rutland Island. Reports in 2005 indicate that the islands have tilted down to the east and up to the west during the earthquake. Photos show emergence of the western reef of North Sentinel Island and western Middle Andaman Island) . Parts of Port Blair and low-lying parts of all islands in the Nicobar group are now flooded. The southernmost Nicobars apparently subsided 4.25 m although GPS models suggest that actual subsidence may have been closer to 2 m. Data on the submergence of the Nicobar islands by more than 2 m is available in the form of NRSA satelite imagery (NRSA power-point file of Nicobar Islands ).

Global Sea level

Great subduction earthquakes raise sea level globally due to the same coseismic shallowing of the ocean floor that resulted in the tsunami*. The Chile 1960, and Alaska 1964 earthquakes are calculated to have increased sea level by 1.7 mm and 0.7 mm respectively.  The current earthquake may raise sea level by approximately 0.5 mm, adding roughly 30 % to this year's annual rise of sea level. Earthquake induced increments are slowly removed between large earthquakes so that there is no net cululative rise in sea level from large events. *Bilham, R. and S. Barrientos, Great earthquakes and sea level, Nature (Lond), 350, 386, 1991. The earthquake resulted in seiches in North America. A 70 minute duration 4.5 nanoradian surge to the NE was recorded near Seattle in Washington state. The free oscillations of the Earth are expected to continue beyond mid January.


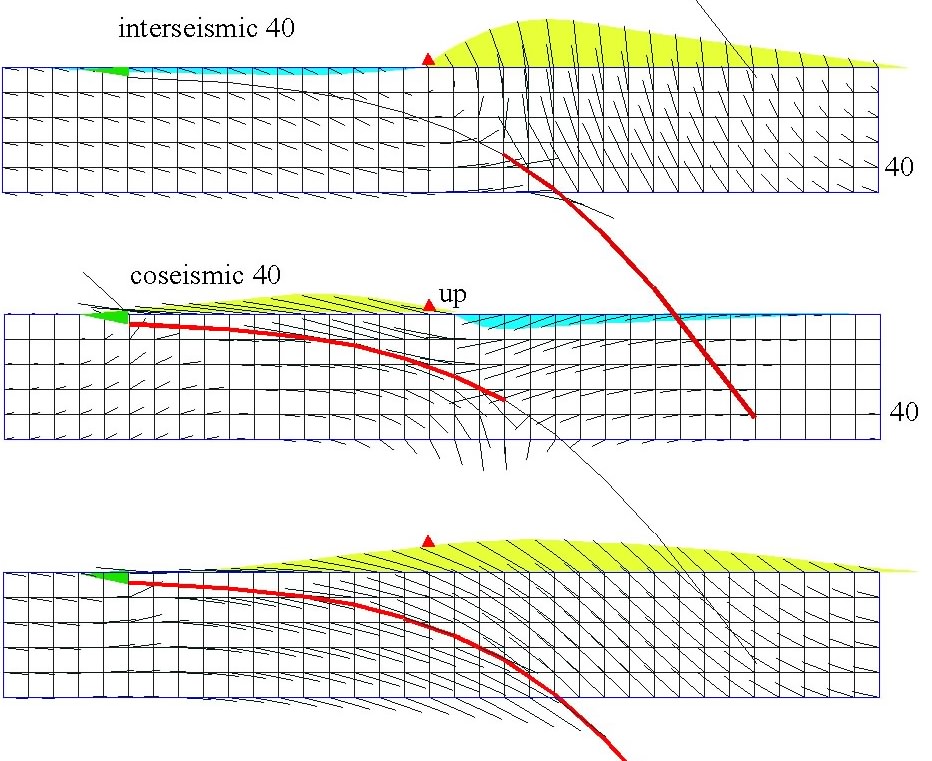
Rupture and afterslip propagation The mainshock as recorded by the P-wave ruptured at 2.1 km/s throughout the 1300 km long rupture, however, substantial displacements propagated northward more slowly.Several rupture models have been developed, each able to emulate the first few minutes of the earthquake but failing currently to model the northward propagating rupture. Despite a month of aftershocks their cumulative energy release is equivalent to a single Mw<7.5 earthquake (1/200 of the moment release of the Mw=9 mainshock). Click for larger view with Harvard CMT solutions.


Previous tsunamis in the Bay of Bengal in 1881, 1883, 1907 and 1941. ( see NOAA compilation for complete listing) Tsunamis from Sumatran earthquakes of 1833 and 1861 occurred before the introduction of harbour tide gauges in most parts of the world. The 1833 tsunami, however, has been modelled mathematically. A session at  a June 2004 NASA conference in Bangalore highlighted the importance of characterising tsunami hazards on India's coastline (download 1.5 Mb pdf,


1881 earthquake and tsunami. Earthquakes on 31 Dec 1881 and 26 June 1941 caused 1 m high tsunamis to run up on India's eastern coast (read accounts of 1881 tsunami), and the waves from the Krakatoa eruption of 1883 caused a measured maximum amplitude of 56 cm (Walker, 1884; Ortiz and Bilham, 2002, pdf), contrary to recent assertions of larger amplitudes claimed by several authorities. The 1881 tsunami amplitude attained 1.04 m at Chennai (at low tide) and was caused by 2.7 m of slip on a 150 km by 50 km patch (Mw=7.9) centered on Car Nicobar.


1941 earthquake and tsunami. The 1941 earthquake ( Mw=7.7) occurred just before the Japanese occupation of the Andaman Islands and appears to have ruptured the region near South Andaman Island. No tsunami records have survived for the 1941 earthquake, and despite an unattributed claim of 3000 dead [Murty and Rafiq, 1991], no official records confirm these numbers. Although it is possible that official damage data were deliberately suppressed for this earthquake, as they were for the wartime Ms=7 Mymensingh earthquake in what is now northern Bangladesh, a more likely explanation is that no deaths occurred. Were the earthquake Mw=7.7, the tsunami amplitude would have been less than 1 m. Field data for the 1941 earthquake were published a dozen years after its occurrence [Krishnan, 1953; Jhingran, 1953], and much of the data were collated after the end of World War II, five years after the event. Part of the cellular jail, a large masonry structure near Port Blair, collapsed along with other masonry structures, damage near Port Blair that appears to have been more severe than the recent earthquake. Slumping, liquefaction and sand venting were recorded by eyewitnesses. Islands in the passage between Little Andaman and South Andaman sank more than 50 cm based on shoreline submergence and by more than 1.5 m based on seafloor soundings. Thirty-nine reports of intensities were estimated to not exceed Mercalli intensity VIII on most of the Andamans, with slightly higher intensity near Port Anson on the SW coast on Middle Andaman. Aftershocks were felt with diminishing frequency for the following 3 months [Jhingran, 1953]. An earthquake with a strike-slip mechanism (M = 6.2) caused damage in the Nicobar Islands in 1982 [Agrawal, 1983]. Numerous aftershocks of this magnitude have occurred along the island chain in the first month following the mainshock


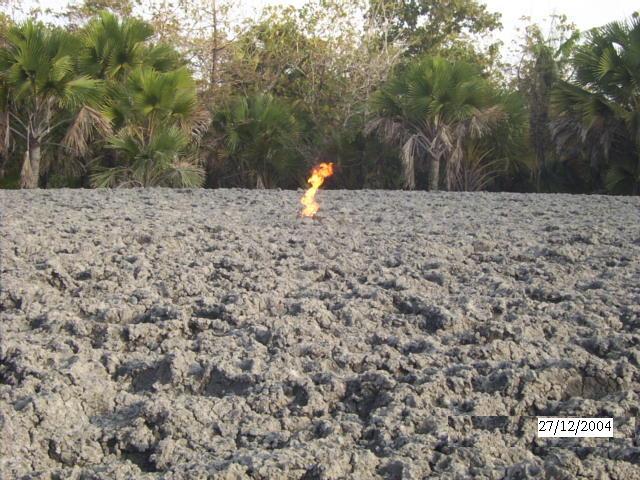
Volcanoes: a mud volcano on Middle Andaman island erupted with renewed vigour (3 m mud-fountaining, 27 Dec. photo of ignited gas flame courtesy Vineet Gahalaut), and although some press reports mentioned lava this was a reporting error (policeman do not erect barricades around lava flows). Early reports of an eruption of Barren Island, 135 km east of Port Blair, that is periodically active were also incorrect, and are caused by confusion in the popular press between mud volcanoes and basaltic volcanoes, in this case aggravated by the name of the mud-volcano Barren-1 (Barren One) compared to the basaltic volcano Barren Is. (Barren island). The region of Barren island was subjected to dilatational extension by the earthquake.


Nicobar/Andaman written history see Kurz and see SRL article


Future Ruptures

The plate boundary immediately north of the Andaman Islands has not slipped in historical time. Near the Bangladesh shoreline an inferred major earthquake occurred near Chittagong in 1769 that resulted in the sinking of an island presumably due to lateral spreading, however, spatial coverage of this earthquake is insufficient to be certain that it much exceeded Mw=7.5. Earthquakes on the Saigang fault, the onland continuation of the eastern plate boundary with the Eurasian plate are even less well documented, although it is certain that several major gaps remain that could sustain Mw=8 earthquakes. It appears unlikely that a significant tsunami can be generated from the remaining sub-marine portion of the Andaman plate boundary, and the renewal time for events such as that recently witnessed is many hundreds of years. A thousand years may need to elapse before 14 m of slip can be renewed on the plate boundary near the Andaman Islands at its current inferred convergence rate.


Implications for Himalayan Earthquakes

The historical inventory of Himalayan earthquakes has grown substantially in the past decade. Some have been downgraded in magnitude leading to the conclusion that only 30% of the Himalaya have slipped in the past three centuries. Newly discovered earthquakes occurring in the 10th to 16th centuries may have been much larger than recent events since some of these resulted in rupture of the frontal thrusts of the Himalaya, that did not accompany those that occurred in the past two centuries. In that the Sumatra/Nicobar/Andaman earthquake ruptured regions shallower than the major earthquakes in 1881 and 1941, a similar scenario can be invoked in the Himalaya, near incomplete ruptures of the plate boundary like those that occurred in 1833 and 1905. An implication of the 2004 earthquake is that M>8.5 earthquakes with >600 km long ruptures could rupture through these areas. See Centennial review of slip potential near Kangra.


Could we have predicted the 26 Dec 2004 tsunami?

We have no evidence to believe that M=9 earthquakes occur repeatedly as >650-km-long ruptures with 10 m of slip along the Andaman/Nicobar plate boundary.  Certainly we shall now seek such evidence.  On the other hand we knew that tsunamis have occured on both India's Malabar (1524, 1945) and Coromandel coastlines (pdf). At a June 2004 NASA hazards conference in Bangalore, a maximum wave height of 3 m was estimated might immerse parts of Chennai from a possible Andaman/Nicobar earthquake. We are currently unable to forecast the probability of tsunamigenic earthquakes near India, and it is thus unlikely that coastal defences would have been implemented even for the Kalpakkam nuclear power plant (shut down, and evacuated but not damaged 26 Dec) had a tsunami hazard study been completed.  However, a credible warning system could follow from such a study, since the coast of India is sufficient distance to provide a 2 hour warning of an Andaman or Nicobar initiated tsunami. Attempts were indeed made by tsunami experts on 26 December to alert responsible officials to an impending tsunami in the hours after it had been initiated and before it arrived in India and Sri Lanka.


Global Tsunami defenses

In that the parameters of great earthquakes can be automated within tens of minutes, and forward projections made of the approximate path of an advancing tsunami, the scientific community has been arguing for tsunami warning systems for coastal communities outside the Pacific for some time. Realtime alerts of inbound tsunamis require relatively simple monitoring systems at tele-tsunami distances because the damaging wave is usually preceded by slow anomalous sea level excursions. A simple real-time tsunami monitoring system has been demonstrated by Modesto Ortiz on the Mexico coastline, The Caribbean, the Mediterranean and the Atlantic coastlines are all vulnerable to tsunamis. Action plans for these communities could be as simple as an automatic alerts to radio stations, automatic voice messages and cell phone messages, and public sirens. More advanced plans might include mandatory earthquake-resistant stilt-houses, or numerous tsunami shelters (elevated platforms), with occasional tsunami drills. The ultimate defense for locally generated tsunamis is a tsunami barrier along the coast to protect villages, as has been implemented in parts of the Japanese coast, however, this is difficult for long featureless coastlines where it effectively demands the construction of a continuous marine dike.


Free Web Site Counters
Free Web Site Counter